PyGWalker
PyGWalker (from Kanaries) turns a pandas DataFrame into a Tableau-style exploration UI: drag fields onto shelves to build bar, line, scatter, and other charts, switch to a searchable data table, and save or export whatever you build. It’s the fastest way to hand an analyst a “play with this dataset yourself” experience without writing any chart code.
@render_pygwalker accepts a pandas (or, on a current-enough pygwalker, polars) DataFrame, or a widget built by pygwalker.api.anywidget.walk() (use walk() directly when you need options like theme_key, appearance, or a starting spec). Every chart PyGWalker draws is computed by DuckDB running in your Python process – the browser sends SQL, Python runs it, and only the aggregated result comes back. That means a one-row summary costs the same, whether the underlying frame has 500 rows or 5 million (see “Any size dataset” below). It also means the renderer won’t render at all until you lock down DuckDB’s default connection – this is the first thing to understand before using it, and the rest of this guide assumes you’ve done it.
There are no reactive accessors on render_pygwalker: PyGWalker’s widget carries no traits that track the explorer’s live state, so there’s nothing for reactive_read() to watch either (verified below). What you get instead is widget.on_msg(), the same mechanism the accessors are built on in other renderers, exposed directly: register a handler and PyGWalker tells you when a chart is saved (with its full spec) or exported (with the computed DataFrame). This guide shows the verified patterns for using that.
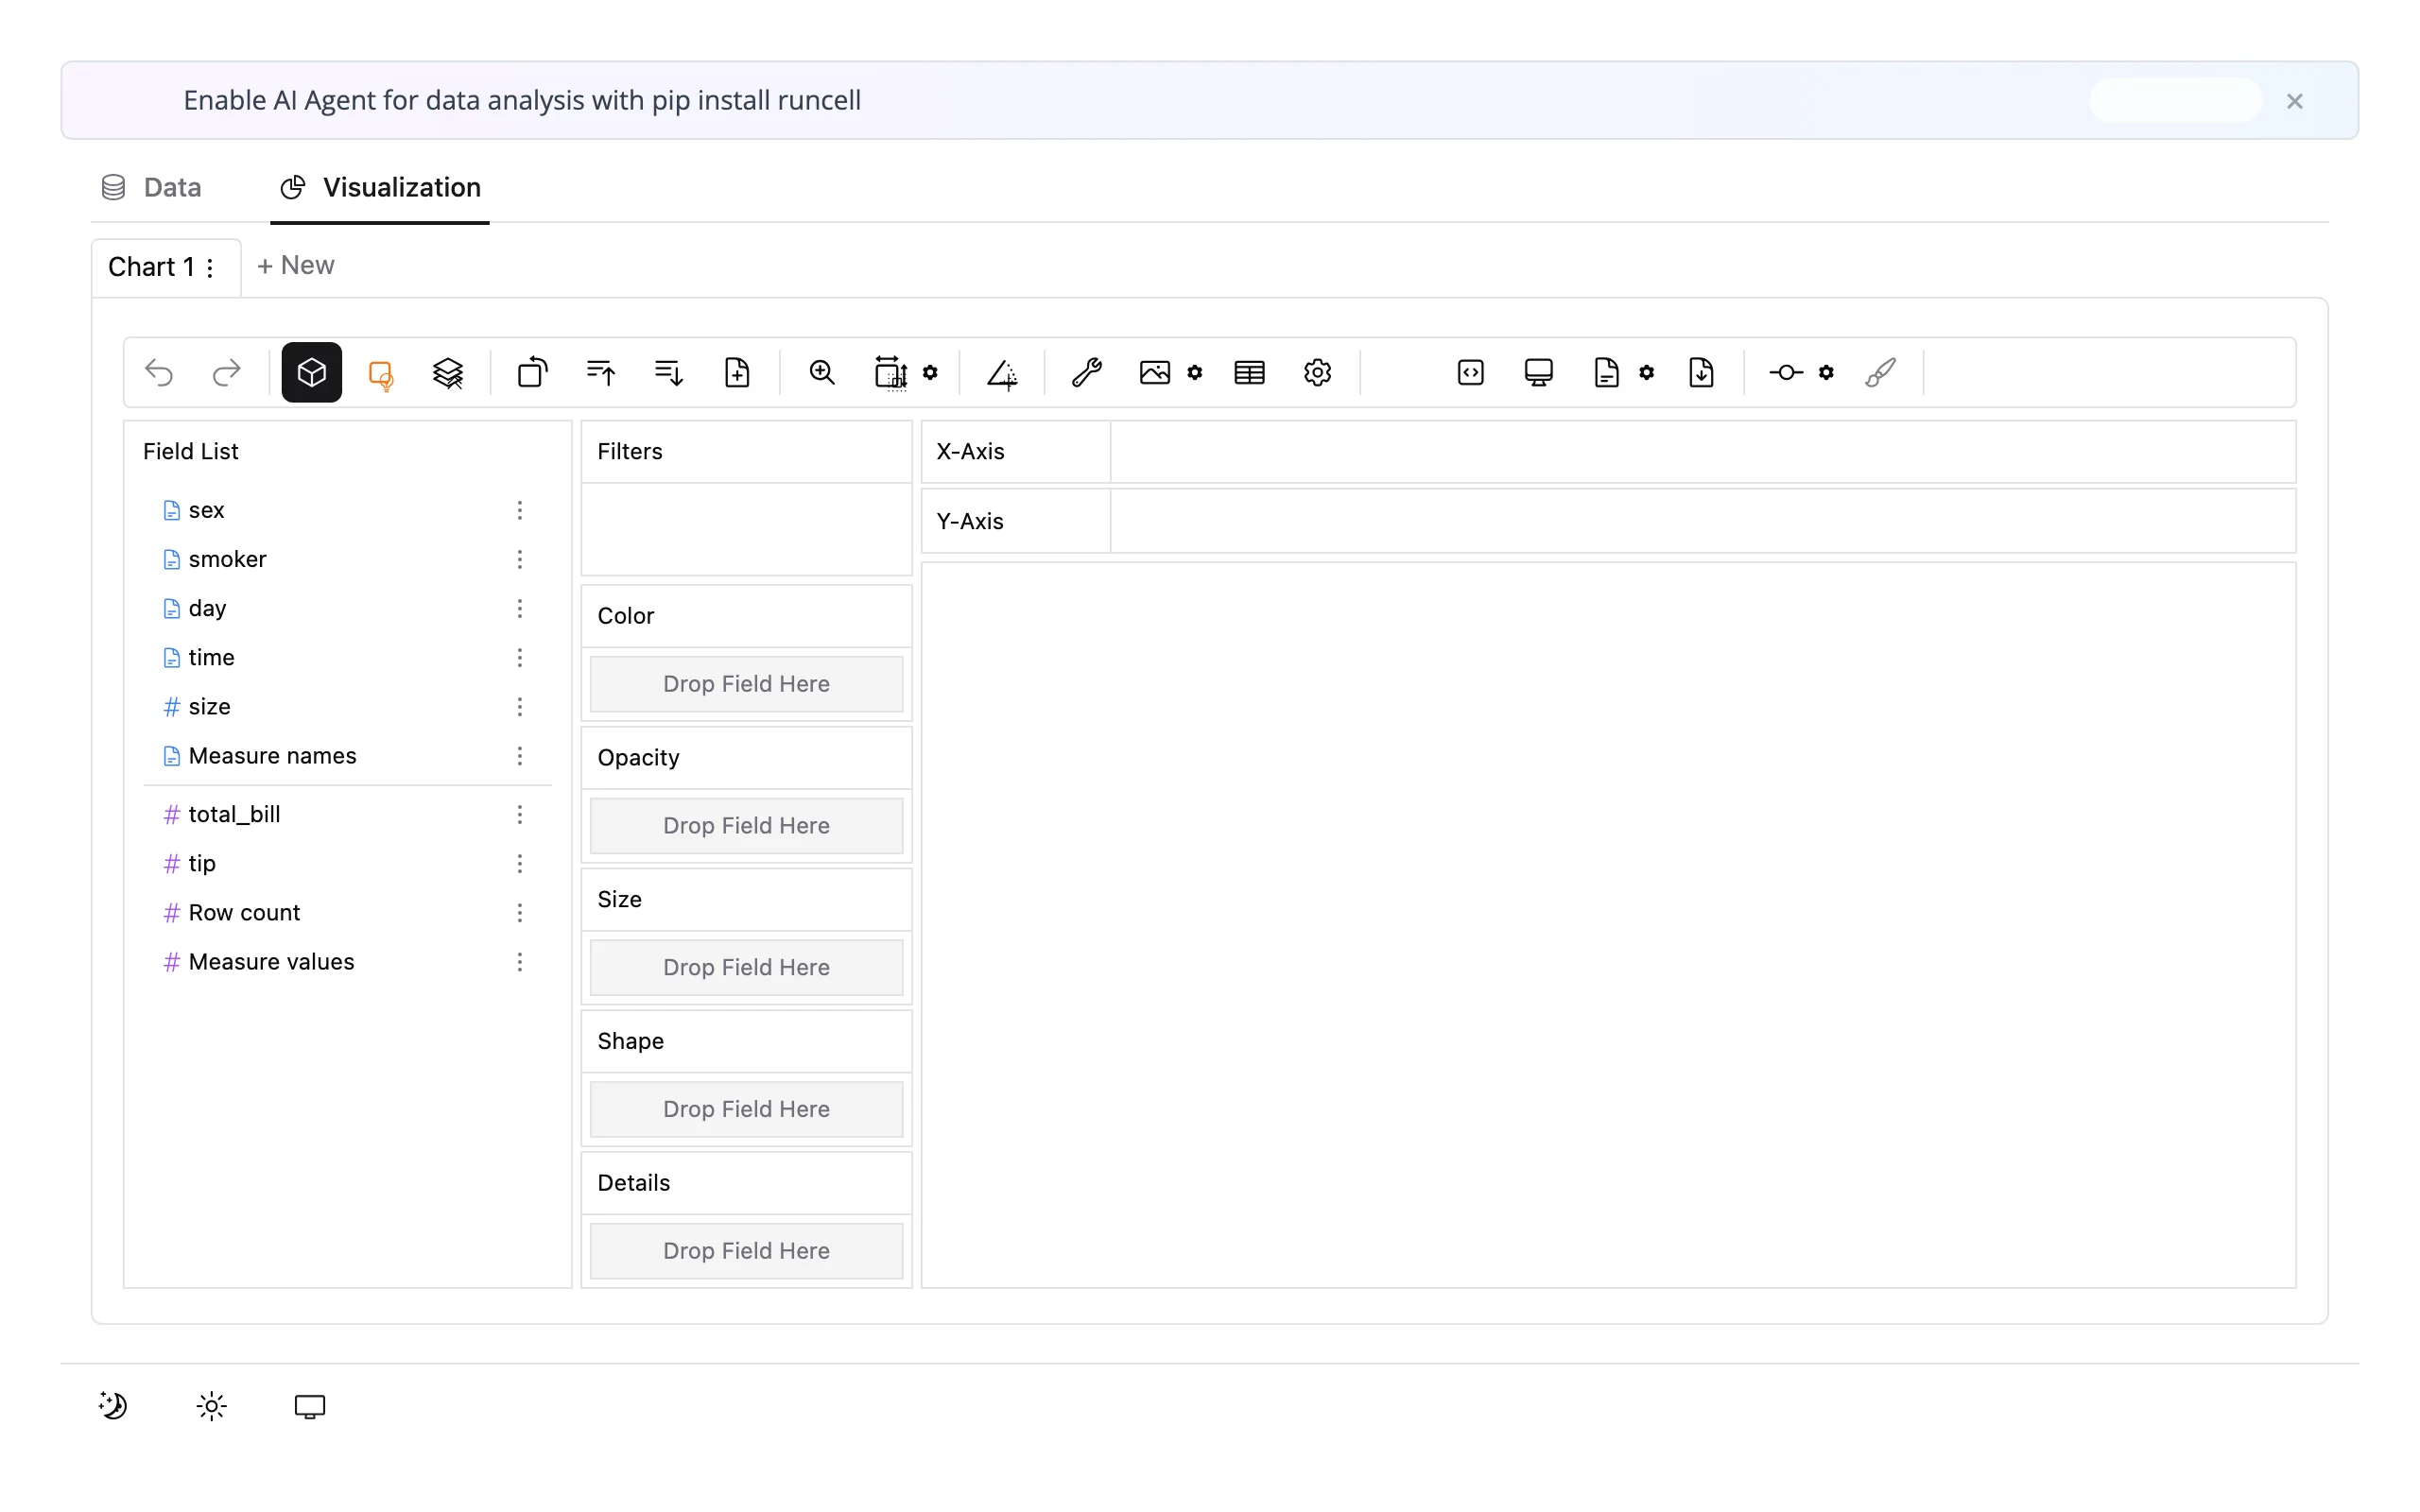
Reach for PyGWalker when you want users to build their own ad hoc charts over a DataFrame you don’t know the shape of in advance. If you already know what charts you want and just need the user to filter or drill into them, a plotting library driven from Shiny inputs is simpler and cheaper. For a different “let the user explore” model, see perspective (pivot-table style, with live filter() and view_config() accessors you can read back without saving), quak (a fast sortable/ filterable big-table browser, not a chart builder), and mosaic (you design a fixed set of linked charts and let users cross-filter them, instead of letting them build arbitrary charts). See “Pairing with other guides” below for more on when to pick which.
Installation
pip install 'shinywidgets[pygwalker]'This pulls in pygwalker, duckdb, and sqlglot (shinywidgets uses sqlglot to validate the SQL PyGWalker’s browser sends; see “Security and privacy” below).
Security and privacy
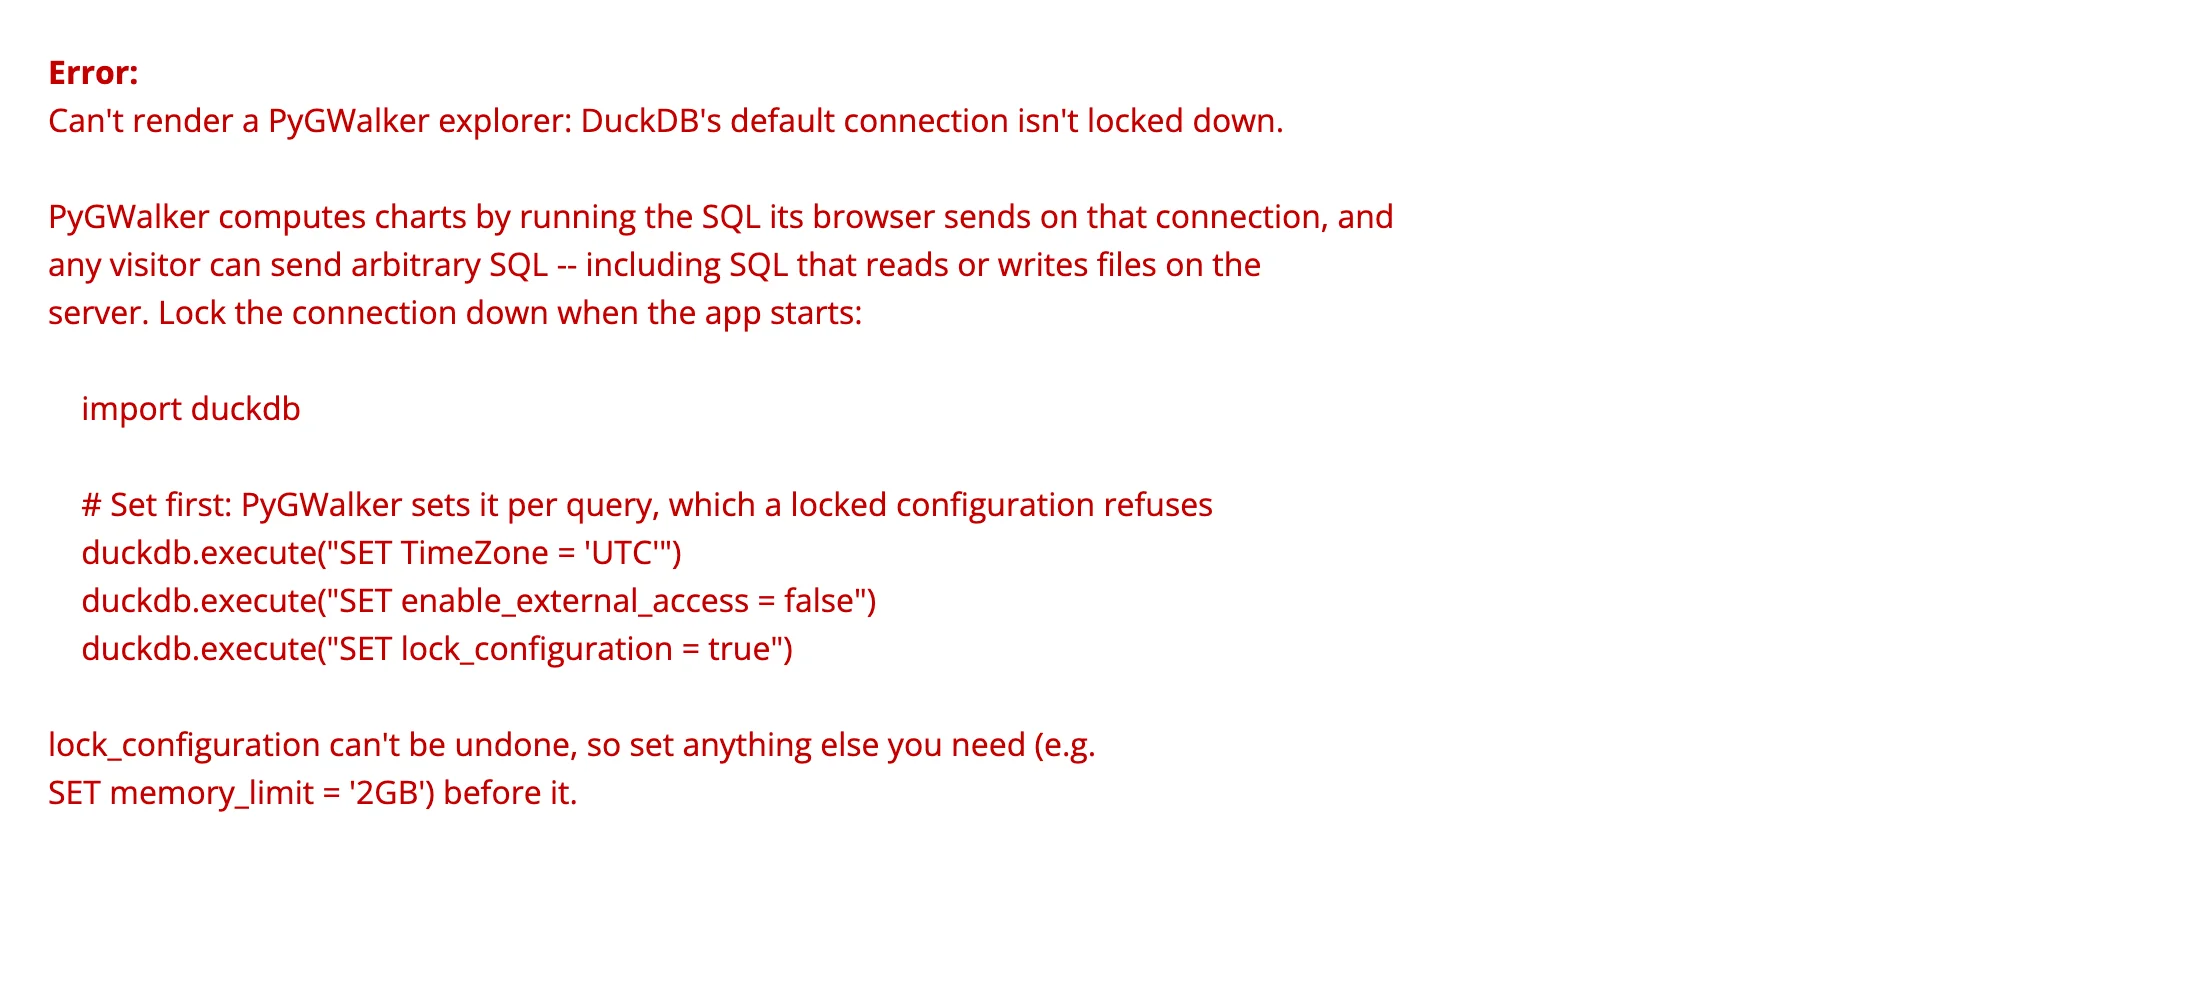
Read this before putting render_pygwalker in front of anyone you don’t trust. PyGWalker’s charts are computed by SQL that the browser sends, run on DuckDB’s process-wide default connection in your Python process. Unless that connection is locked down, any visitor can send arbitrary SQL – including SQL that reads or writes files on the server. Because of this, render_pygwalker refuses to render until the default connection is locked down.
Do this once, before any render_pygwalker output renders. In Shiny Express, put it in a sibling globals.py (not inline in the app file – see the gotcha below for why that matters here specifically):
# Shiny Express can run a sibling globals.py more than once per process (once
# to build the page, again when a session connects) -- unlike plain `import`,
# which Python would cache. DuckDB's `lock_configuration` can only be set
# once per process; setting it again raises. So the lockdown below checks
# first and is a no-op the second time, which is what makes it safe to put
# here at all. Never do this lockdown inline in an Express app file: it would
# run on every execution with no way to check first, and crash the first
# session that connects after the page itself has already run it once. See
# "Security and privacy" in the guide for what this protects against.
import duckdb
import pygwalker

# PyGWalker otherwise phones home from both the Python process and every
# visitor's browser
pygwalker.GlobalVarManager.set_privacy("offline")

already_locked = duckdb.execute(
    "SELECT current_setting('lock_configuration')"
).fetchone()[0]
if not already_locked:
    # Set first: PyGWalker sets it per query, which a locked configuration refuses
    duckdb.execute("SET TimeZone = 'UTC'")
    duckdb.execute("SET enable_external_access = false")
duckdb.execute("SET lock_configuration = true")examples/globals.py; every other example in this guide starts with import globals # noqa: F401. In Shiny Core, the equivalent code works fine directly at module scope (Core doesn’t re-run your file per session – see the gotcha below for why Express needs the guard and Core doesn’t).
If you skip this, render_pygwalker raises before drawing anything:
What the lockdown does and doesn’t protect. Verified directly against shinywidgets/_render_widget.py (require_duckdb_lockdown, validate_visitor_sql, harden_walker_widget) and the existing tests/playwright/render_pygwalker suite (all pass on current main):
enable_external_access = false+lock_configuration = truestops the browser’s SQL from reading or writing server files, or from undoing the lockdown. Confirmed: a visitor-sentread_csv('/etc/...')and aCOPY ... TOboth fail, and so doesSET enable_external_access = true.- shinywidgets additionally restricts every query the browser sends to a single
SELECTagainst the widget’s own registered view (noDDL, no other tables or views) – because every PyGWalker widget in the process shares one DuckDB connection and one fixed view name (pygwalker_mid_table). Without this, one visitor’s query could read a table another widget registered. - Two browser-triggered actions are rejected outright because there’s no safe form of them: uploading a Kanaries API token (a visitor could overwrite the server’s stored credentials) and “open in desktop” (it shells out to the server’s
gw://protocol handler). - What it does not give you: per-user data isolation. Every widget shares the one connection and table name; each request re-registers its own data immediately before querying, which holds up under Shiny’s single-threaded request handling but isn’t a boundary to build on. A visitor can also send an expensive query that blocks the whole process (every session, not just theirs) while it runs. If different users must explore mutually private data, prefer a renderer that keeps data apart by design.
- Separately, call
pygwalker.GlobalVarManager.set_privacy("offline")to stop PyGWalker’s own telemetry (usage events and an update check) from both your Python process and every visitor’s browser. This is about phoning home, not about the SQL security model above – do both.
PyGWalker is best suited to trusted or internal users even with the lockdown in place. See “Gotchas” for more nuance (the ad banner, the save/export toasts).
Quick start
import plotly.express as px
from shiny.express import ui

import globals  # noqa: F401 -- locks down DuckDB once per process; see globals.py
from shinywidgets import render_pygwalker

ui.page_opts(fillable=True)

tips = px.data.tips()


@render_pygwalker
def explorer():
    return tips
That’s the whole app: a DataFrame in, a full drag-and-drop explorer out, filling its container.
What you can build
Drag-and-drop chart building
Drag a field onto an axis shelf and PyGWalker infers a sensible mark, aggregates numeric measures (sum by default, changeable per field), and adds a legend for anything on Color. Dragging total_bill onto X, tip onto Y, and smoker onto Color produces:
import plotly.express as px
from shiny.express import ui

import globals  # noqa: F401 -- locks down DuckDB once per process; see globals.py
from shinywidgets import render_pygwalker

ui.page_opts(fillable=True)
ui.markdown(
    "Drag **total_bill** onto *X-Axis*, **tip** onto *Y-Axis*, and **smoker** onto "
    "*Color* -- PyGWalker aggregates, charts, and colors it, with no chart code."
)

tips = px.data.tips()


@render_pygwalker
def explorer():
    return tips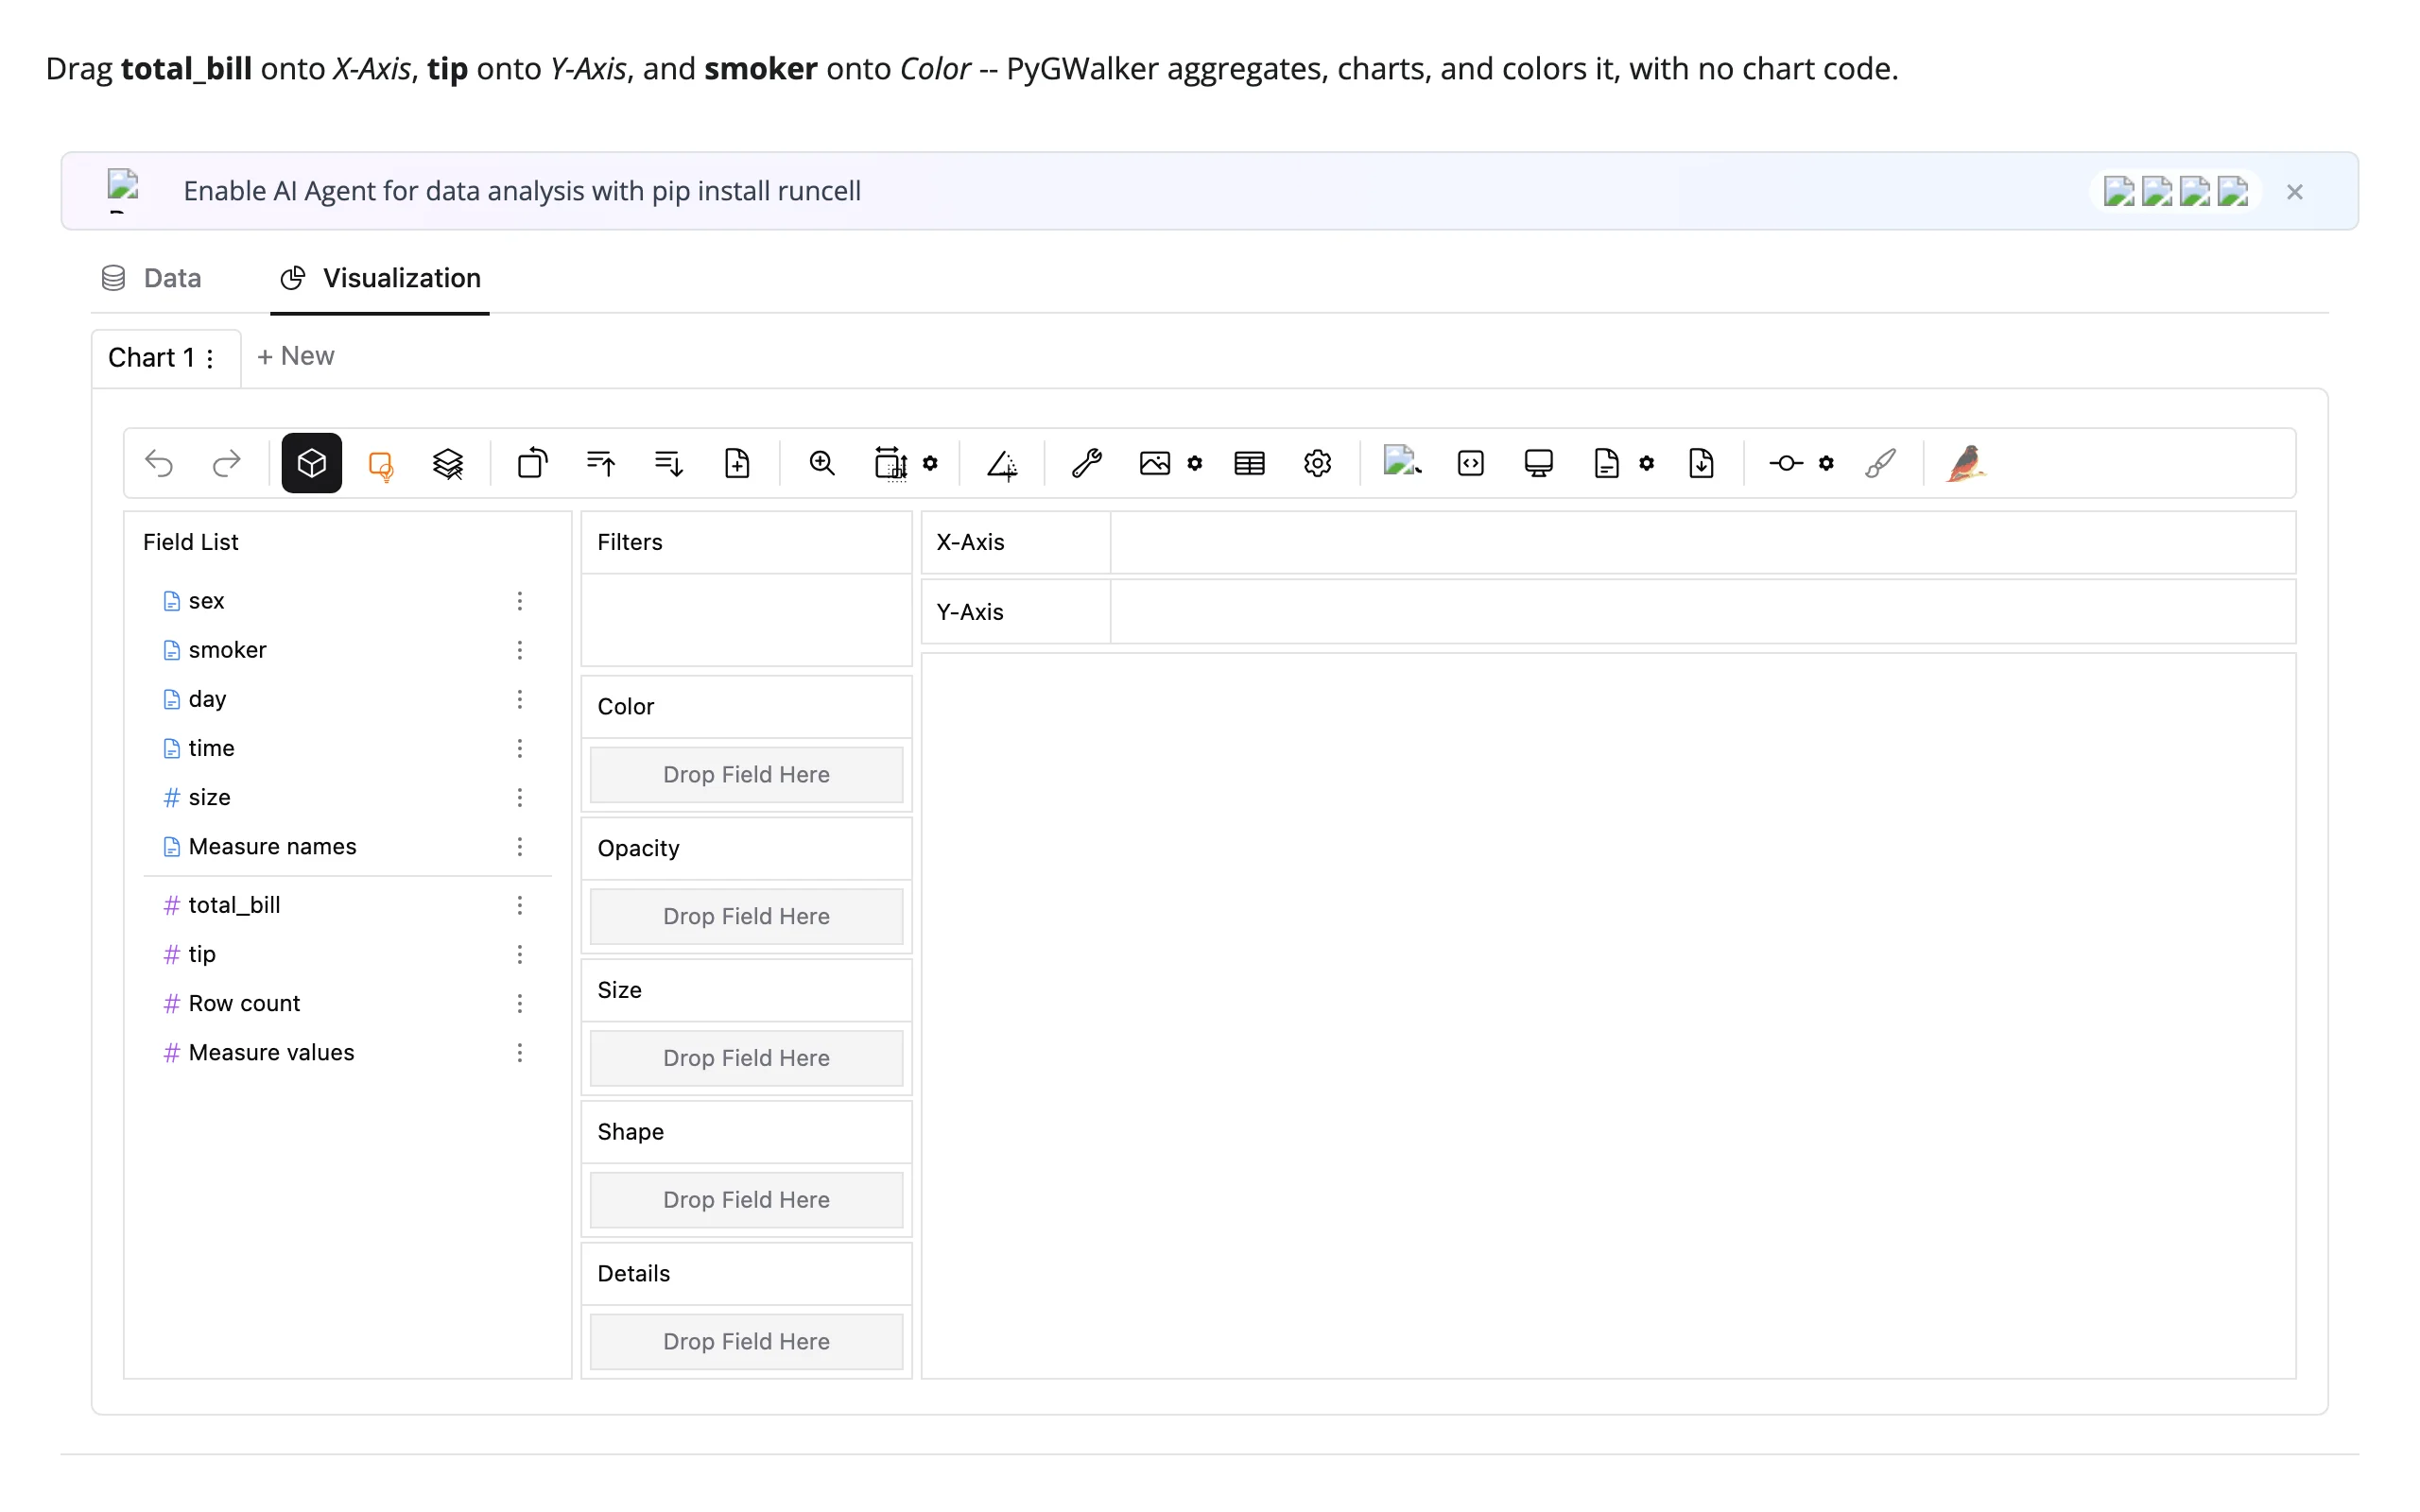
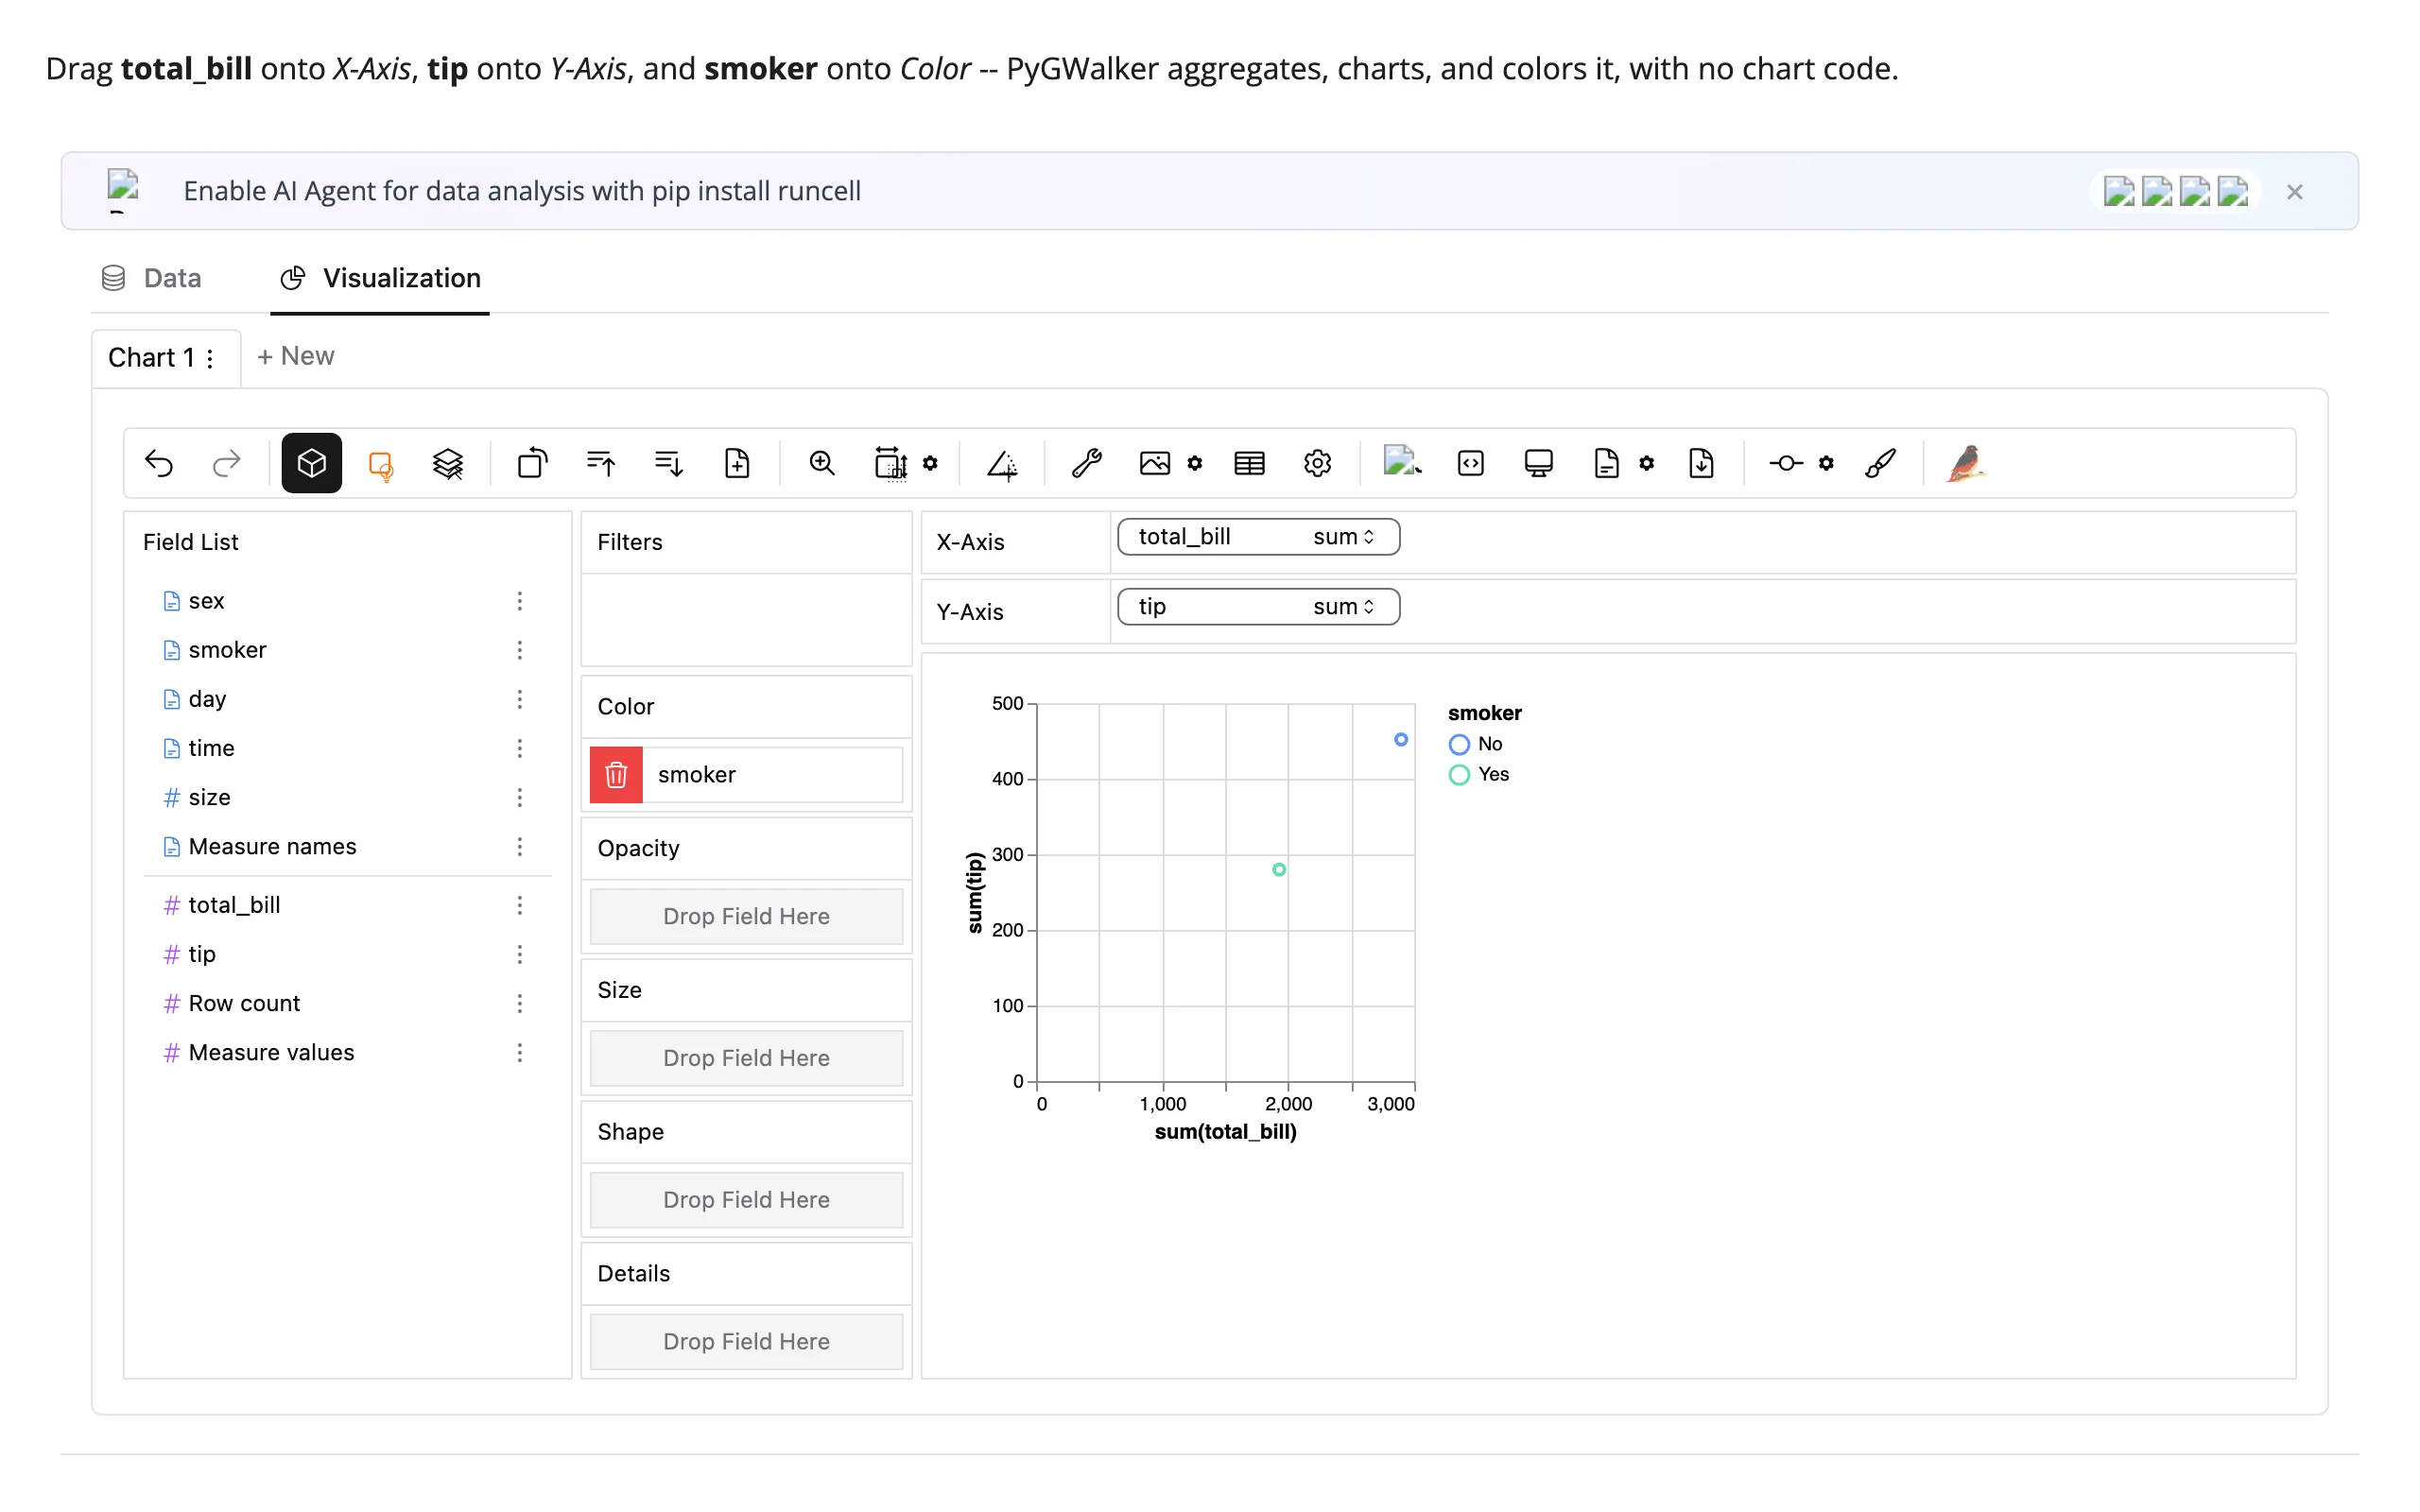
Verified via the saved chart spec (Ctrl/Cmd+S, read back in Python – see below): the shelves hold exactly columns: [total_bill], rows: [tip], color: [smoker], matching what’s on screen.
The Data tab
Every explorer has a Data tab next to Visualization – a searchable, paginated table over the same data, with a per-column histogram or category breakdown in the header:
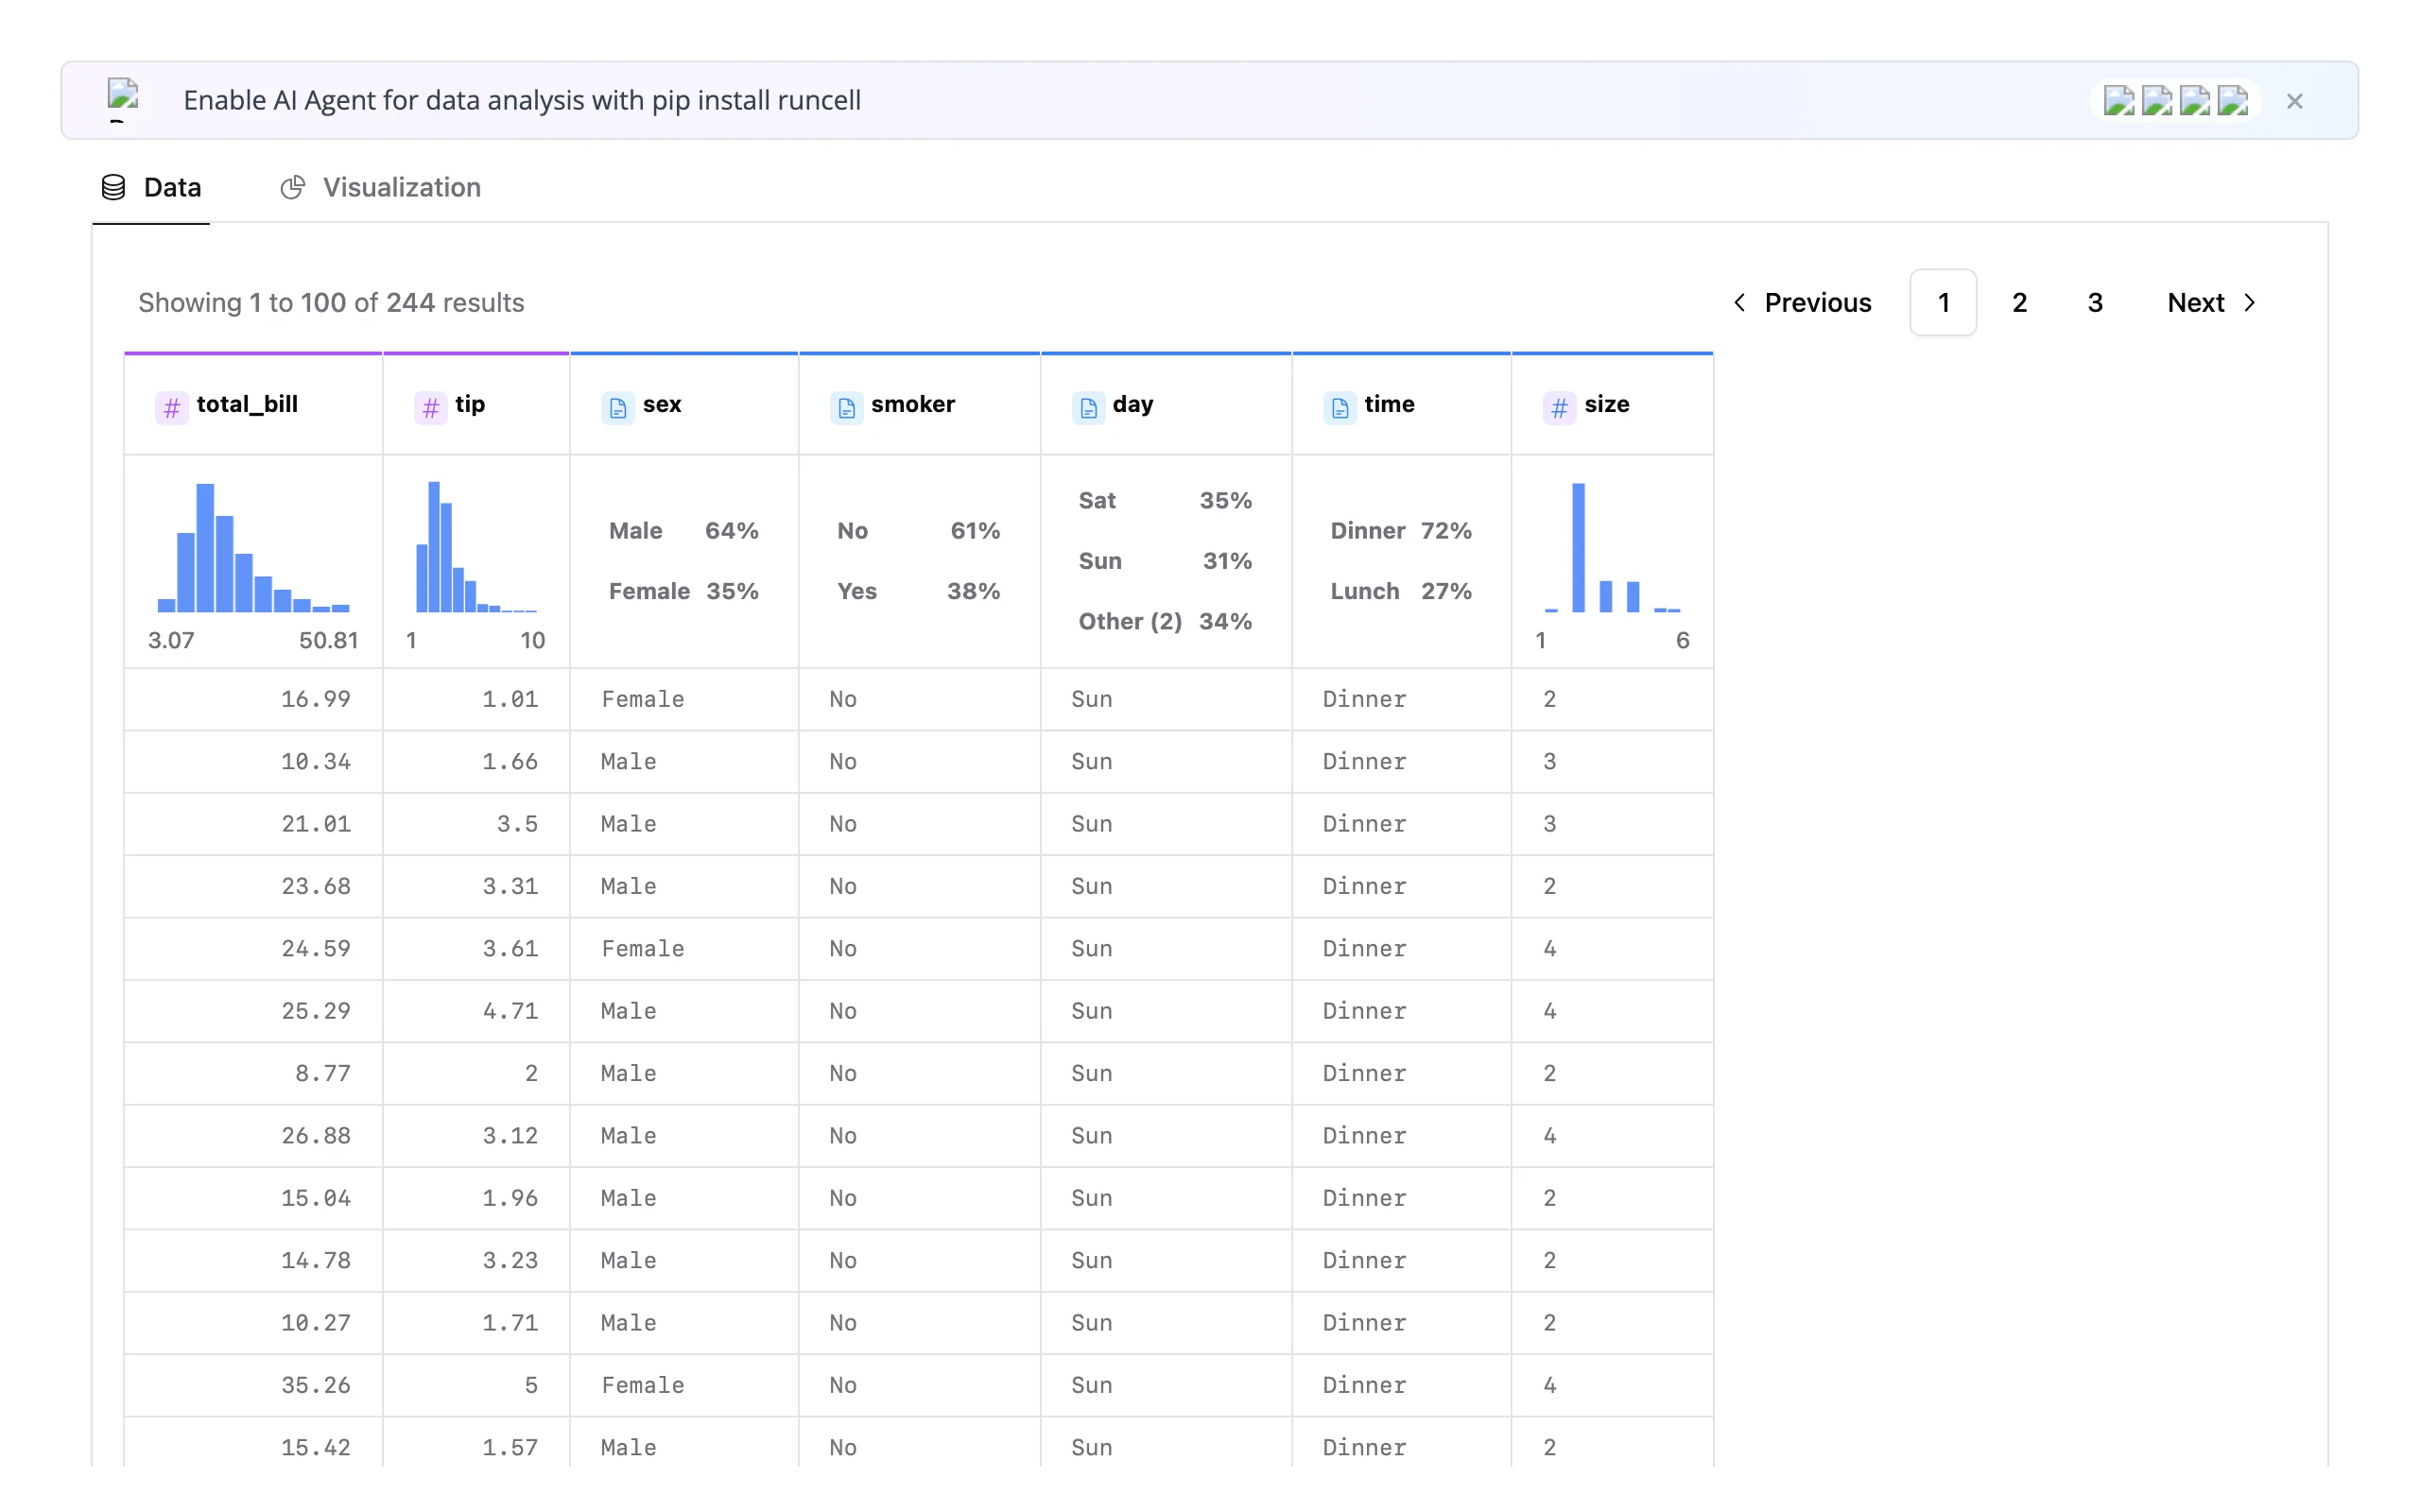
Rows are fetched from Python on demand (kernel computation, see next section), not shipped up front.
Any size dataset, because DuckDB computes it
The browser never holds your data – it sends SQL, and DuckDB runs it in your Python process, so only the query result crosses the wire. This explores 1,000,000 synthetic taxi-fare rows and builds an aggregated chart exactly as fast as the 244-row tips example:
import numpy as np
import pandas as pd
from shiny.express import ui

import globals  # noqa: F401 -- locks down DuckDB once per process; see globals.py
from shinywidgets import render_pygwalker

ui.page_opts(fillable=True)
ui.markdown(
    "1,000,000 synthetic rows. PyGWalker aggregates with DuckDB in the Python "
    "process, so only the query *result* crosses the wire -- opening the explorer "
    "and building a chart here cost the same bytes and time as "
    "02_build_a_chart.py's 244 rows."
)

rng = np.random.default_rng(0)
n = 1_000_000
trips = pd.DataFrame(
    {
        "fare": rng.gamma(4, 3, n).round(2),
        "distance_mi": rng.gamma(3, 1.5, n).round(2),
        "borough": rng.choice(
            ["Manhattan", "Brooklyn", "Queens", "Bronx", "Staten Island"],
            n,
            p=[0.45, 0.25, 0.2, 0.07, 0.03],
        ),
        "payment": rng.choice(["card", "cash"], n, p=[0.7, 0.3]),
    }
)


@render_pygwalker
def explorer():
    return trips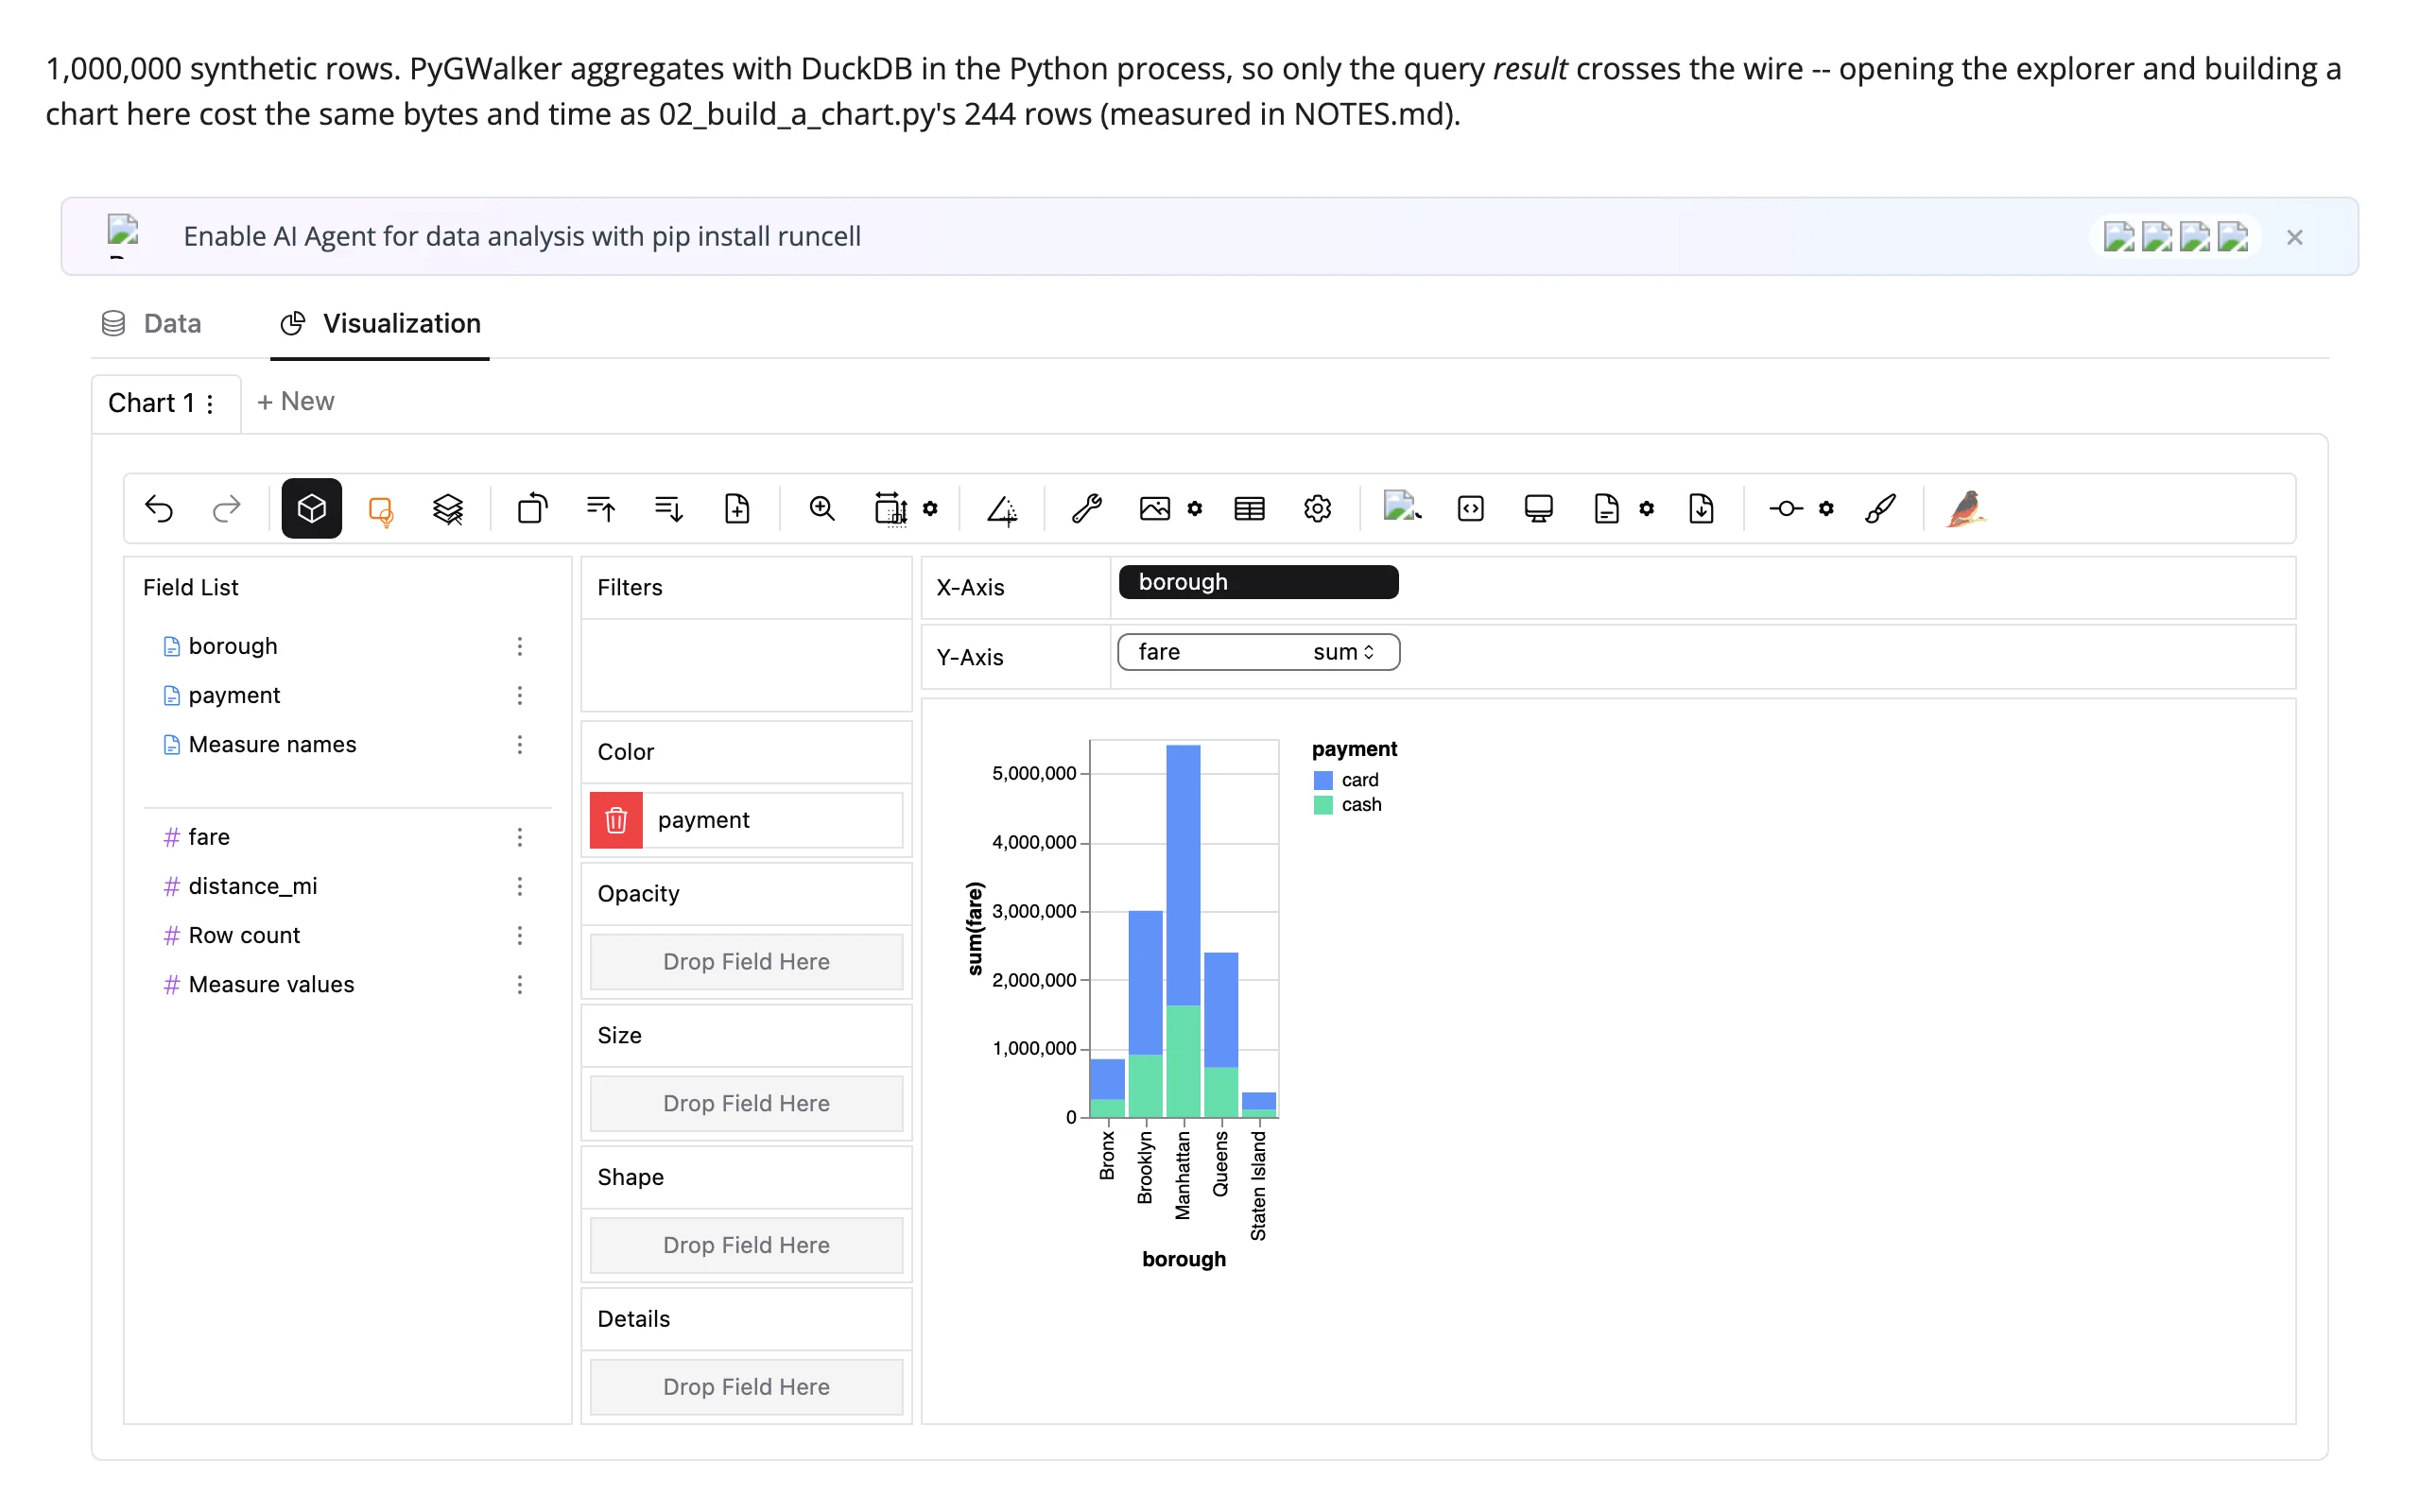
Measured with Playwright: opening the explorer and the first chart query cost identical bytes and time for 500, 50,000, and 1,000,000 rows –
| 500 / 50K / 1M rows (all identical) | |
|---|---|
| Initial render (ESM bundle + schema) | ~10.16 MB over the websocket, ~3.3 s to an interactive Field List |
| One aggregated chart query (group by + sum) | ~1.2 KB sent, ~2 KB received, ~2.8 s wall time |
One correction to a common assumption: PyGWalker’s own walk() (what kernel_computation vs. client-side usually refers to) is pinned to kernel_computation=True inside pygwalker.api.anywidget.walk() – passing kernel_computation=False yourself raises TypeError: ... got multiple values for keyword argument 'kernel_computation' (verified directly against pygwalker.api.anywidget.walk). There’s no client-side mode available through this renderer; “kernel computation” here isn’t a choice you make, it’s simply how the anywidget integration always works, which is exactly what makes the scale-invariance above possible. The ~10 MB figure above is PyGWalker’s JavaScript bundle, sent fresh on every render (re-renders aren’t free – see “Updating from Python” below).
Reacting to user interaction
There are no accessors on render_pygwalker (confirmed: it declares no _accessor_specs, unlike quak’s sql()/data() or perspective’s filter()/ view_config()). There’s also nothing worth reading with reactive_read(): the rendered widget’s only data-carrying trait is props, a one-way JSON blob sent once at construction. Confirmed directly (widget.trait_names() on a freshly built walker lists only ipywidgets boilerplate – layout, tooltip, comm, _view_*, etc. – plus props; nothing tracks the explorer’s live state).
What is available, and is the mechanism the accessors in other renderers are built on: PyGWalker’s widget accepts a .on_msg() handler, and every action the browser takes (building a chart, saving, exporting, switching tabs) arrives there as a pyg_request message. Two are useful to applications:
| Message action | Fires when | Payload |
|---|---|---|
update_spec |
User presses Ctrl/Cmd+S (or the save icon) | data["visSpec"]: the full chart spec (shelves, field roles, layout) |
export_dataframe_by_sql (or export_dataframe) |
User clicks the export icon | Nothing useful in the message itself – read pygwalker.GlobalVarManager.last_exported_dataframe immediately after (process-global, but it’s already this session’s result since PyGWalker’s own handler runs first) |
This wires both up:
import json

import pandas as pd
import plotly.express as px
import pygwalker
from shiny import reactive
from shiny.express import render, ui

import globals  # noqa: F401 -- locks down DuckDB once per process; see globals.py
from shinywidgets import render_pygwalker

ui.page_opts(fillable=True)

tips = px.data.tips()

saved_spec = reactive.value(None)
exported = reactive.value(None)

with ui.layout_columns(col_widths=[8, 4]):
    with ui.card(full_screen=True):

        @render_pygwalker
        def explorer():
            return tips

    with ui.card():
        ui.card_header("What Python saw")

        @reactive.effect
        def _register_on_msg():
            def on_msg(widget, content, buffers):
                if content.get("type") != "pyg_request":
                    return
                msg = content["msg"]
                if msg["action"] == "update_spec":  # Ctrl/Cmd+S
                    saved_spec.set(msg["data"]["visSpec"])
                elif msg["action"].startswith("export_dataframe"):  # export icon
                    exported.set(pygwalker.GlobalVarManager.last_exported_dataframe)

            explorer.widget.on_msg(on_msg)

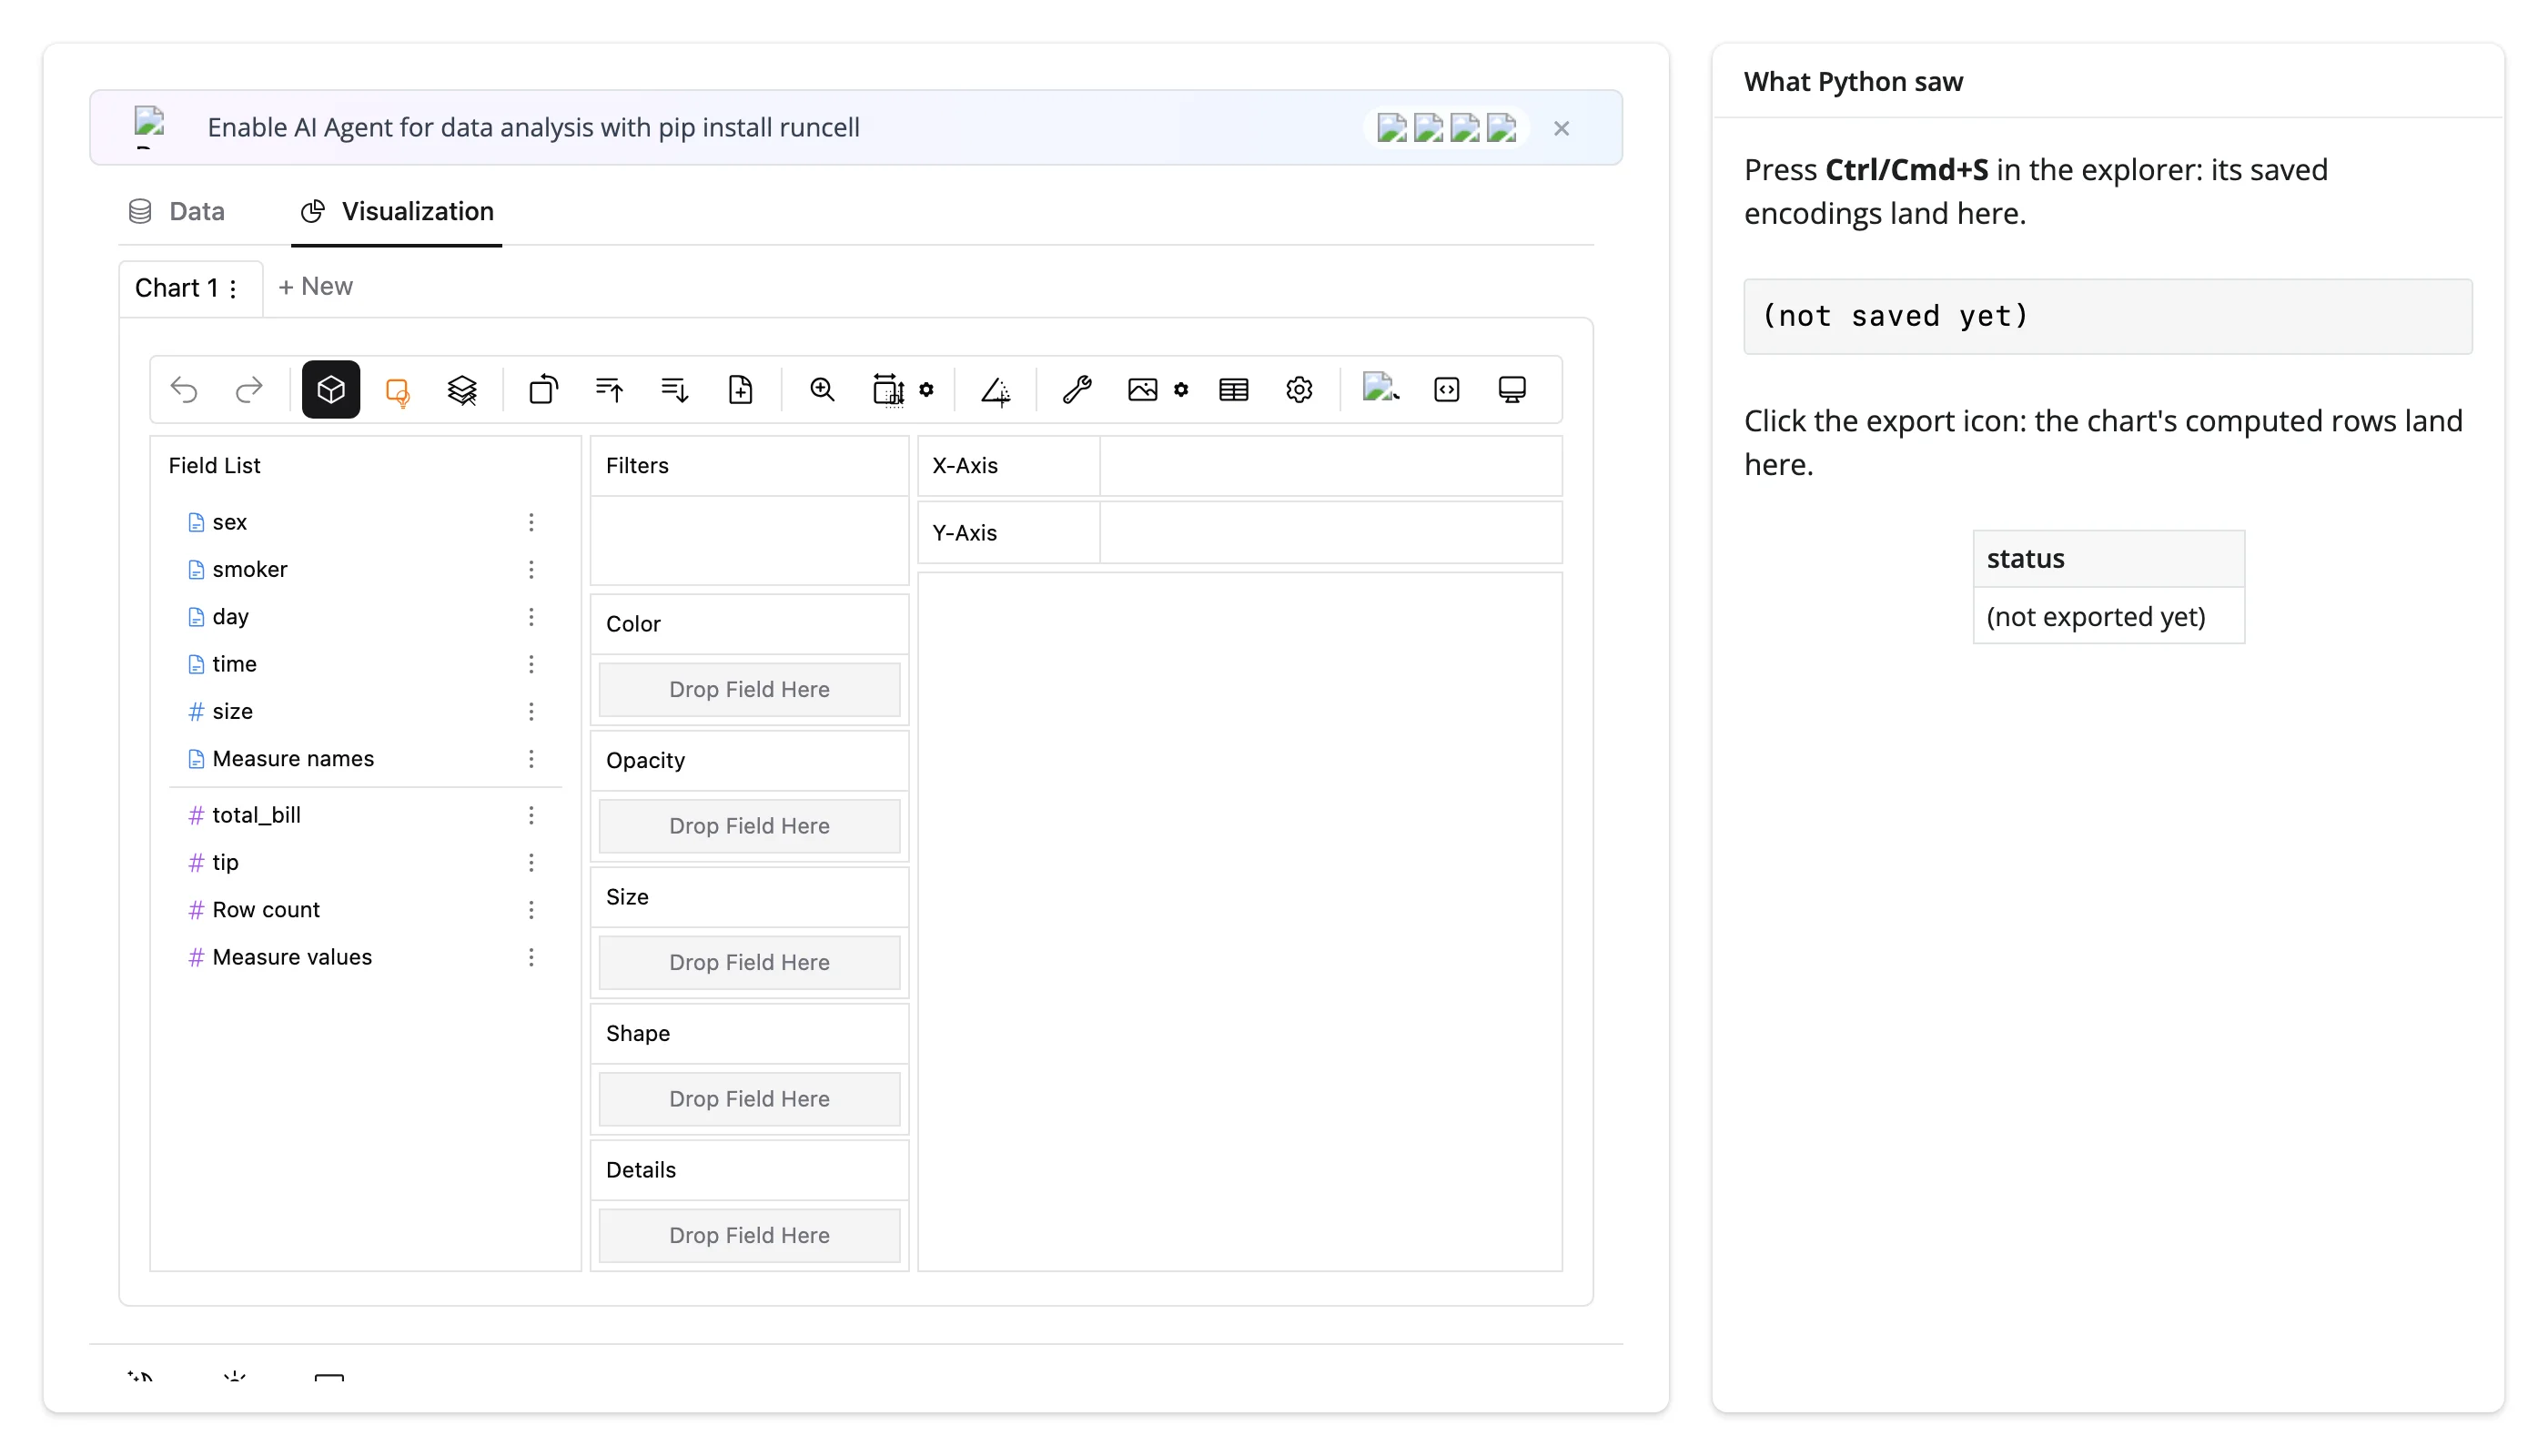
        ui.markdown("Press **Ctrl/Cmd+S** in the explorer: its saved encodings land here.")

        @render.code
        def spec_summary():
            spec = saved_spec.get()
            if spec is None:
                return "(not saved yet)"
            encodings = spec[0]["encodings"]
            used = {
                shelf: [f["name"] for f in fields]
                for shelf, fields in encodings.items()
                if fields and shelf in ("columns", "rows", "color")
            }
            return json.dumps(used, indent=2)

        ui.markdown("Click the export icon: the chart's computed rows land here.")

        @render.data_frame
        def exported_table():
            df = exported.get()
            if df is None:
                return render.DataGrid(pd.DataFrame({"status": ["(not exported yet)"]}))
            return render.DataGrid(df)
Register the on_msg handler in a separate @reactive.effect, not inside explorer()’s own body – reading .widget inside a renderer’s own render function returns the previous render’s widget (undocumented but true of every renderer; see Gotchas), so a fresh effect that reads .widget after the render completes is the reliable pattern (and matches the renderer’s own test suite).
Saving a chart (left) immediately shows its parsed shelves in Python (right); clicking export fills a real render.data_frame with the chart’s own computed rows – not the raw table, the aggregated rows behind the chart on screen:
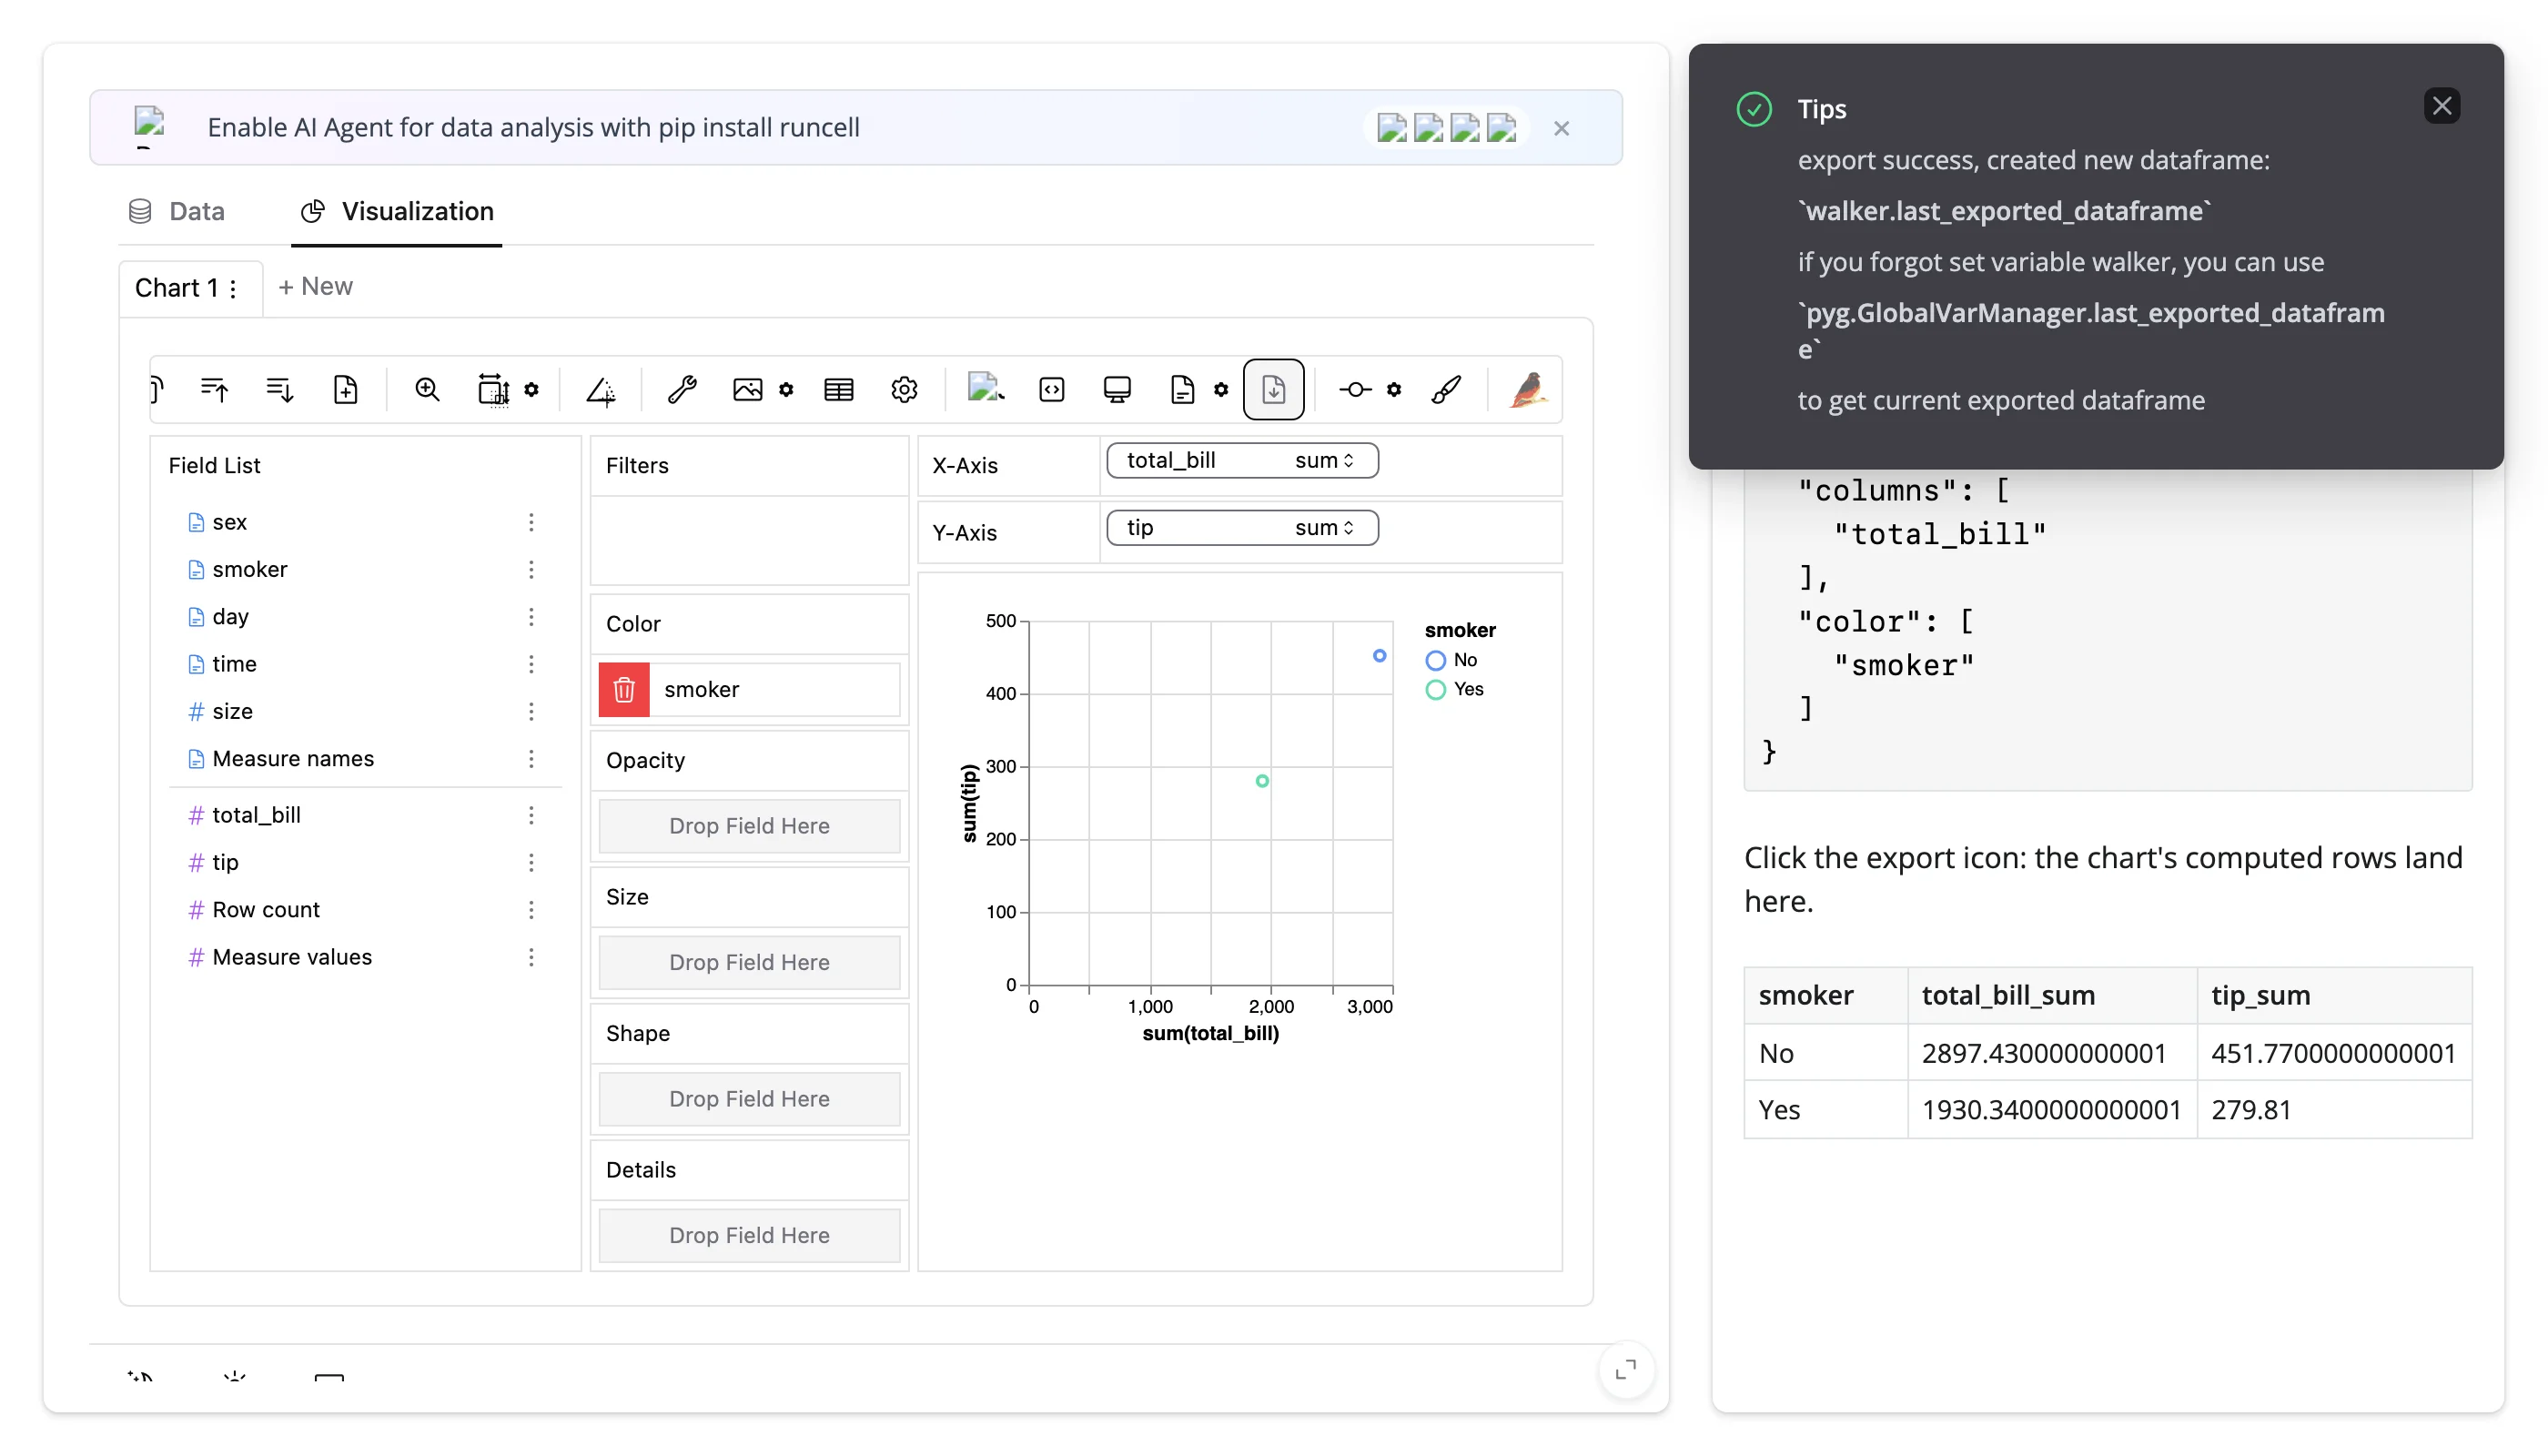
Verified: the exported table’s total_bill_sum/tip_sum values (2897.43 / 451.77 for “No”, 1930.34 / 279.81 for “Yes”) match the two points plotted in the chart on the left, confirming export sends the chart’s computed data, not a dump of the input DataFrame.
Beyond messages: nothing else to read
No subsection needed here beyond what’s above – reactive_read() has nothing to watch (verified above), and the current selection, filter, or sort inside a chart (as opposed to its saved spec) isn’t observable from Python at all, only through the save/export round trip. If you need to react continuously as a user drags fields around (not just at save/export), PyGWalker can’t do it; consider perspective instead, whose view_config()/filter() accessors update live.
Rate limiting
rate_policy/rate_delay have nothing to apply to here: there are no accessors, and reactive_read() has no state-carrying trait to rate-limit. Not applicable to this renderer.
Updating the widget from Python
PyGWalker’s widget has no synced state trait, so there’s no in-place update path (.widget.<trait> = ... does nothing useful here, unlike widgets with real synced traits). Every change means a re-render, which re-sends the ~10 MB JavaScript bundle. Keep that in mind when a render function depends on something that changes often.
The one piece of explorer state you can carry across a re-render is a saved chart spec: capture it via update_spec (above), then pass it back as walk(df, spec=...) next time. PyGWalker’s own get_spec_json accepts the raw captured visSpec list as a JSON string directly (verified: each chart object in it already carries the visId key get_spec_json checks for, so no extra wrapping is needed).
import json

import plotly.express as px
from pygwalker.api.anywidget import walk
from shiny import reactive
from shiny.express import input, ui

import globals  # noqa: F401 -- locks down DuckDB once per process; see globals.py
from shinywidgets import render_pygwalker

ui.page_opts(fillable=True)

tips = px.data.tips()
saved_spec = reactive.value(None)

ui.input_select(
    "day", "Day", choices=["All", *sorted(tips["day"].unique())], selected="All"
)
ui.markdown(
    "Build a chart, then press **Ctrl/Cmd+S**. Switching the day filter re-renders "
    "the explorer with the filtered data -- and replays the saved chart on it."
)


@render_pygwalker
def explorer():
    day = input.day()
    df = tips if day == "All" else tips[tips["day"] == day]
    with reactive.isolate():
        spec = saved_spec.get()
    return walk(df, spec=json.dumps(spec) if spec else "")


@reactive.effect
def _capture_spec():
    def on_msg(widget, content, buffers):
        if content.get("type") != "pyg_request":
            return
        if content["msg"]["action"] == "update_spec":
            saved_spec.set(content["msg"]["data"]["visSpec"])

explorer.widget.on_msg(on_msg)(reactive.isolate() keeps this render from re-running every time saved_spec itself changes – it should only react to day.) Build a chart, save it, then switch the day filter: the explorer re-renders against the filtered data, but the same chart (same shelves, same color) reopens on it, now showing smaller totals:
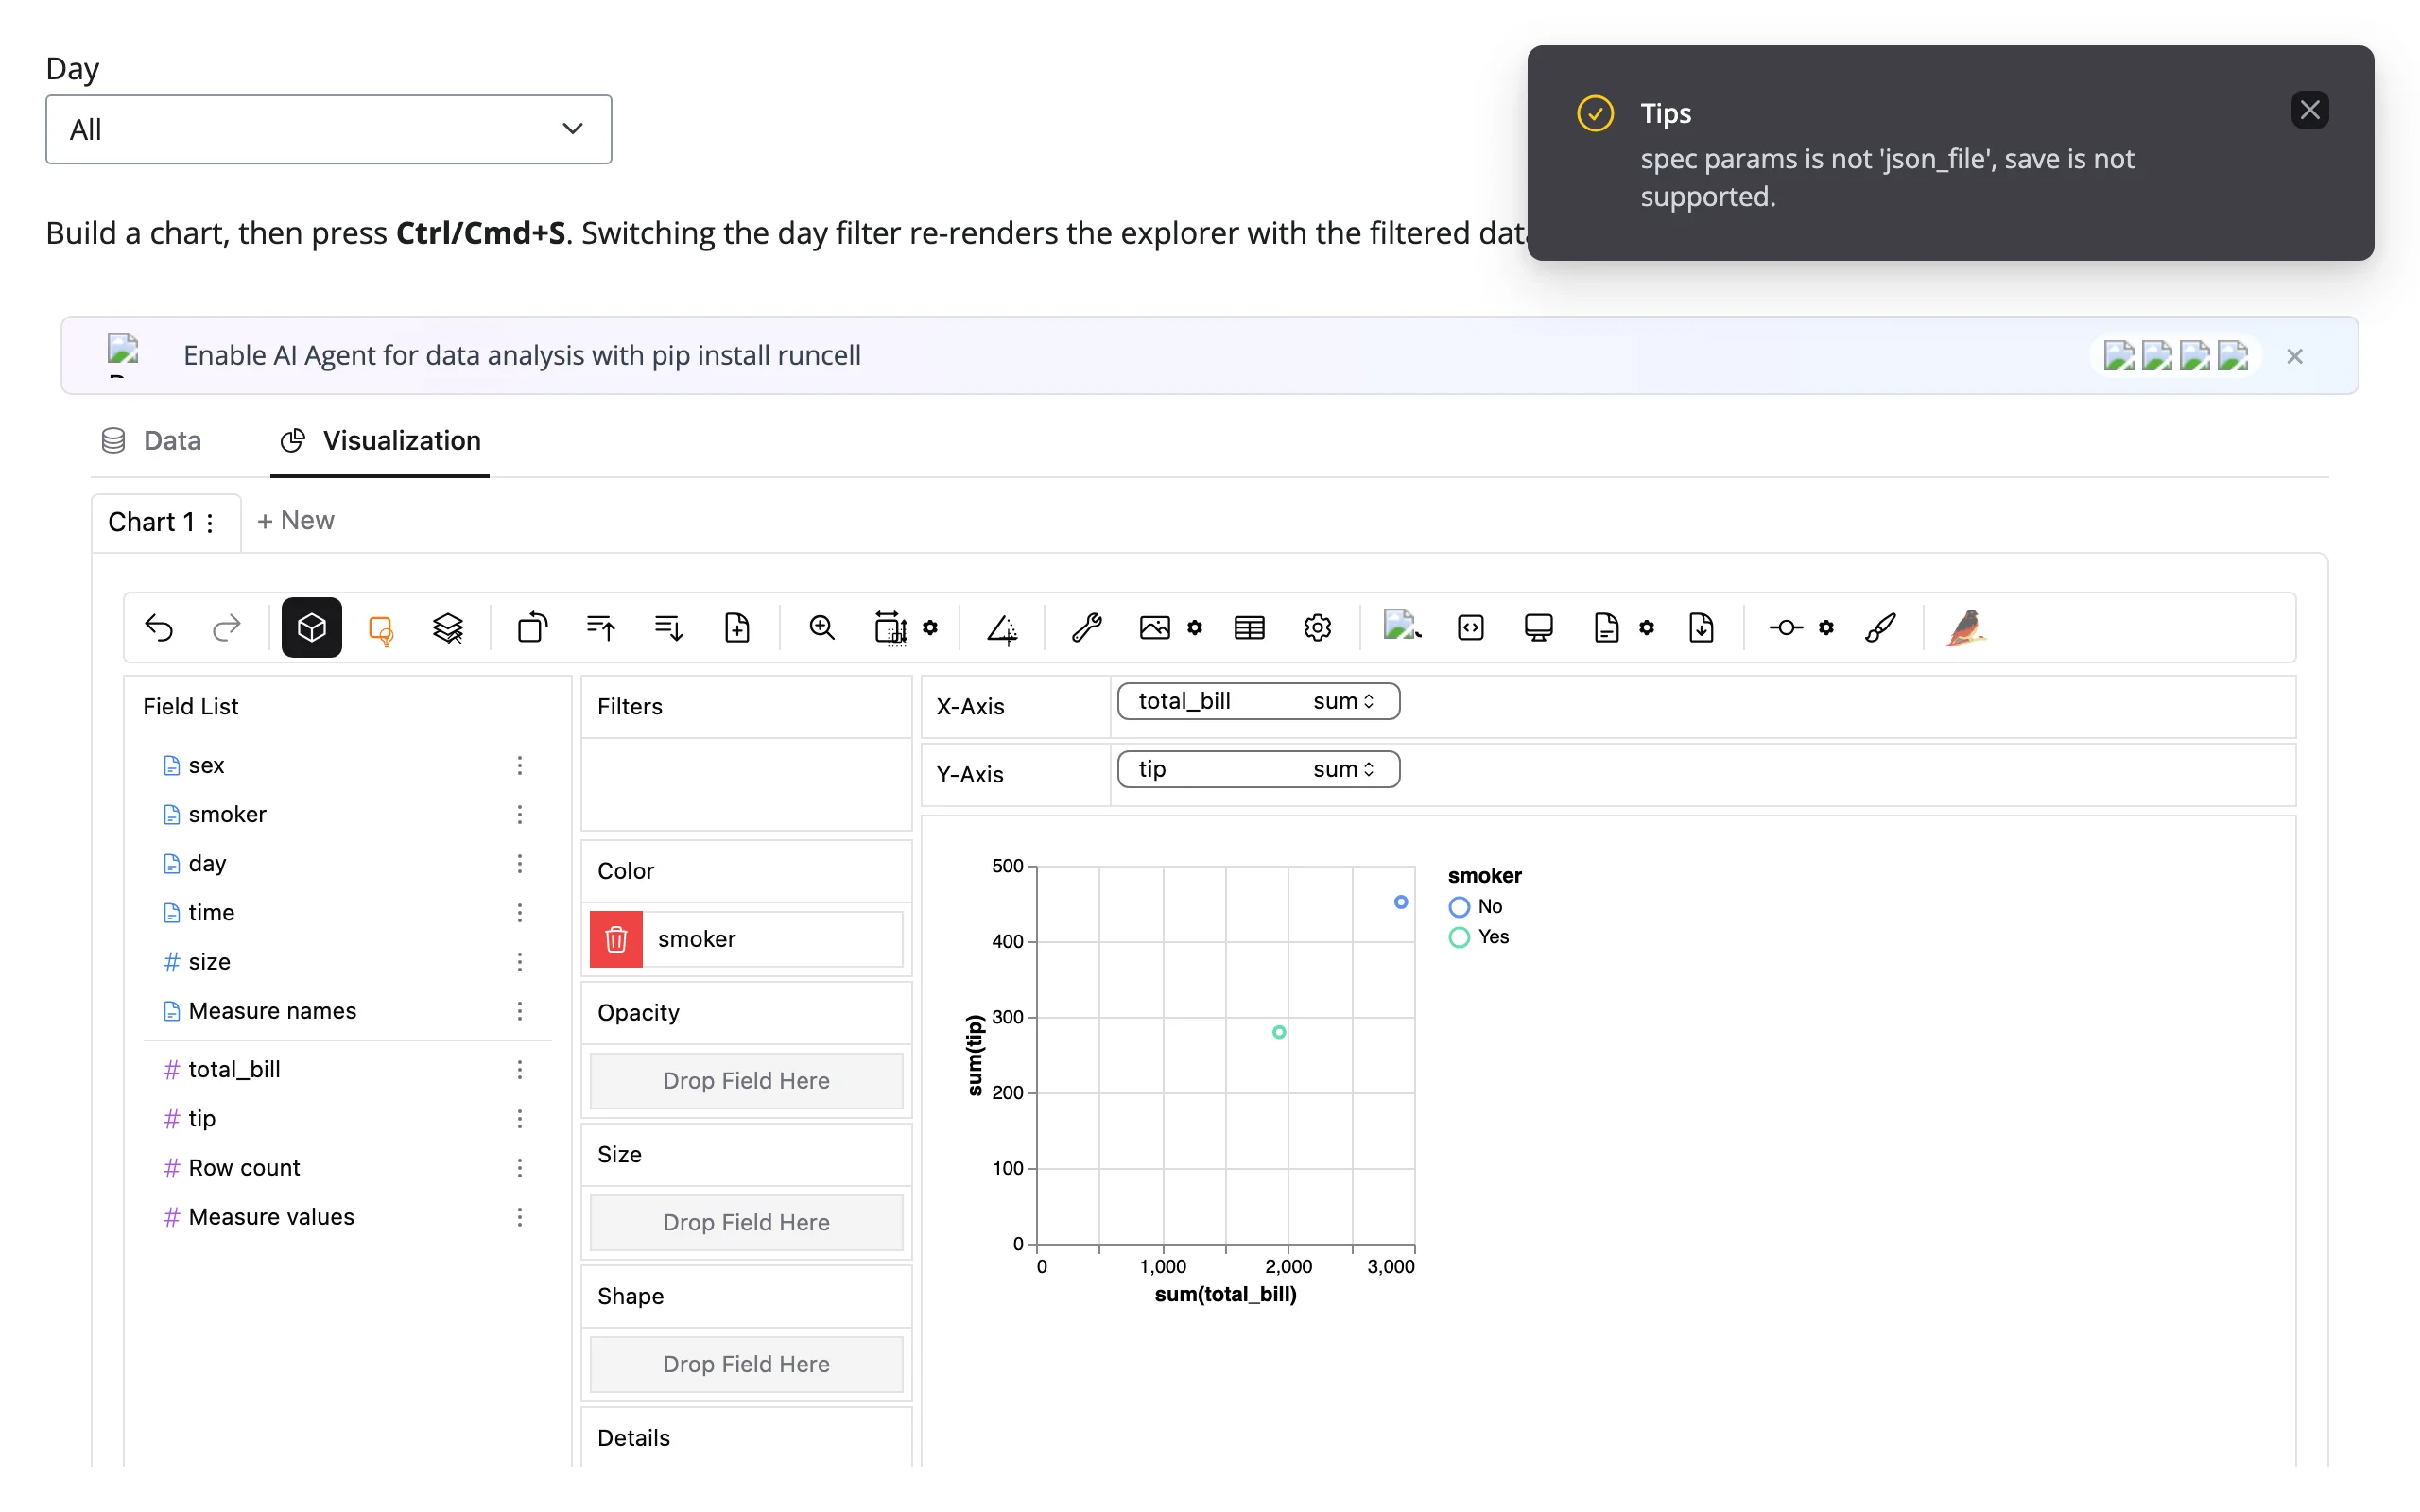
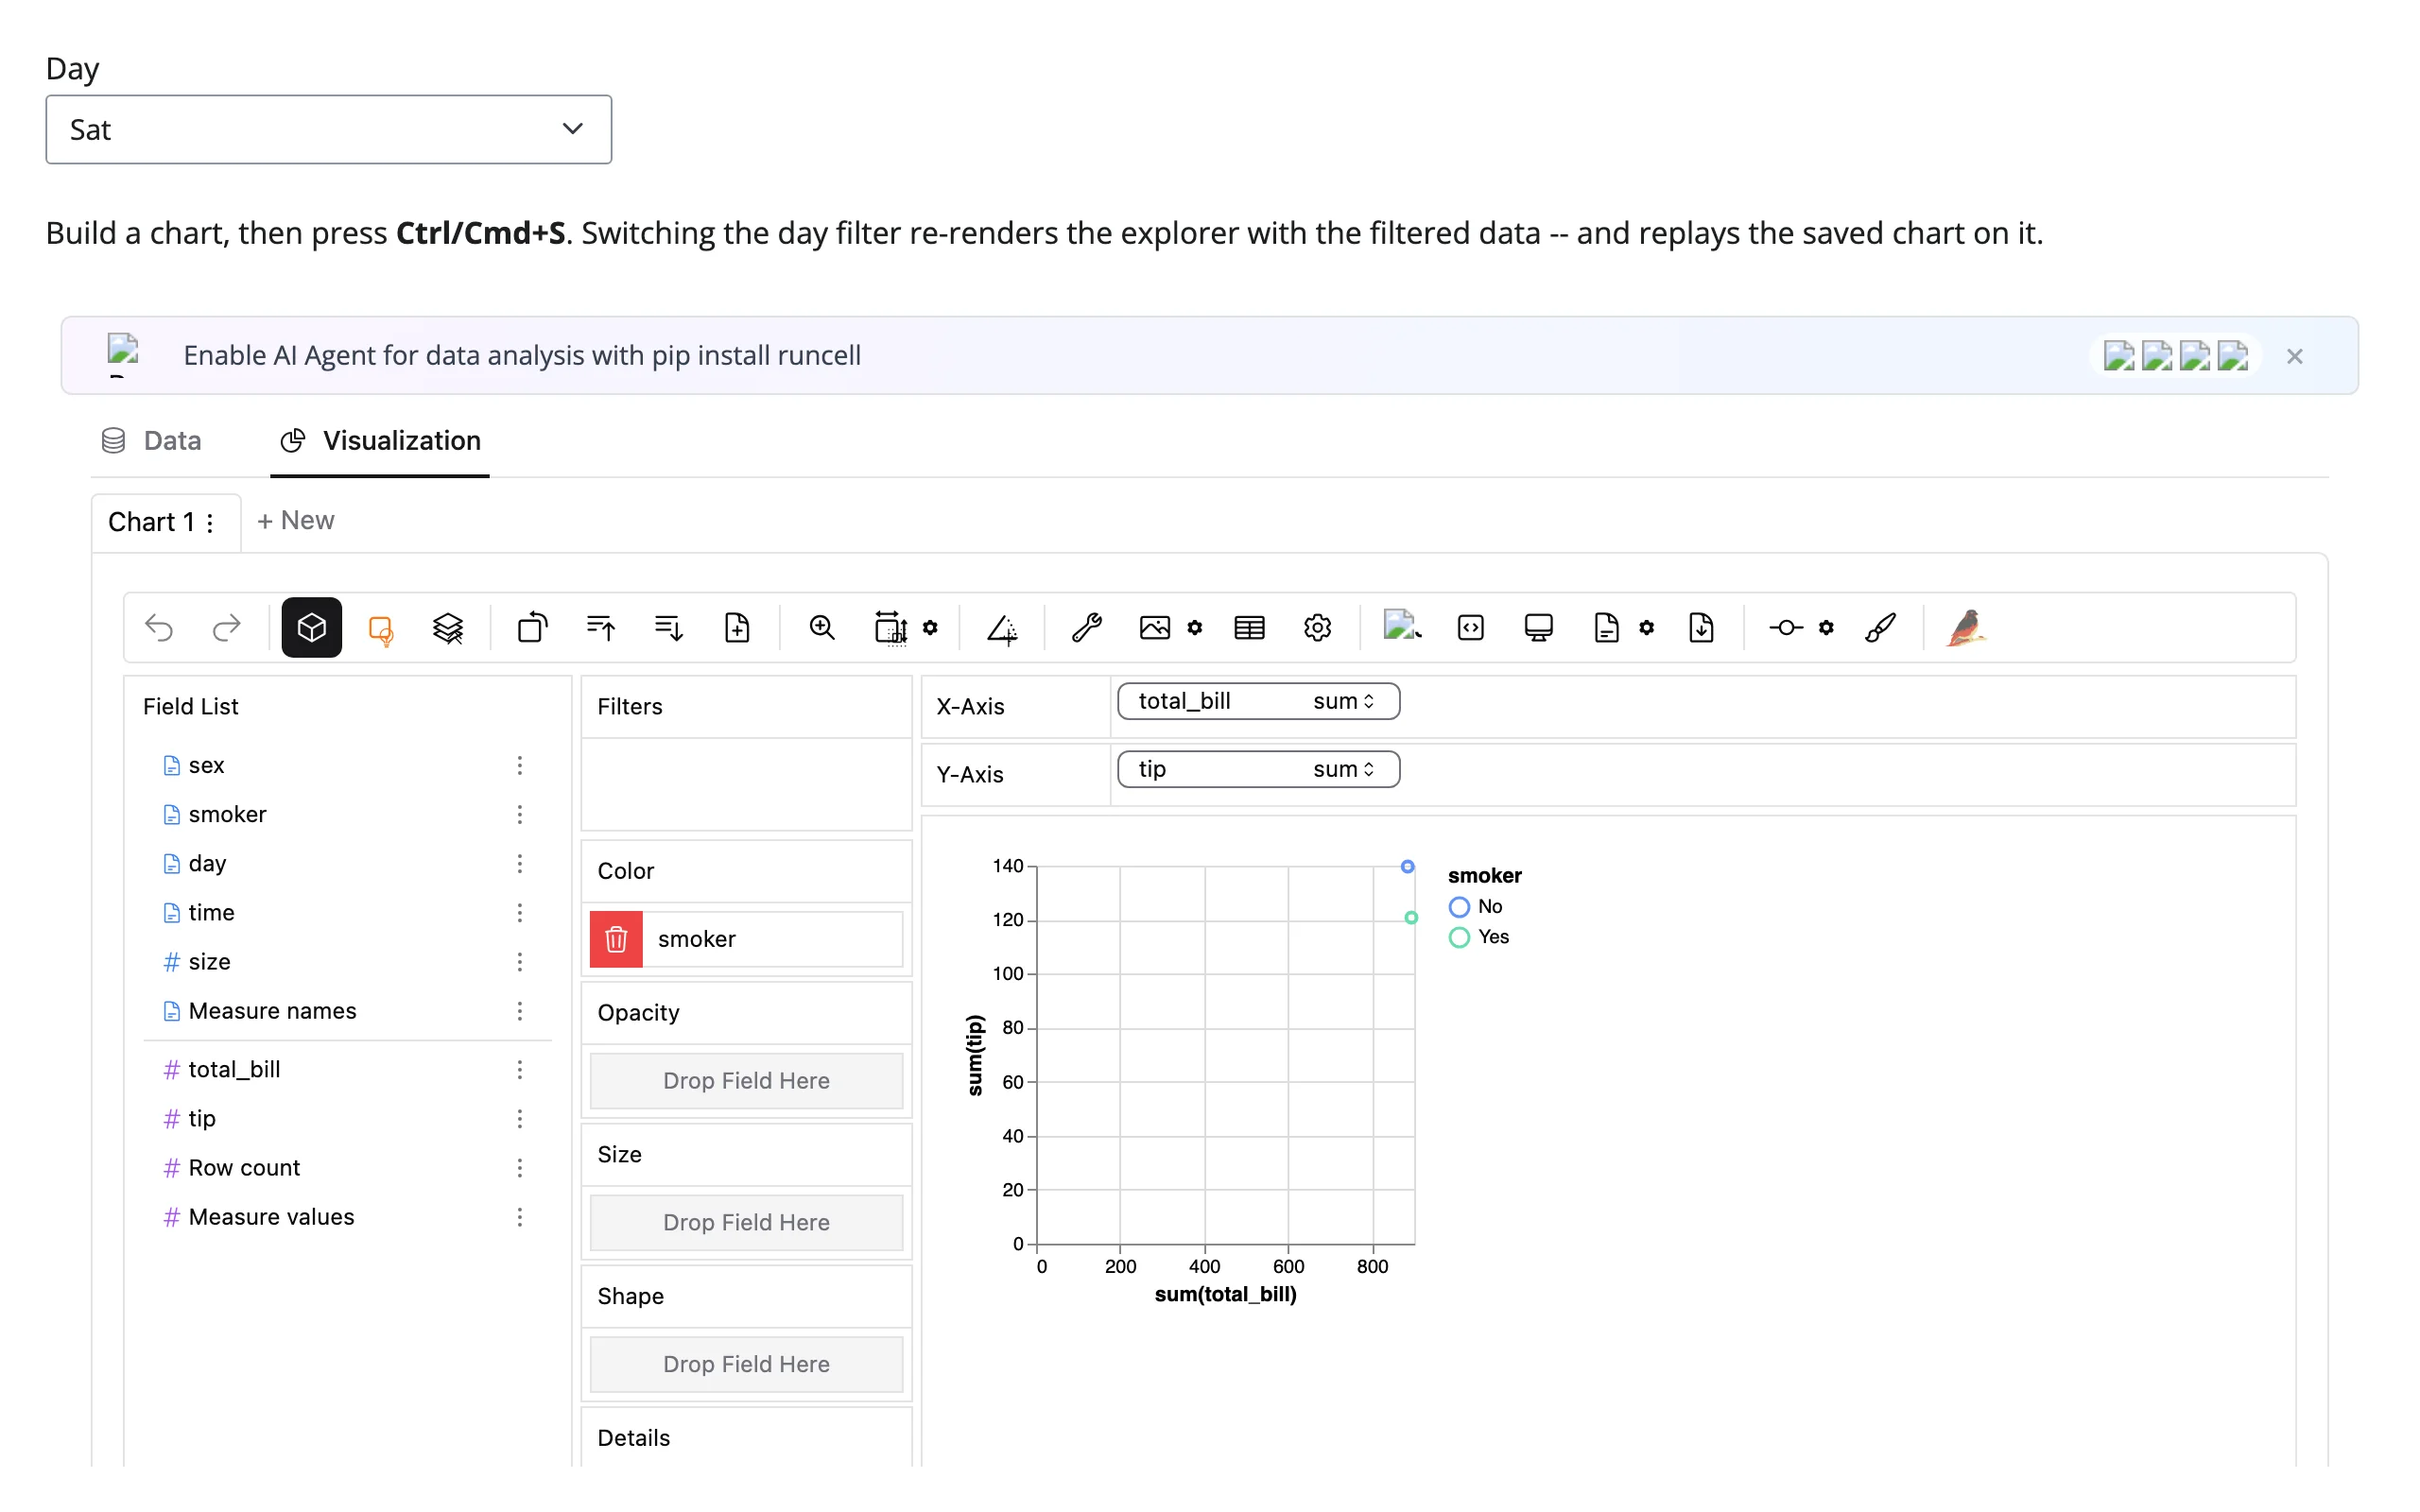
This is also the answer to “ship a pre-built exploration”: call walk(df, spec=...) with a spec captured once (e.g., written to a JSON file from a throwaway session) and every user opens on that chart, still free to change it from there.
Coordinating multiple views
PyGWalker has no live accessors to wire into other widgets, so every pattern here goes through the save/export round trip – honest, not automatic, but still useful:
Filter drives the explorer; the user’s chart survives the filter. Shown above (
05_filter_and_persist_spec.py): a Shiny input re-renders PyGWalker against different data, and a capturedupdate_speckeeps the chart itself stable across that re-render.Export drives a second widget. This captures
export_dataframe_by_sqlthe same way, then feeds the exported rows into a simple@render_plotlybar chart – “from chart to DataFrame to a second visualization”:import pandas as pd import plotly.express as px import pygwalker from shiny import reactive from shiny.express import ui import globals # noqa: F401 -- locks down DuckDB once per process; see globals.py from shinywidgets import render_plotly, render_pygwalker ui.page_opts(fillable=True) tips = px.data.tips() exported = reactive.value(None) with ui.layout_columns(col_widths=[7, 5]): with ui.card(full_screen=True): ui.card_header("Build a chart, then click the export icon") @render_pygwalker def explorer(): return tips @reactive.effect def _capture_export(): def on_msg(widget, content, buffers): if content.get("type") != "pyg_request": return if content["msg"]["action"].startswith("export_dataframe"): exported.set(pygwalker.GlobalVarManager.last_exported_dataframe) explorer.widget.on_msg(on_msg) with ui.card(full_screen=True): ui.card_header("The same computed rows, as a plotly bar chart") @render_plotly def bar(): df = exported.get() if df is None: return px.bar(title="Export a chart to see it here") num_col = next(c for c in df.columns if pd.api.types.is_numeric_dtype(df[c])) cat_col = next(c for c in df.columns if c != num_col) return px.bar(df, x=cat_col, y=num_col, title=f"{num_col} by {cat_col}")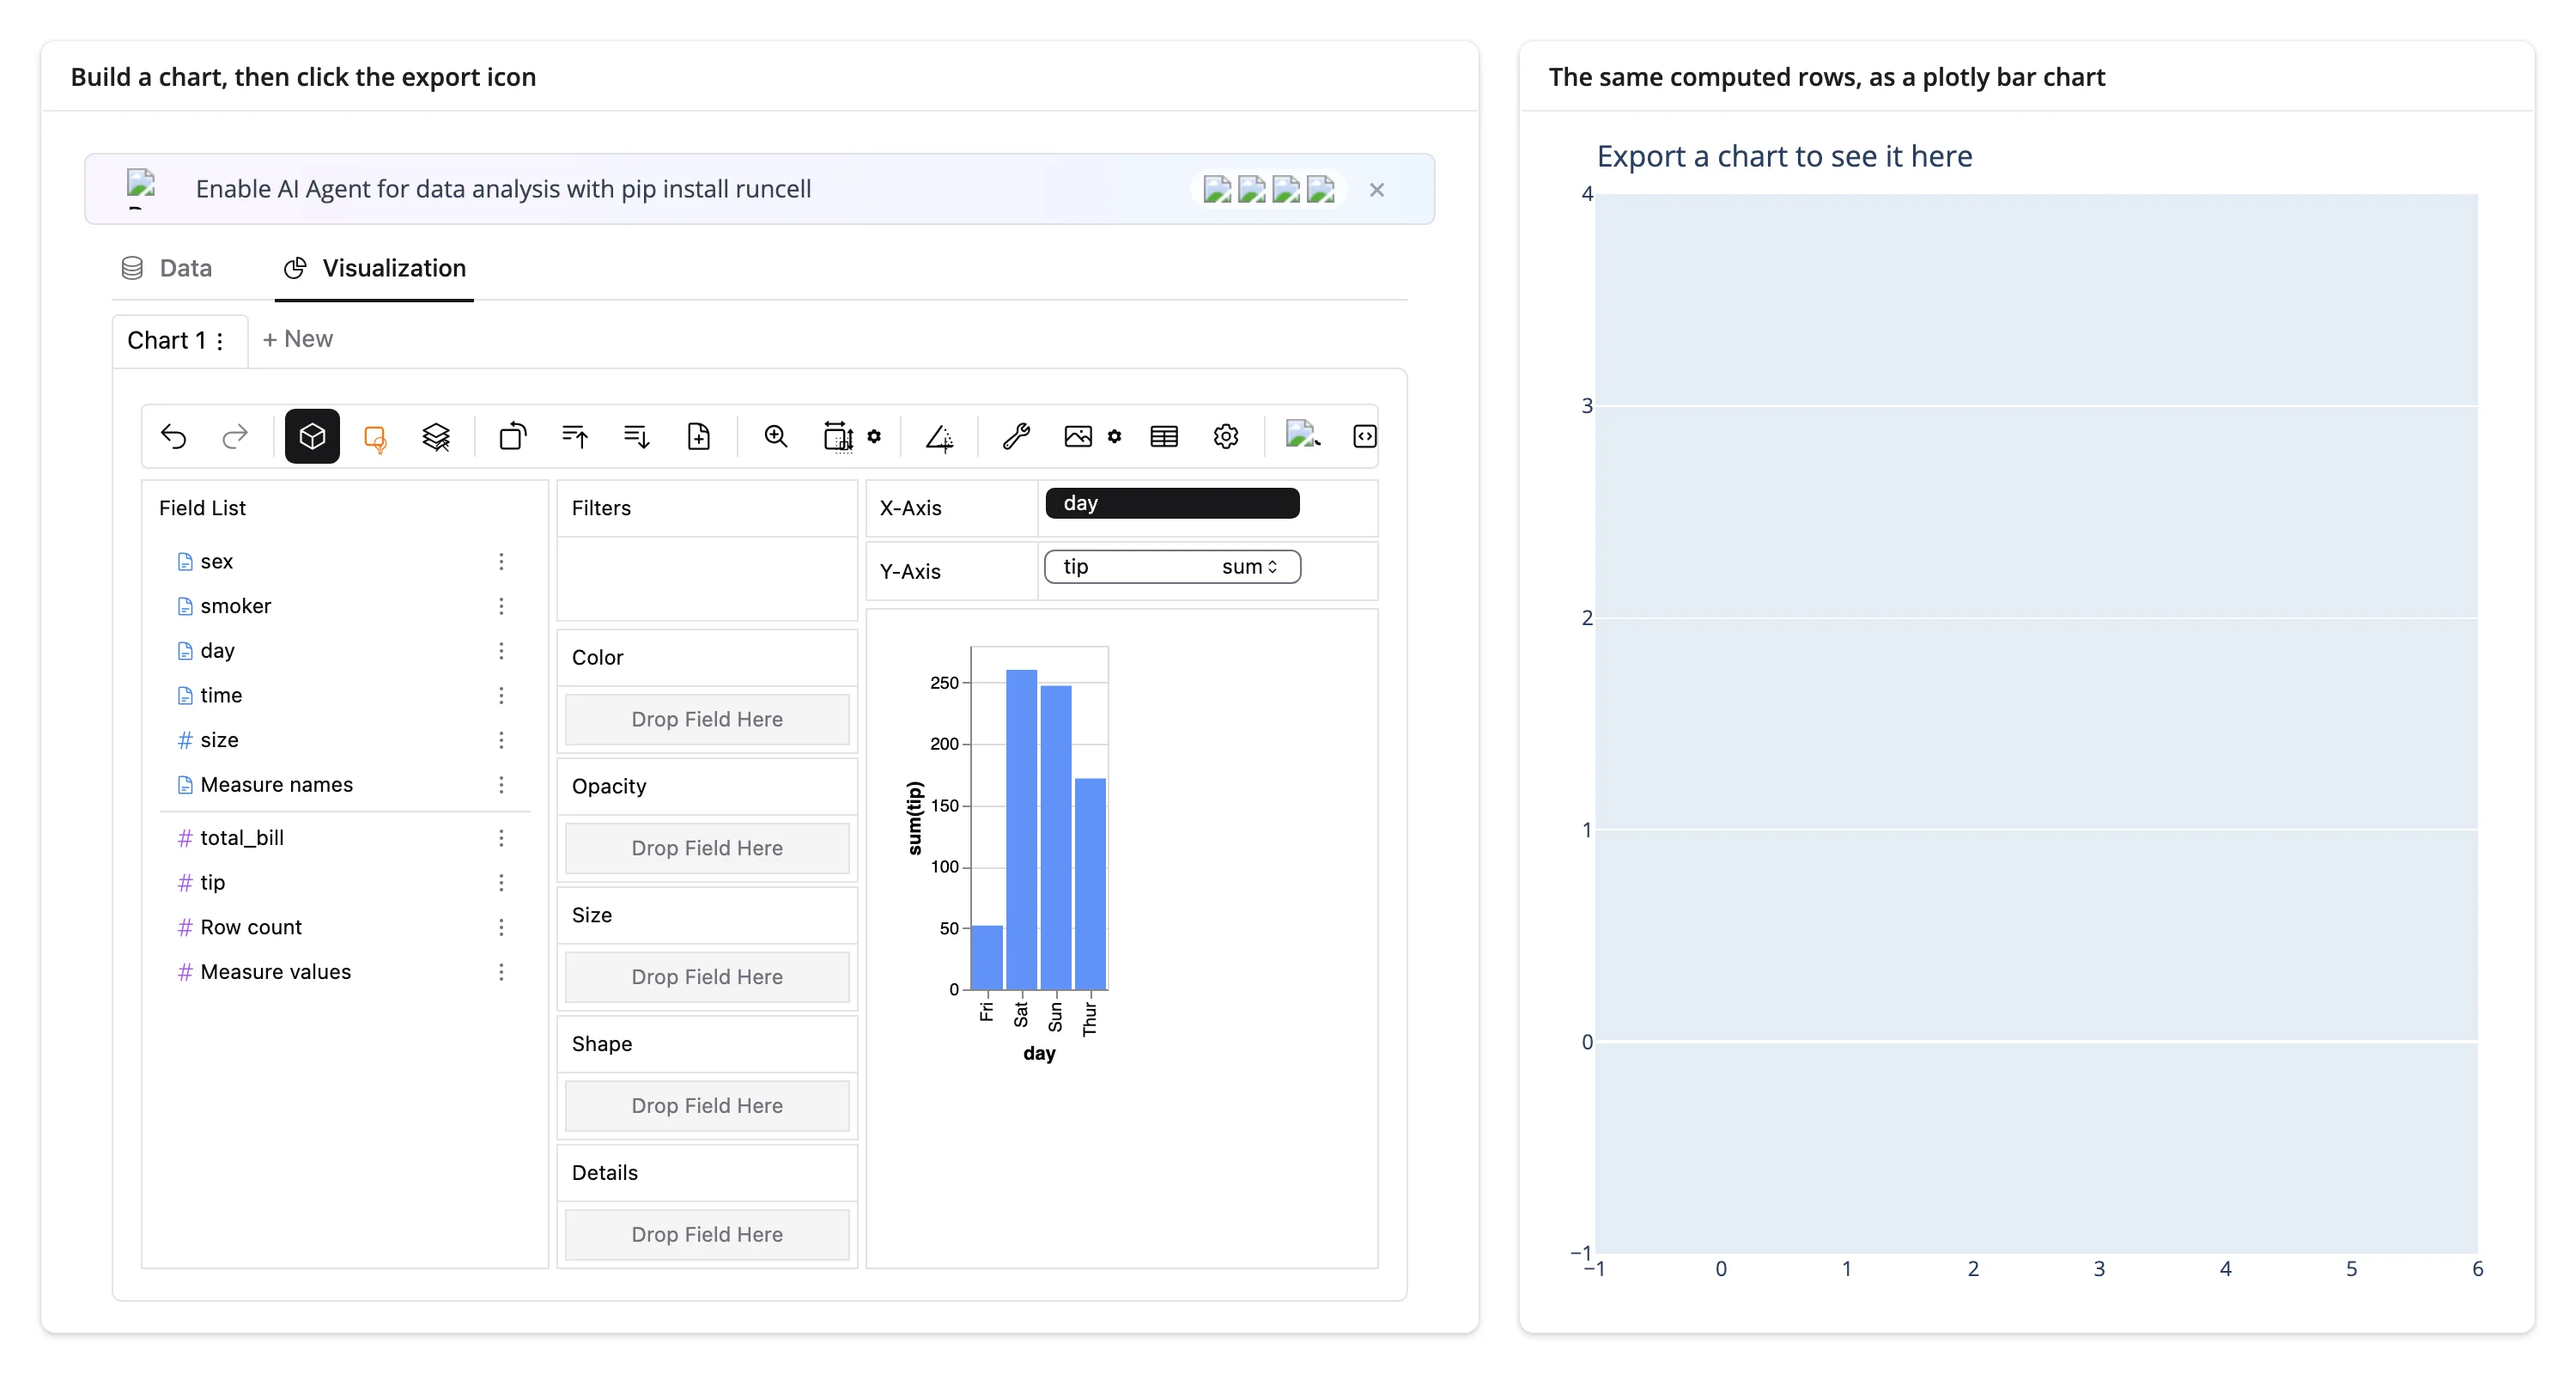
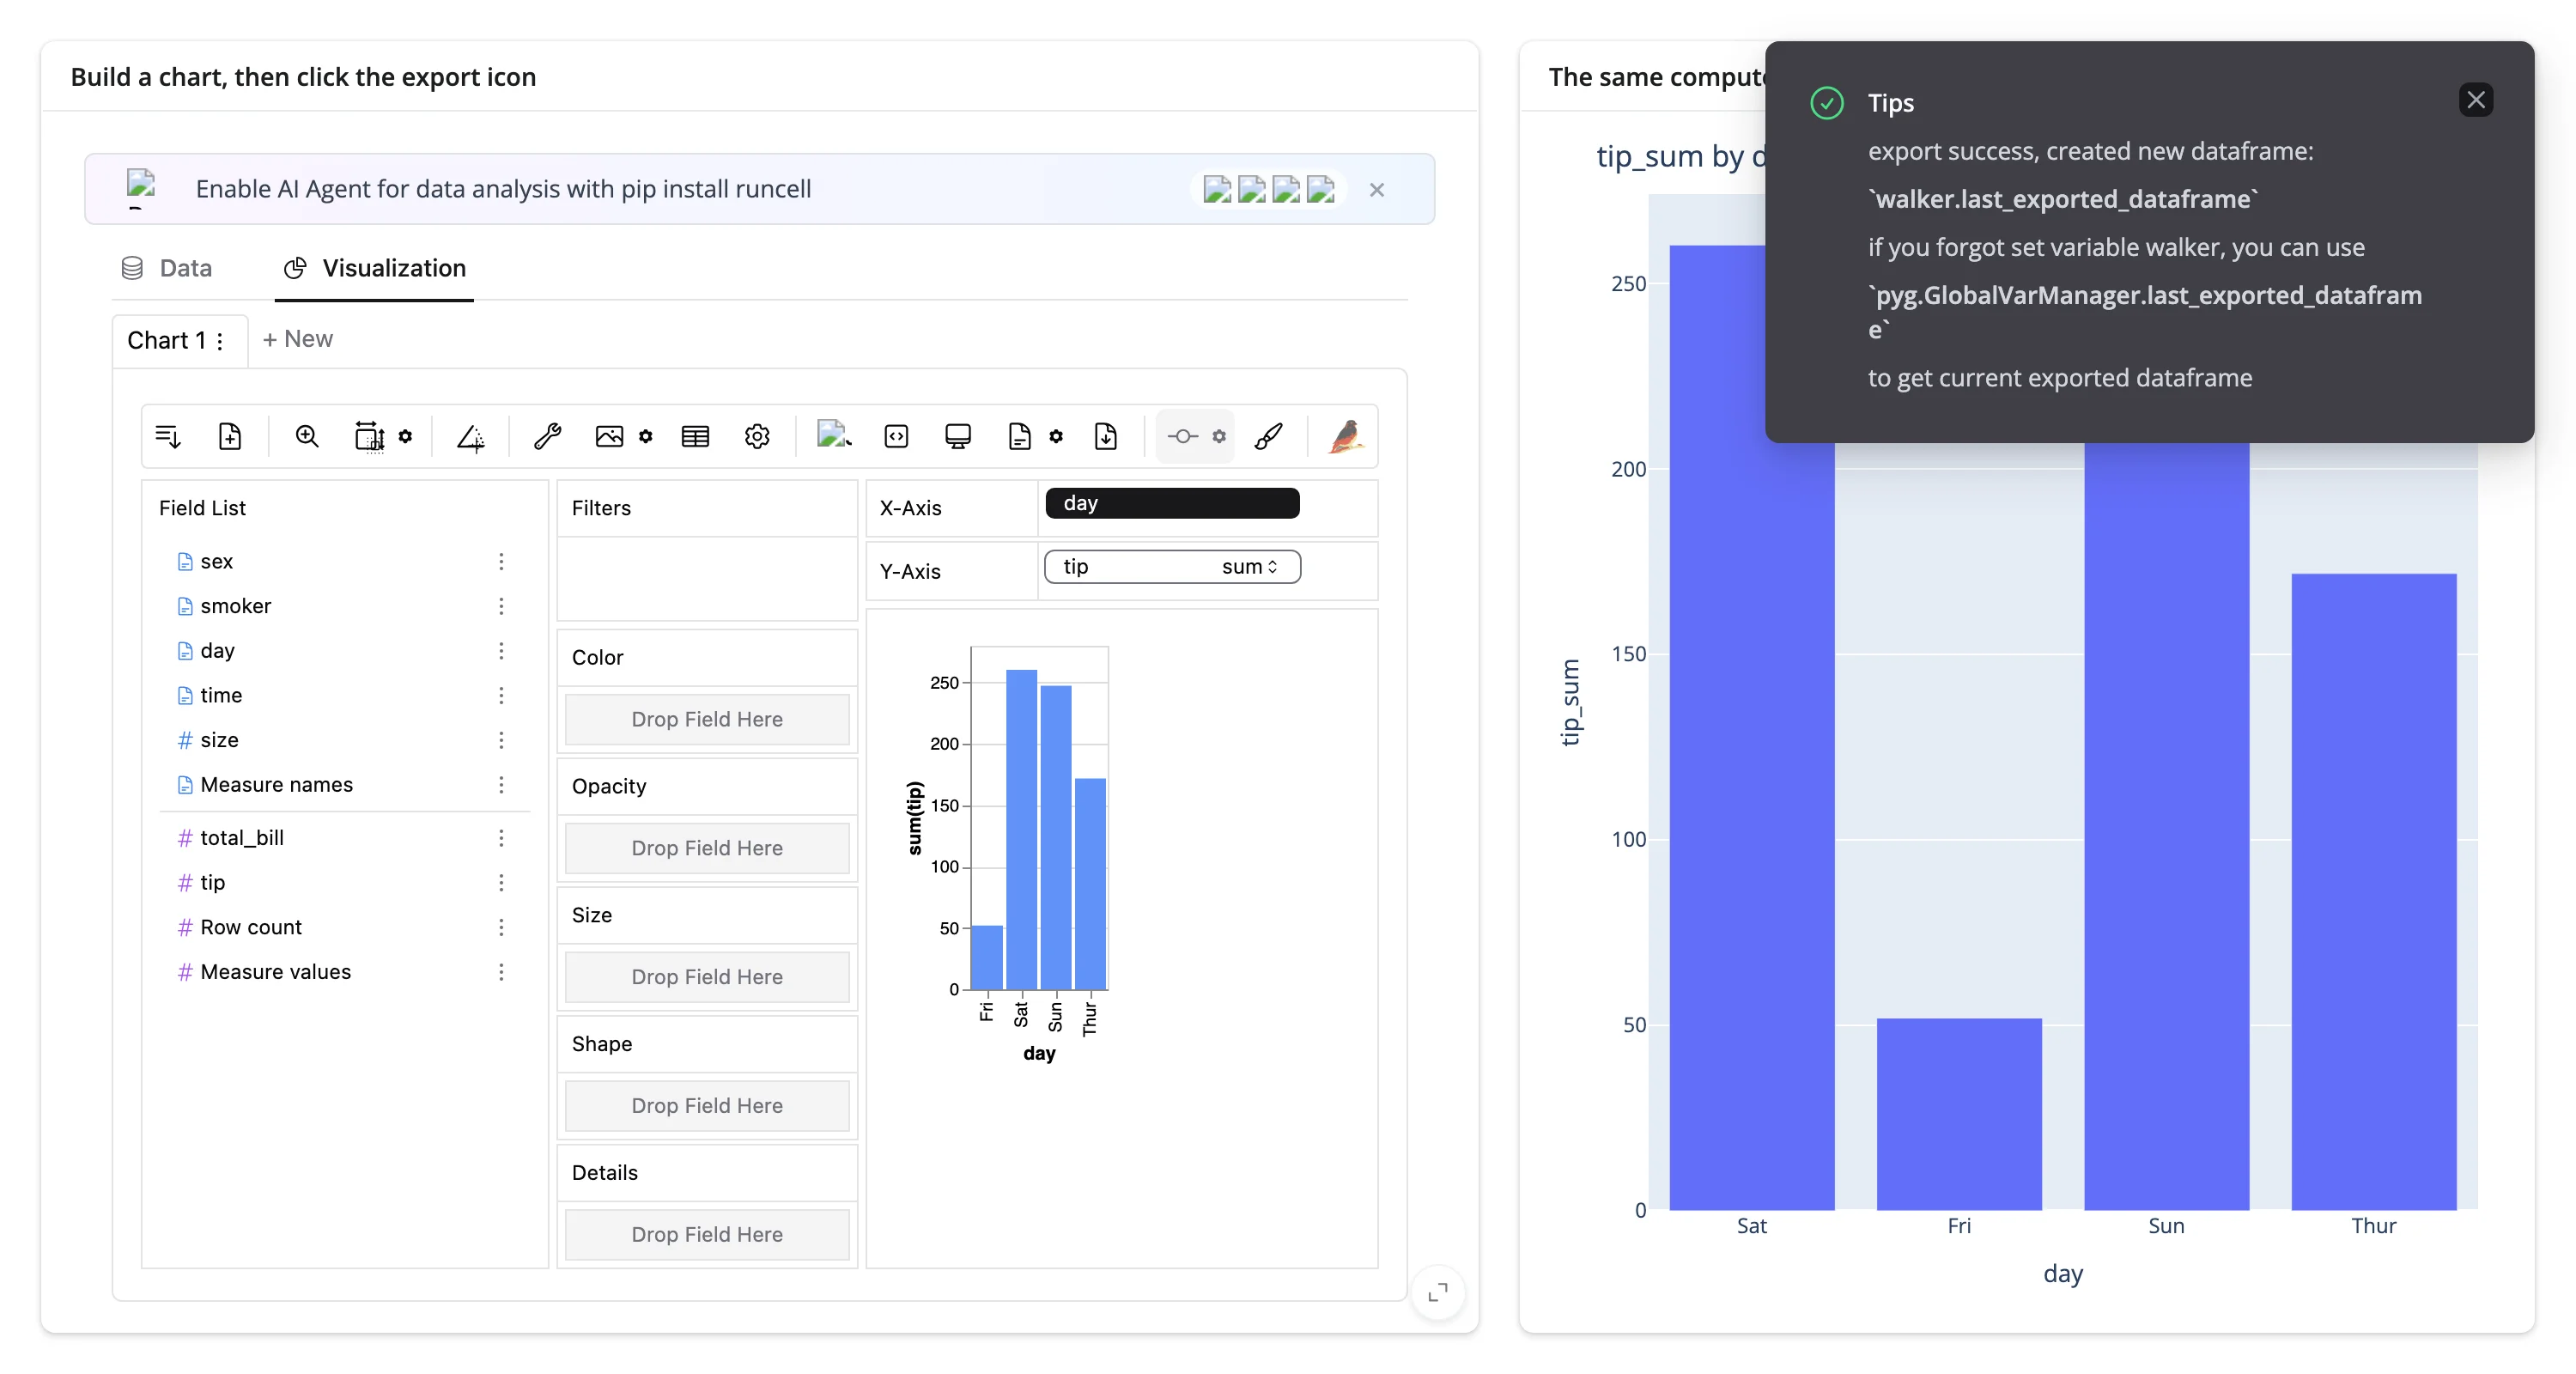
Verified:
tip_sum by dayin the plotly chart (Sat ~260, Fri ~50, Sun ~250, Thur ~170) matches the PyGWalker chart it was exported from.Save a spec, show it as a shareable artifact. Not demonstrated as a separate example (it’s a one-line variant of pattern 1): write the captured
visSpecto a file or database row from yourupdate_spechandler, and you have a durable “this user’s saved view” you can reopen for them next session, email as a link, or audit.
What you can’t do: react to a selection or lasso the way accessor-based renderers do (plotly’s selected(), perspective’s filter()). PyGWalker’s only observable moments are save and export.
Large data
See Any size dataset, because DuckDB computes it above – PyGWalker’s whole large-data story is that DuckDB runs the query in your Python process, so only the aggregated result crosses the wire. Measured directly, comparing 500/50,000/1,000,000-row versions of the same app: the initial render (ESM bundle + schema, no data) is byte-for-byte identical at every size (10,163,162 bytes), and building one aggregated chart costs about 1.2 KB sent / 2.0 KB received regardless of row count. This is the “summarize on the server” approach from Large data & performance.
Layout and sizing
In a filling layout (fillable=True, or a full_screen=True card), the explorer fills its container – PyGWalker’s own UI is tall (~750-800px) and scrolls internally if the container is shorter. Outside a filling layout, the default height is a plain ipywidget default (400px), which is almost always too short; give it an explicit height (@render_pygwalker(height="420px") or output_widget("id", height="420px") in Core) sized to fit, and expect it to scroll:
import plotly.express as px
from shiny.express import ui

import globals  # noqa: F401 -- locks down DuckDB once per process; see globals.py
from shinywidgets import render_pygwalker

ui.page_opts(fillable=True)
tips = px.data.tips()

with ui.layout_columns(col_widths=[6, 6]):
    with ui.card(full_screen=True):
        ui.card_header("Fills the card (full_screen enabled)")

        @render_pygwalker
        def fill_explorer():
            return tips

    with ui.card():
        ui.card_header('Explicit height="420px" (scrolls inside)')

        @render_pygwalker(height="420px")
        def fixed_explorer():
            return tips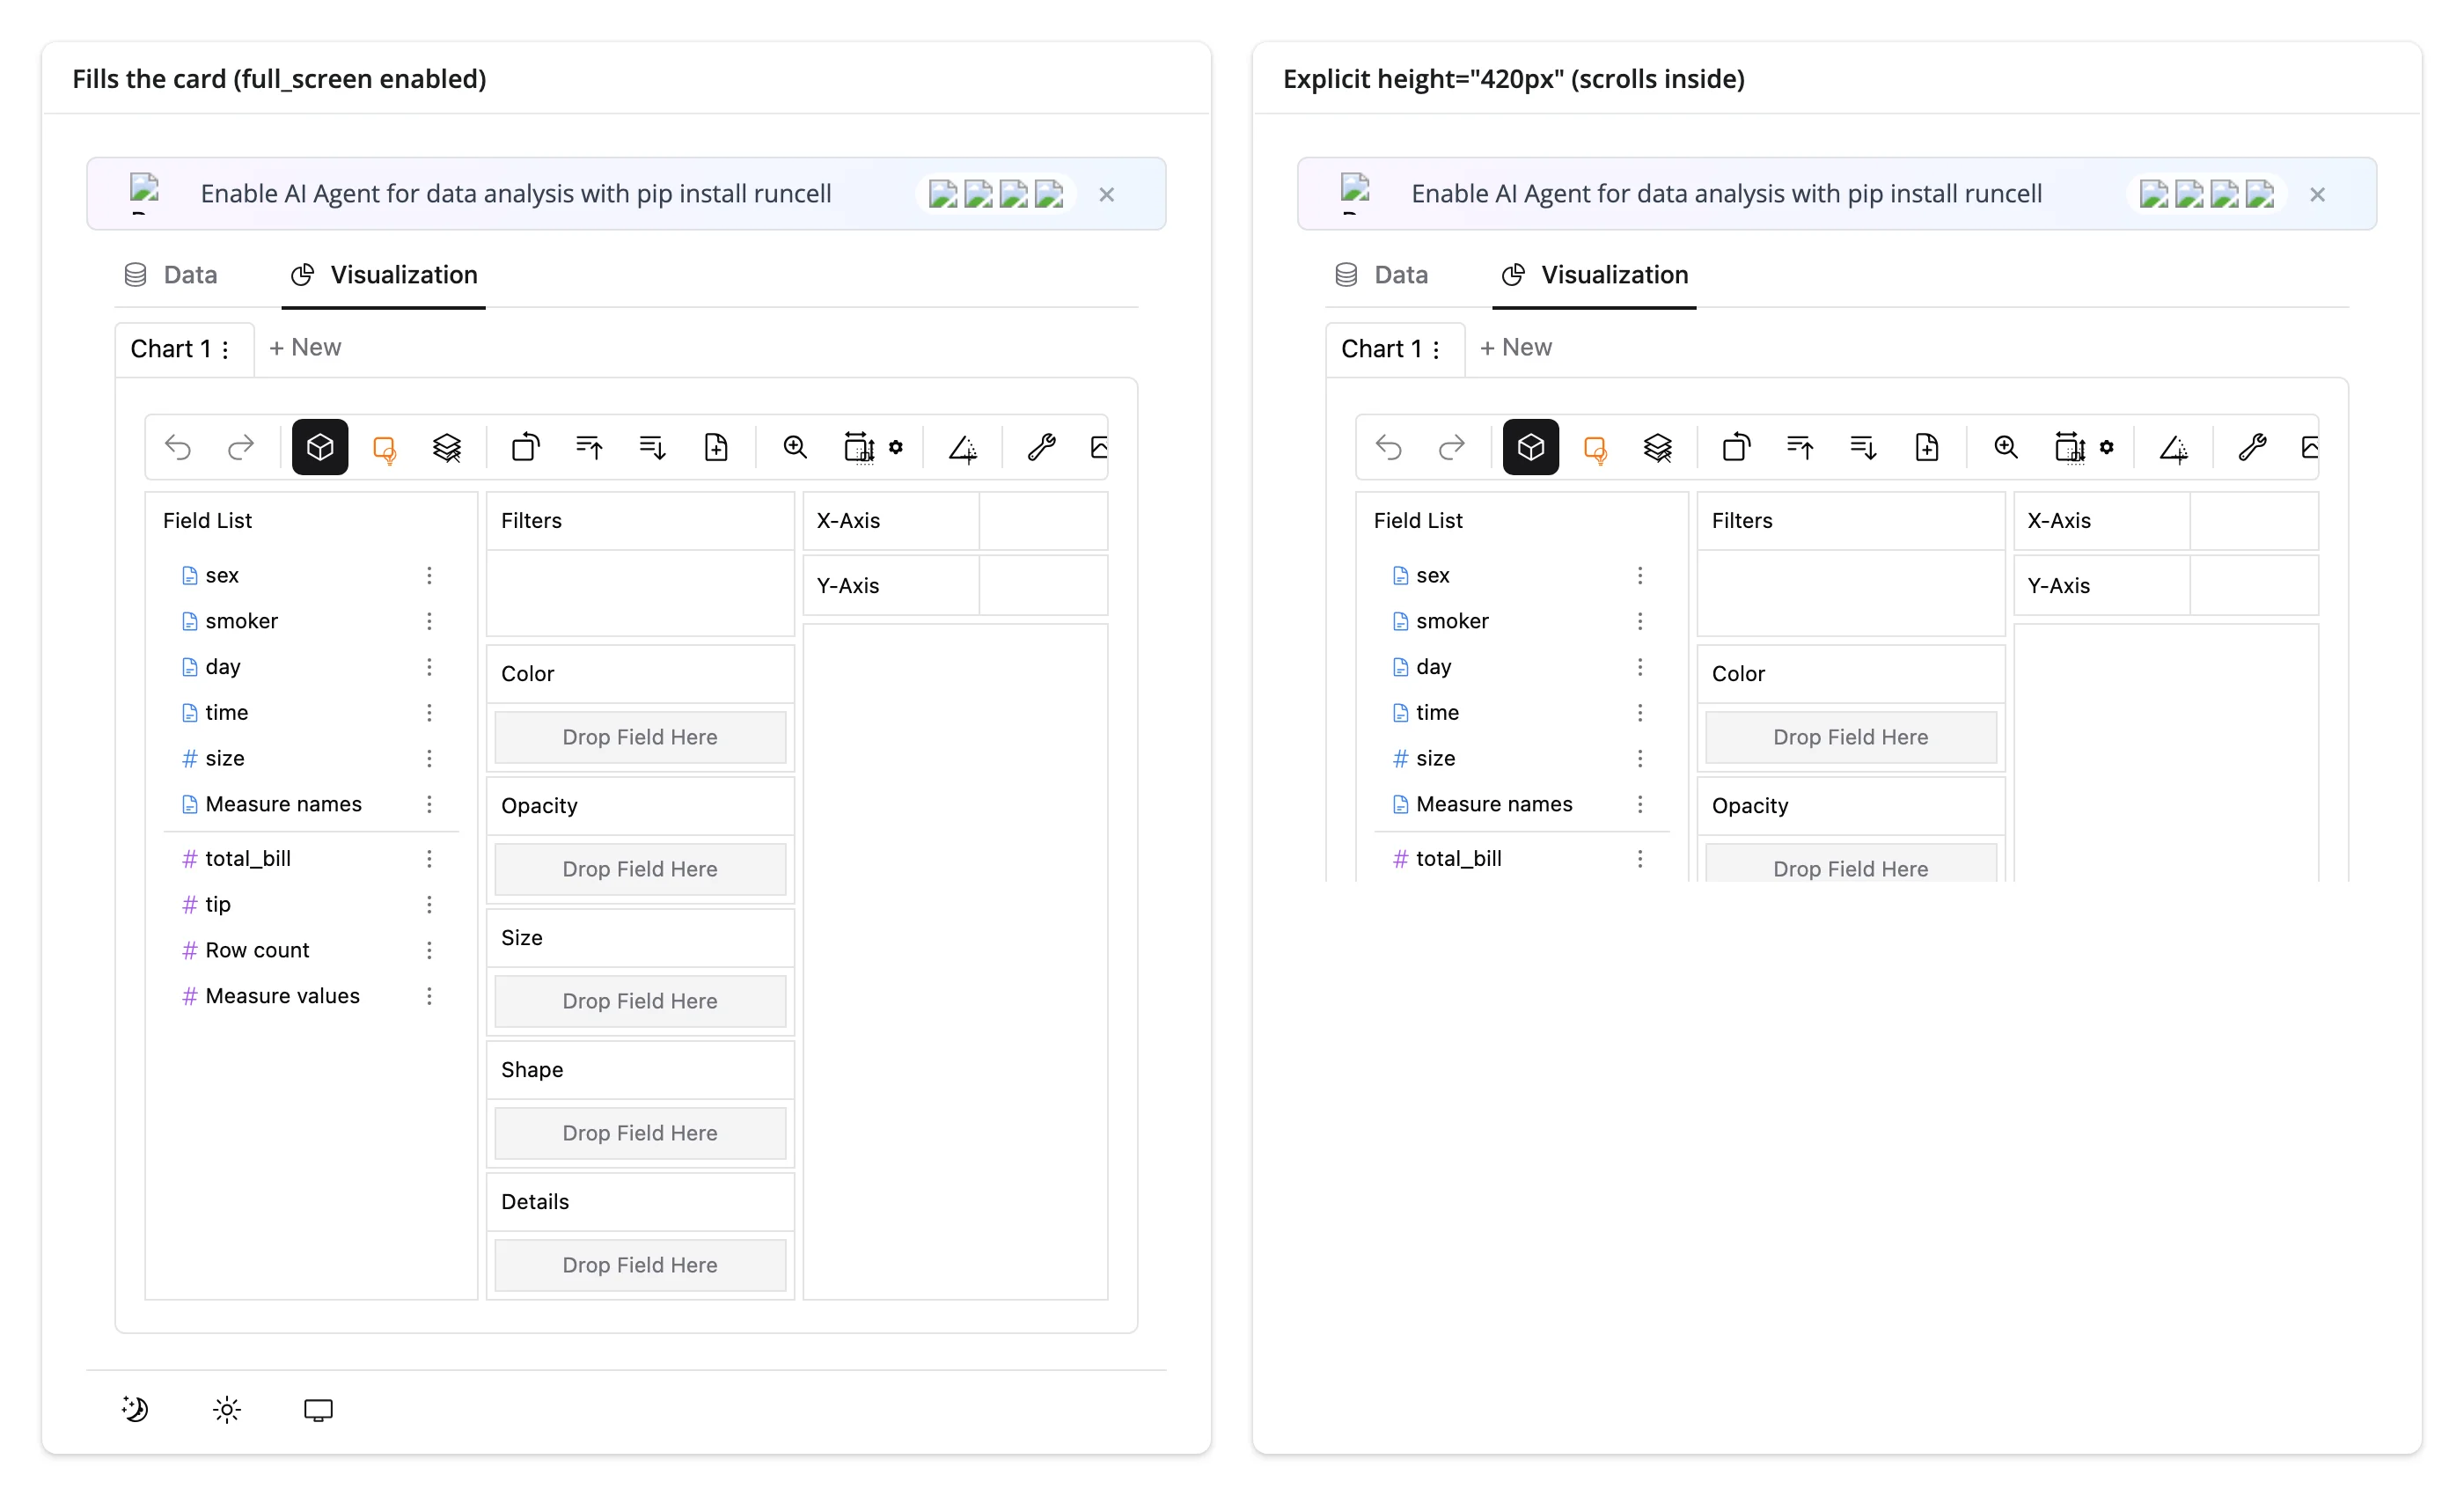
Both are confirmed by the existing Playwright suite (tests/playwright/render_pygwalker), which checks the fill-card height matches exactly and the explicit-height case has scrollHeight > clientHeight.
Gotchas and limitations
globals.pyin Shiny Express is not guaranteed to run exactly once per process – confirmed directly: a plainshiny runon an Express app executes the whole app file (and any siblingglobals.pyit imports) twice before a single browser even connects, and once more per session after that. For most setup code (like theshared_lifetime()widgets in the reacting-to-widgets article) this is harmless, just wasteful – rebuilding aMap()twice doesn’t error. For DuckDB’s lockdown it does error, becauseSET lock_configuration = truecan only succeed once per connection; a second attempt raisesInvalid Input Error: Cannot change configuration option ... - the configuration has been locked. That’s why this guide’sglobals.pycheckscurrent_setting('lock_configuration')before setting anything – make any one-shot, non-idempotent setup code like this tolerate being run more than once, rather than relying onglobals.py’s filename alone. Shiny Core doesn’t have this problem (module-level code outsideserver()really does run once).- PyGWalker’s “AI Agent” ad banner (“Enable AI Agent for data analysis with pip install runcell”) shows regardless of
set_privacy("offline")– visible in every screenshot in this guide. It’s dismissible per page load but reappears on the next render. Not something shinywidgets can suppress; it’s baked into the shipped bundle. - The save and export toasts are written for Jupyter, not Shiny, and are a little confusing: saving shows “spec params is not ‘json_file’, save is not supported” even though the spec did reach Python (the
update_specmessage fires regardless); exporting tells you to readwalker.last_exported_dataframe– that variable doesn’t exist in a Shiny app, usepygwalker.GlobalVarManager.last_exported_dataframeinstead (as this guide’s examples do). Both toasts are harmless to ignore. - The visualization tab’s “Filters” shelf also displays every dimension used elsewhere in the chart (with a trash icon), as a shortcut to add a filter condition or remove the field entirely. It’s easy to mistake for an active filter; verified by reading the saved spec back (
"filters": []even while, e.g., a Color field shows there too). - A polars DataFrame only works if the installed
pygwalkersupports polars >= 1.0’s dtype API; every release up to and including 0.5.0.1 doesn’t, andrender_pygwalkerraises a clearTypeErrortelling you to passdf.to_pandas()instead (checked at render time viapolars_supported()). - Never use the top-level
pygwalker.walk()(orimport pygwalker as pyg; pyg.walk(df)) inside a Shiny render function. Outside Jupyter it starts a blocking HTTP server instead of returning a widget; usepygwalker.api.anywidget.walk()(what this renderer uses internally, and what you should call directly when you needspec=,theme_key=, etc.). - Reading
.widgetinside a renderer’s own render function returns the previous render’s widget, with no error (true of everyrender_*output, not specific to PyGWalker). Registeron_msghandlers in a separate@reactive.effect, as this guide’s examples do.
Gallery candidates
gallery/template_explorer.py: a minimal, self-contained starting point (lockdown + two Shiny-input filters + explorer), ~50 lines.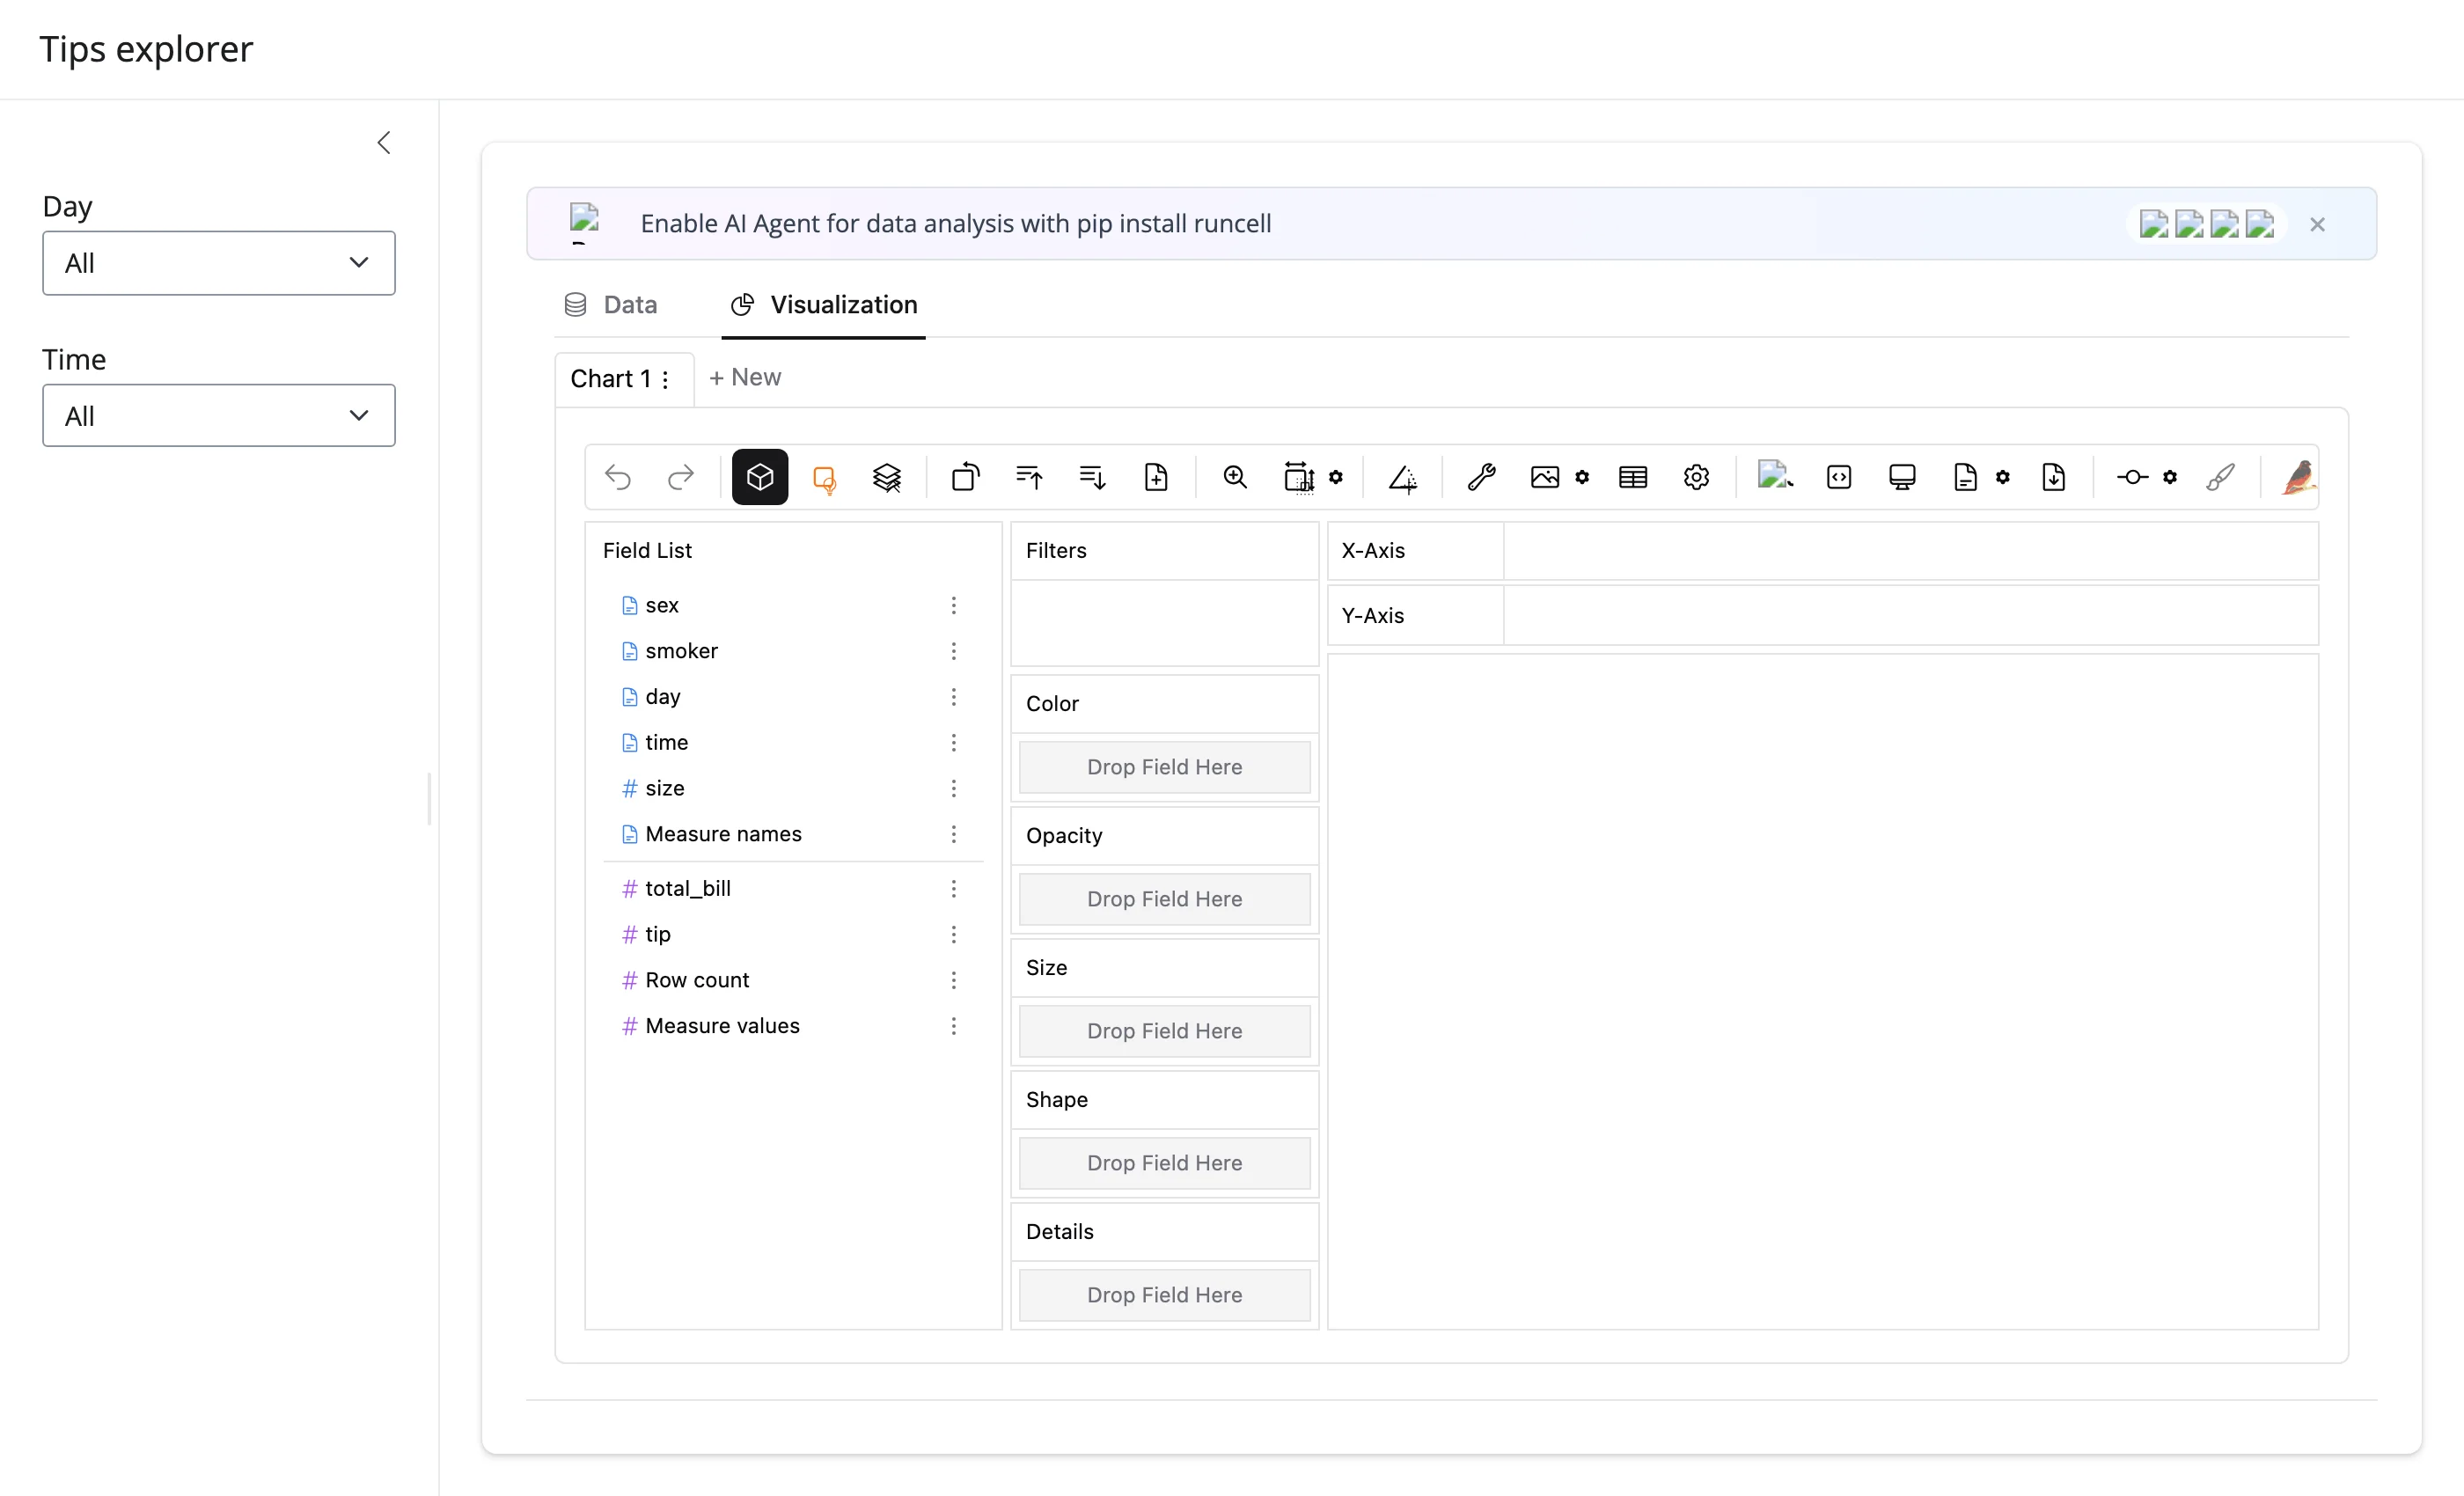
template: sidebar filters + explorer gallery/showcase_tips_dashboard.py: sidebar filters, a chart that keeps its saved spec across filter changes, and an export-driven summary/table panel, combining every pattern from “Coordinating multiple views.”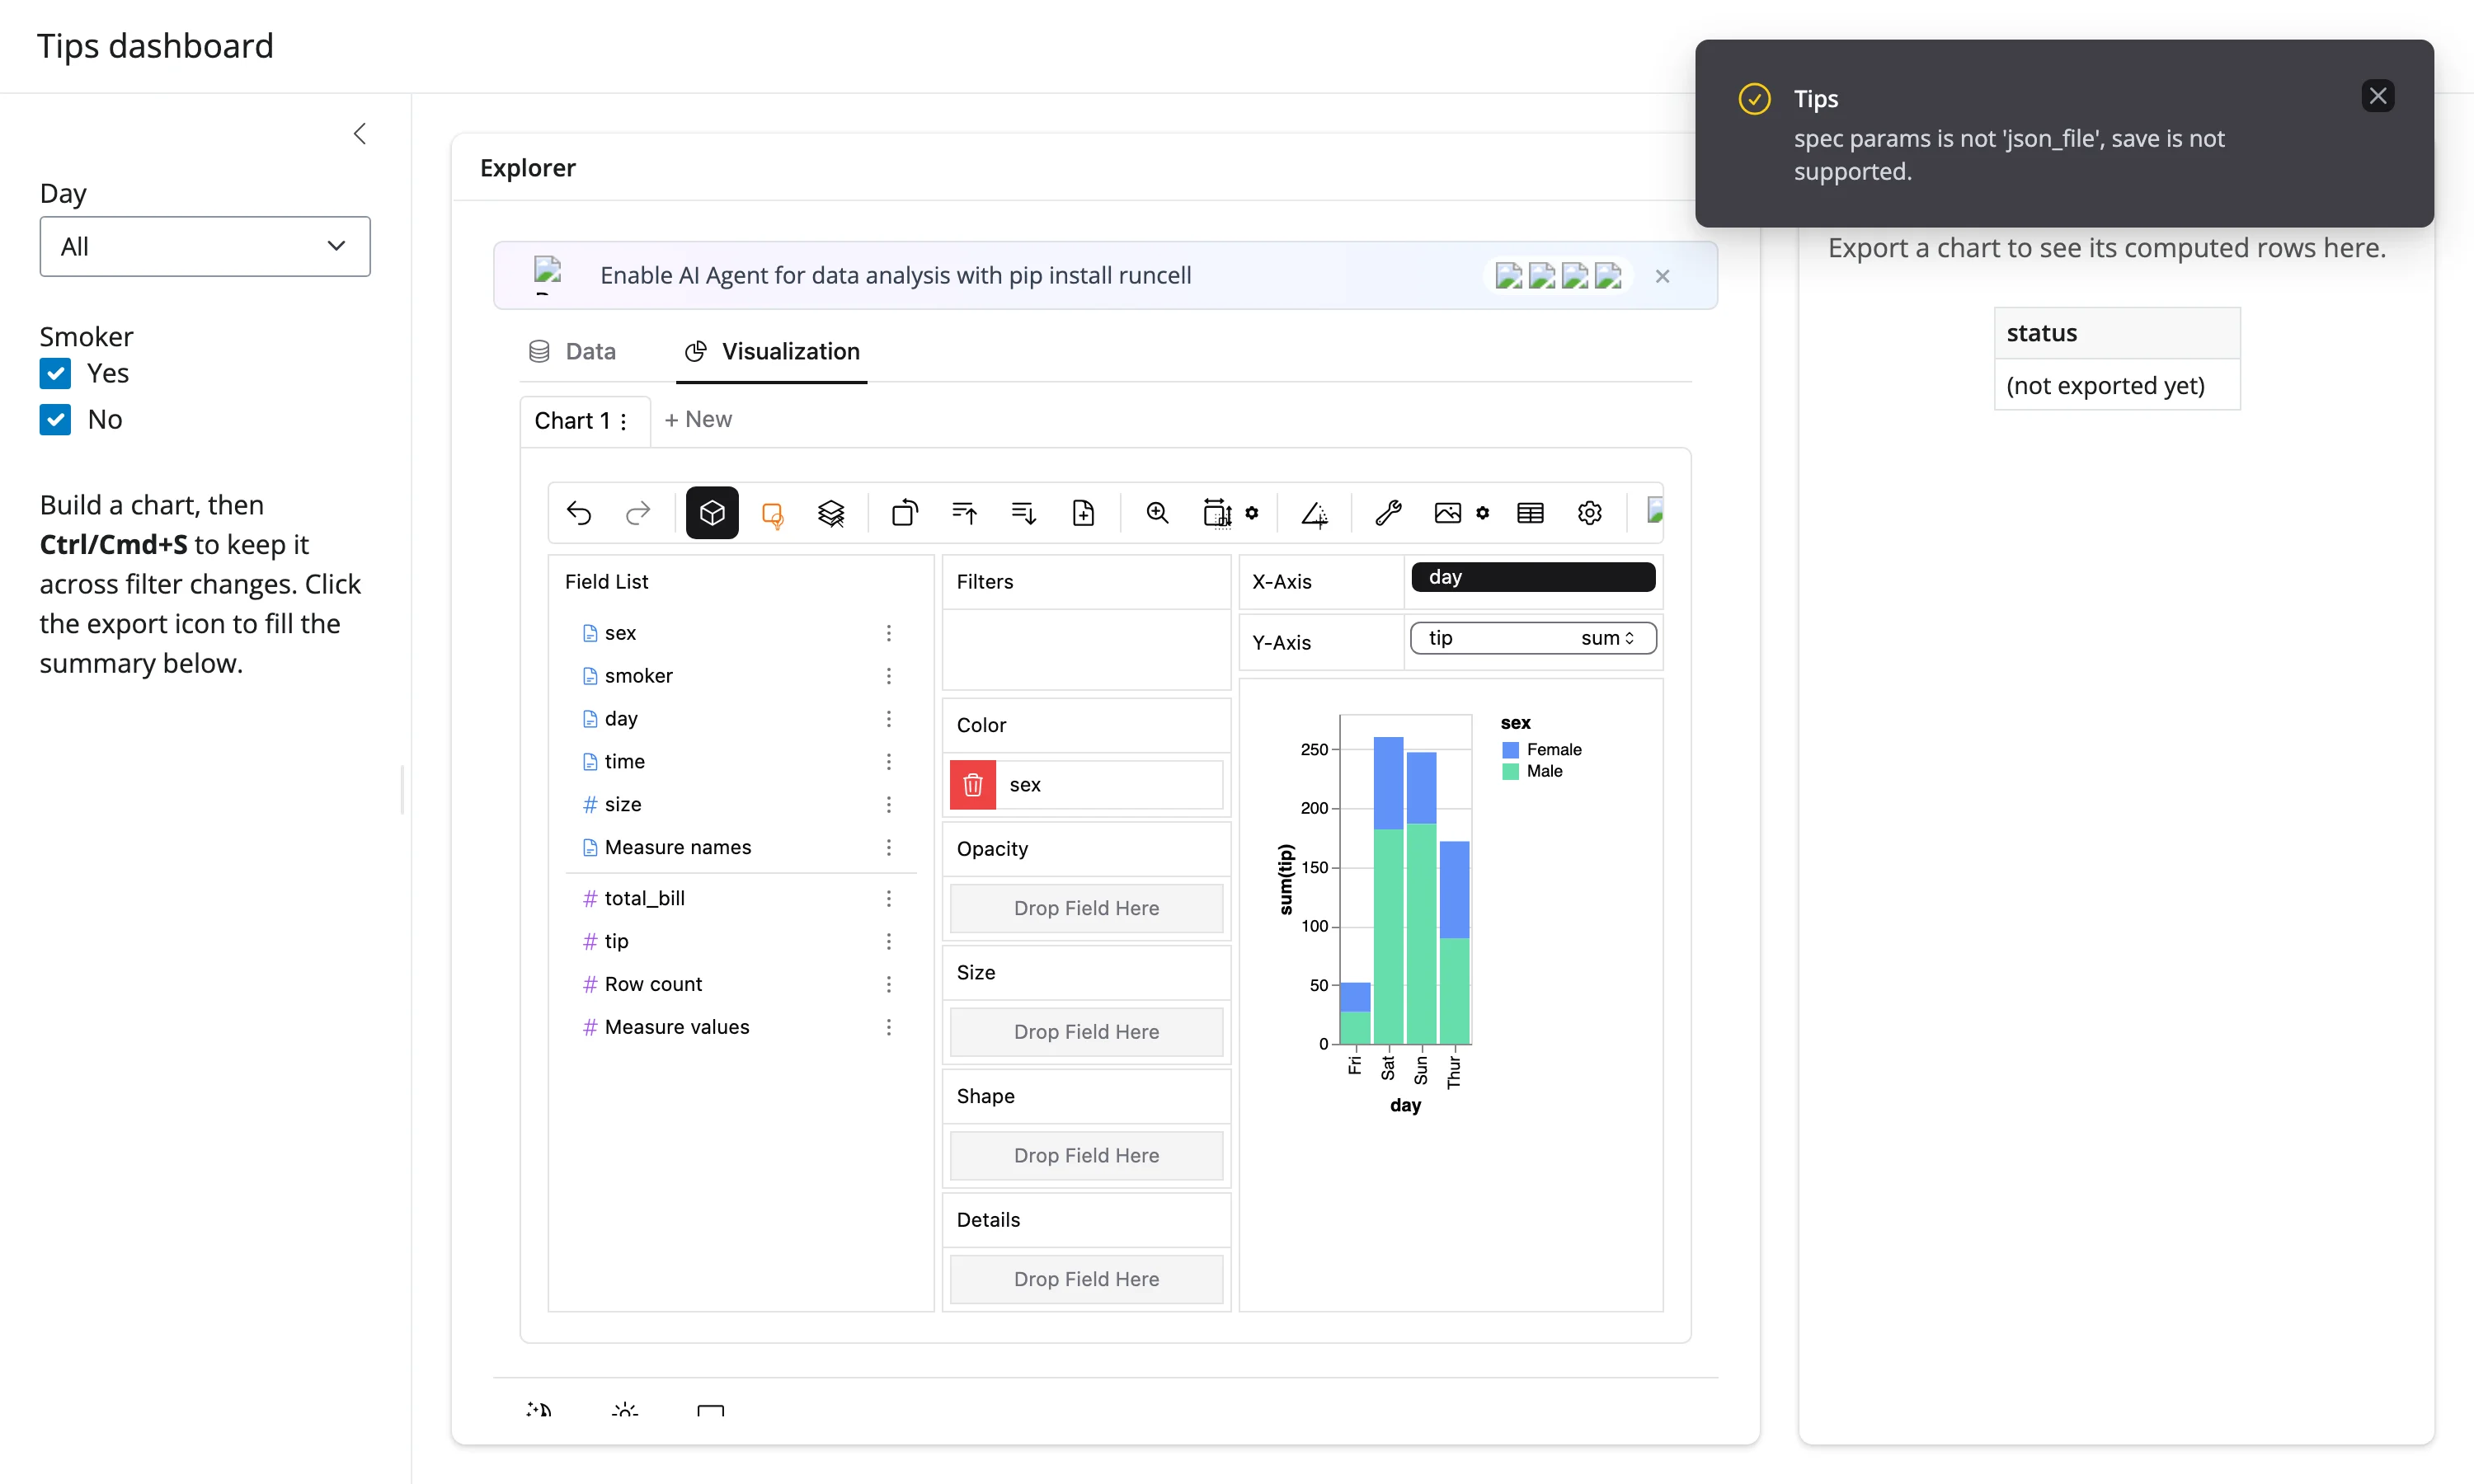
showcase: filterable dashboard with a persisted chart
Pairing with other guides
- perspective: also a drag-and-drop, browser-rendered pivot/chart UI over a DataFrame, but lighter weight and with live
filter()/view_config()accessors you can read continuously without an explicit save. Prefer perspective when you want to react to the user’s pivot/filter as they work, not just at a save/export checkpoint, or when the ~10 MB per-render PyGWalker bundle is a problem. - quak: a fast, DuckDB-backed sortable/filterable big-table browser with
sql()/data()accessors, but no drag-and-drop chart building. Prefer quak when the point is browsing/filtering rows, not building charts. Both renderers lock their DuckDB connections down by default now, but the shape of that lockdown differs: quak’s (like mosaic’s) is per-widget, so it also opts out per widget (allow_unrestricted_connection=True); PyGWalker’s is forced, with no opt-out, because every PyGWalker widget in the process shares the one connection described above. - mosaic: you design a fixed set of Vega-Lite charts up front and let users cross-filter them via a shared selection; PyGWalker instead lets users build whatever chart they want. Prefer mosaic when you know the views you want and need them linked; prefer PyGWalker when you don’t know the views in advance and want to hand that decision to the user.
Learn more
- PyGWalker documentation
- PyGWalker on GitHub
help(shinywidgets.render_pygwalker)for the full parameter and security reference- perspective, quak, mosaic – the closest siblings in the “Tables & data exploration” category