AOI workbench
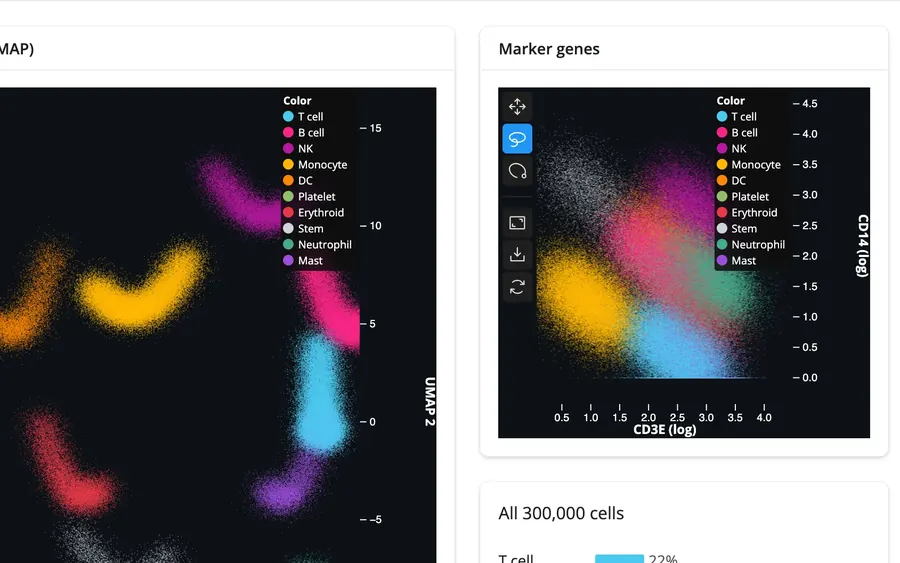
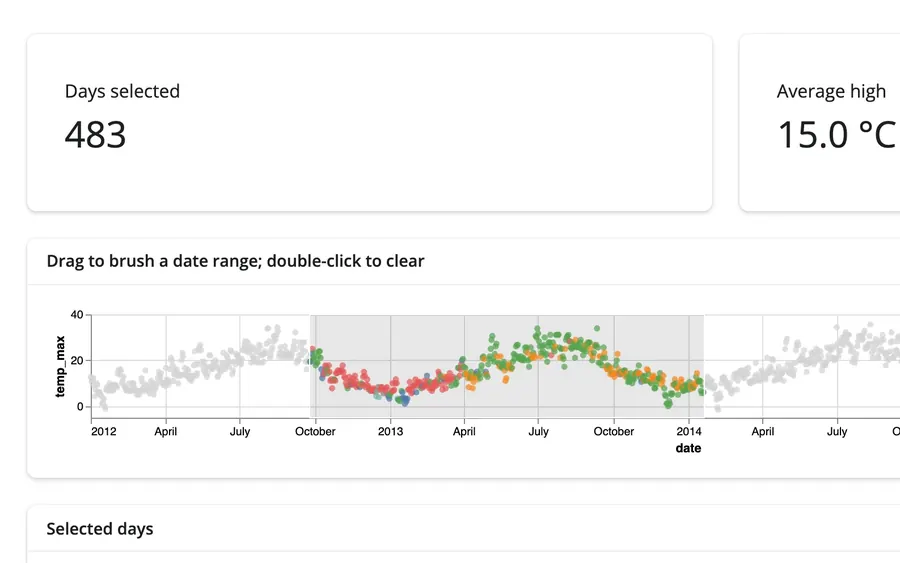
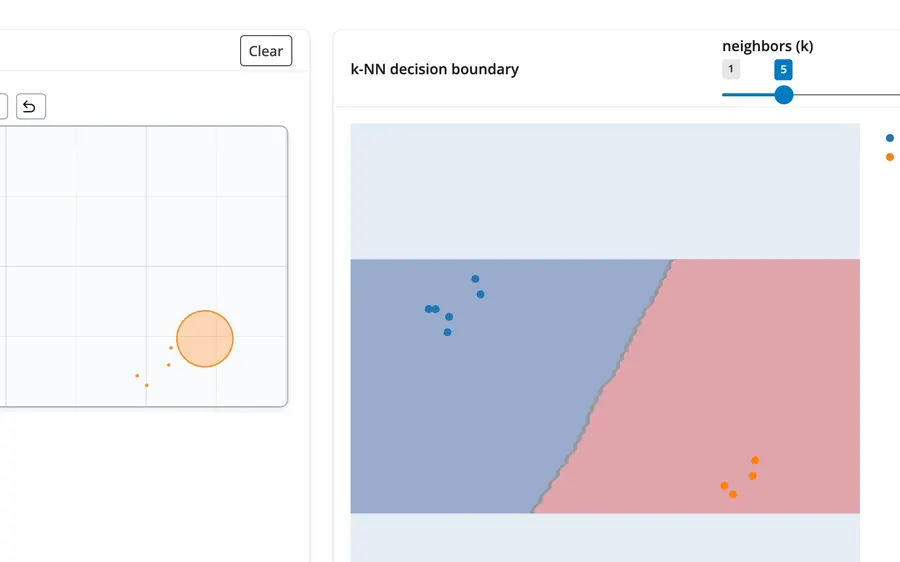
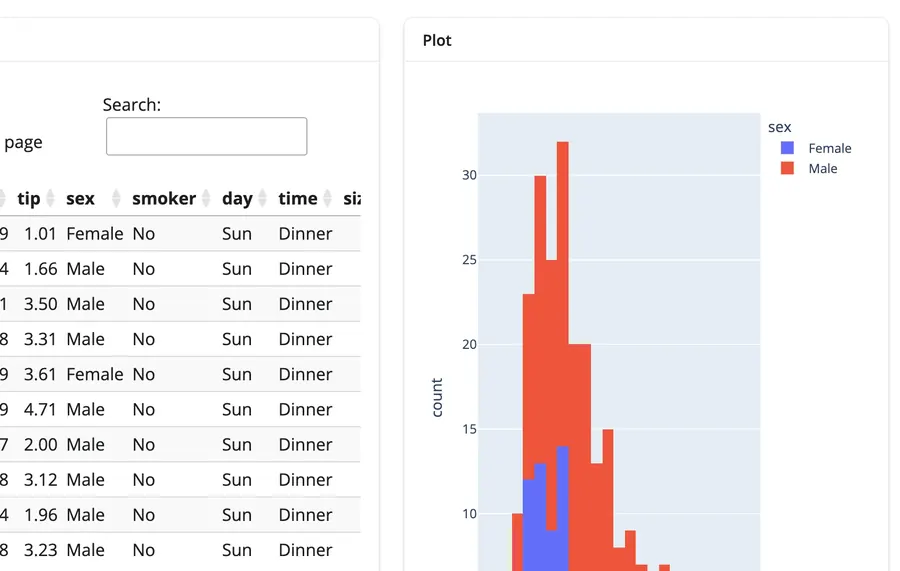
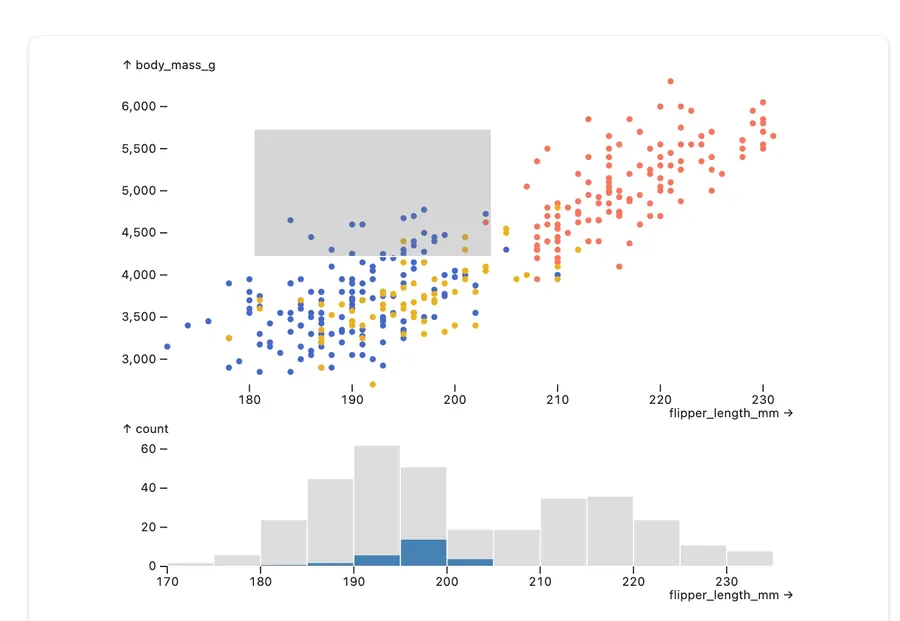
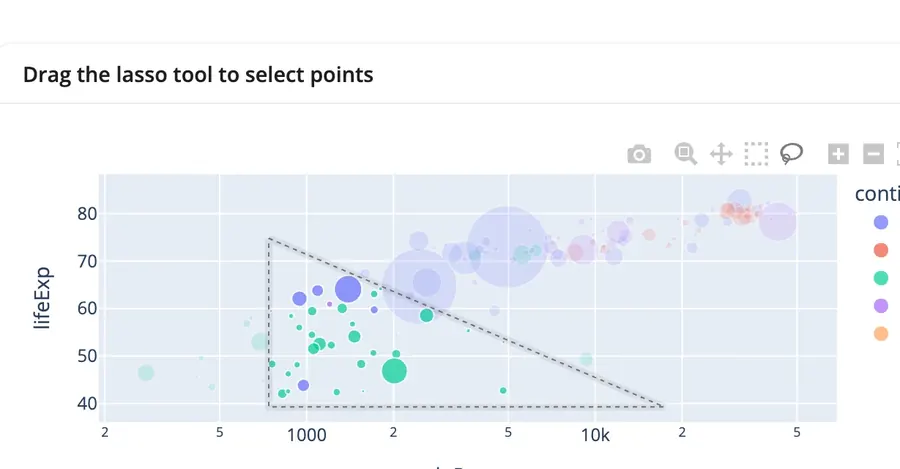
Charts
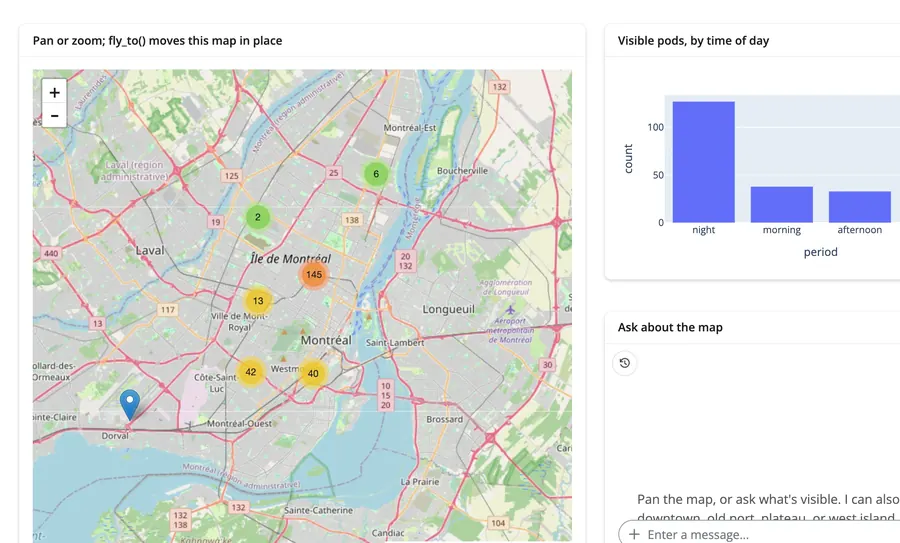
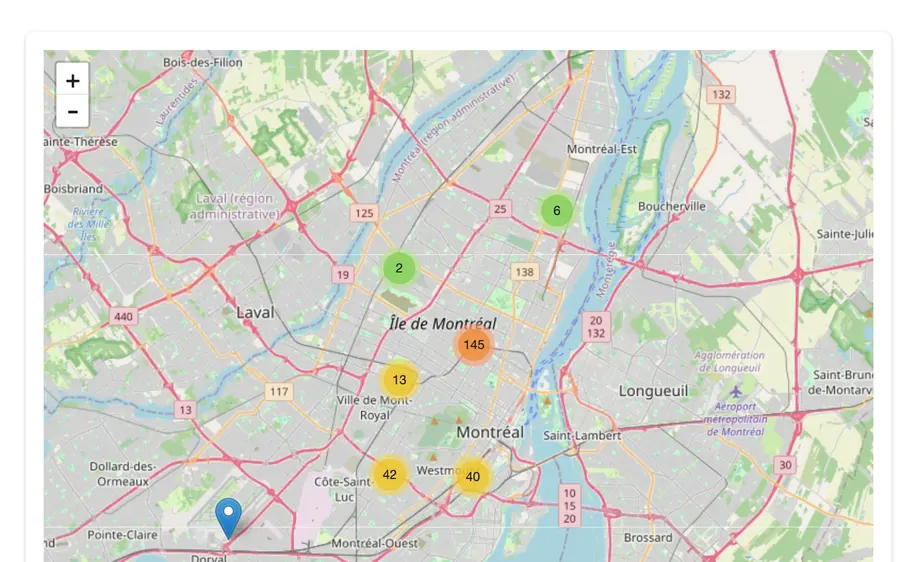
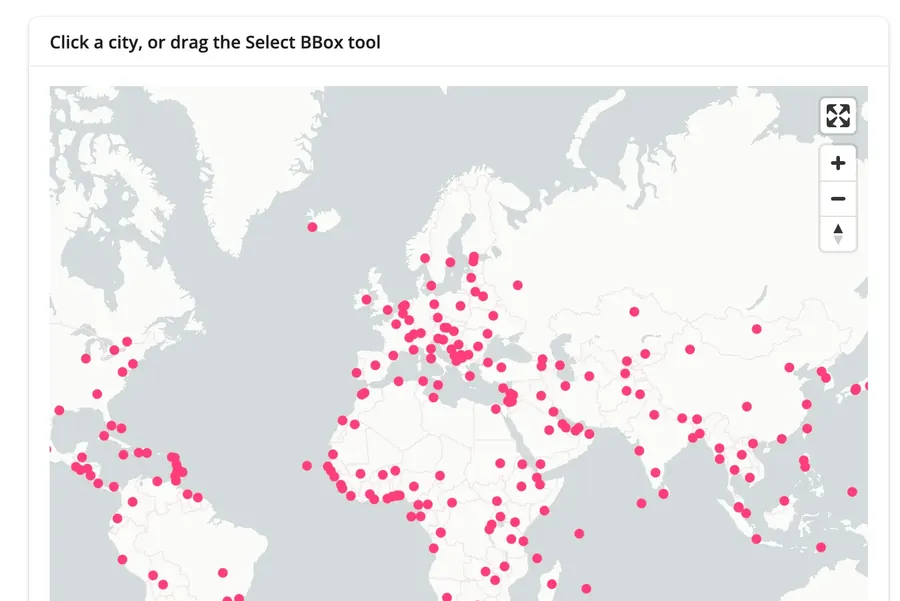
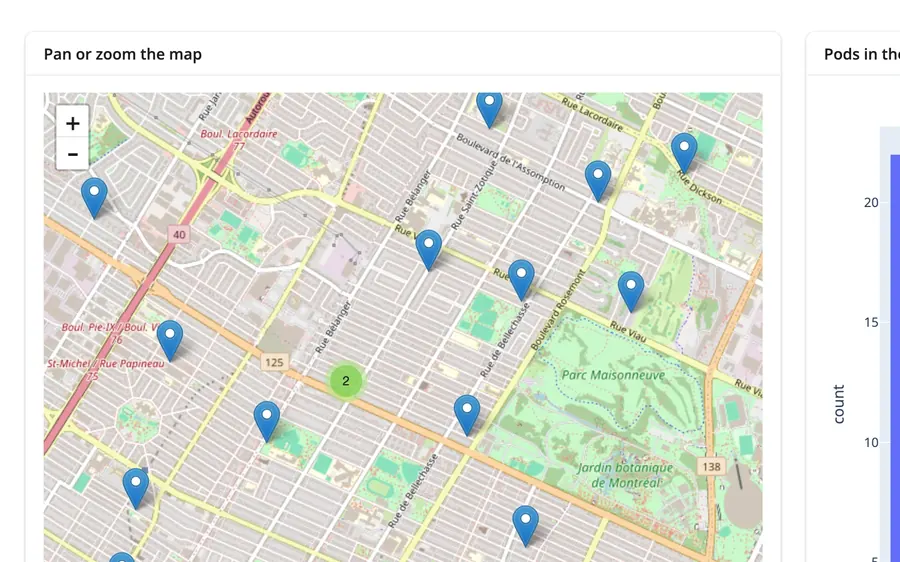
Maps & geospatial
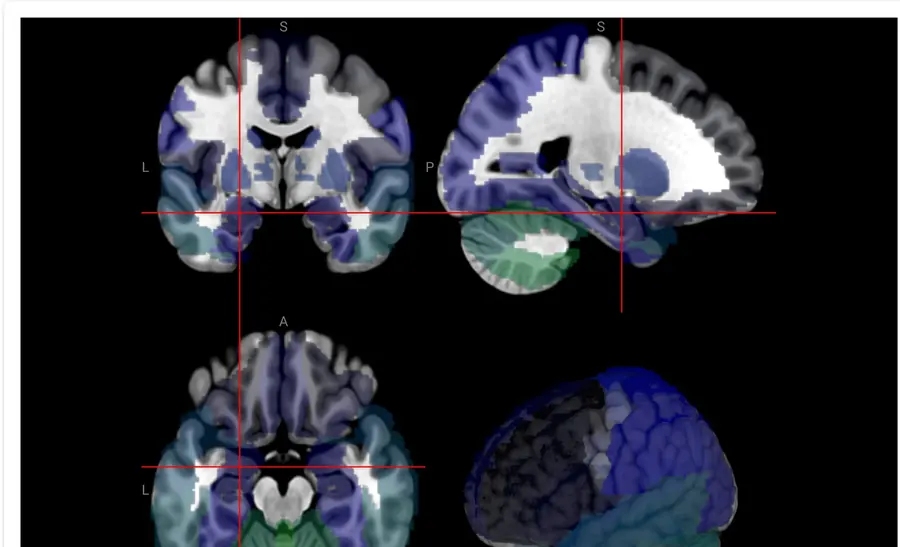
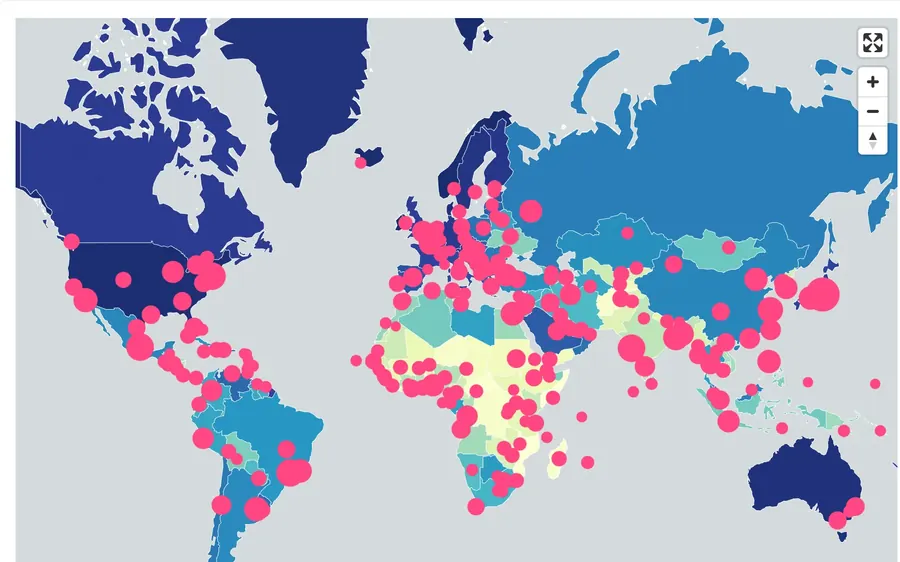
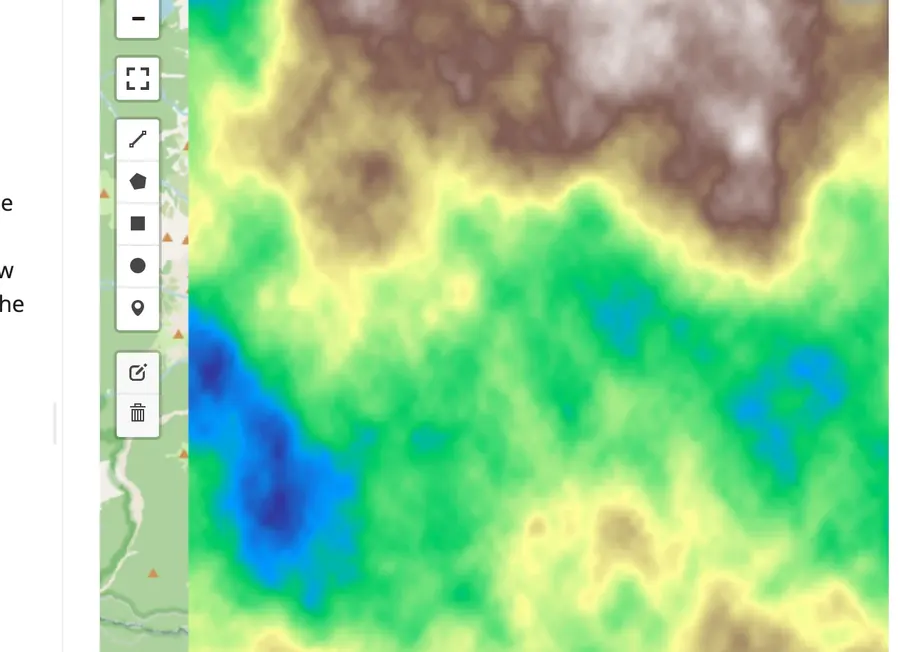
Draw areas of interest on a multi-band raster and get zonal stats and a bar chart per polygon, computed live from leafmap’s drawn_features() accessor – no server round trip…
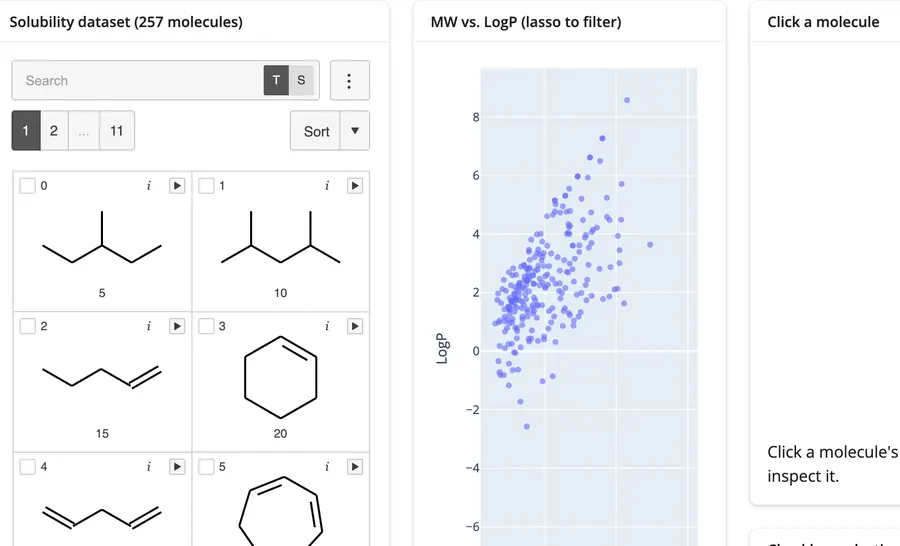
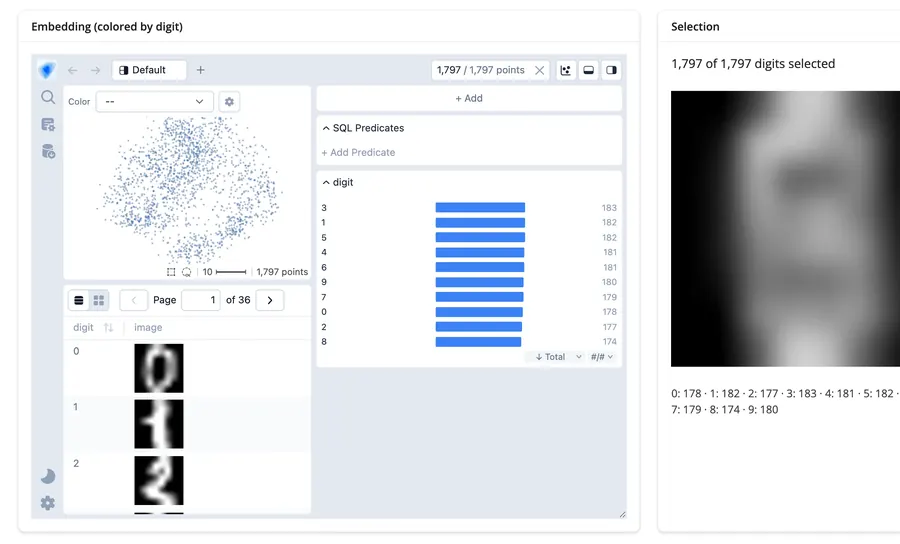
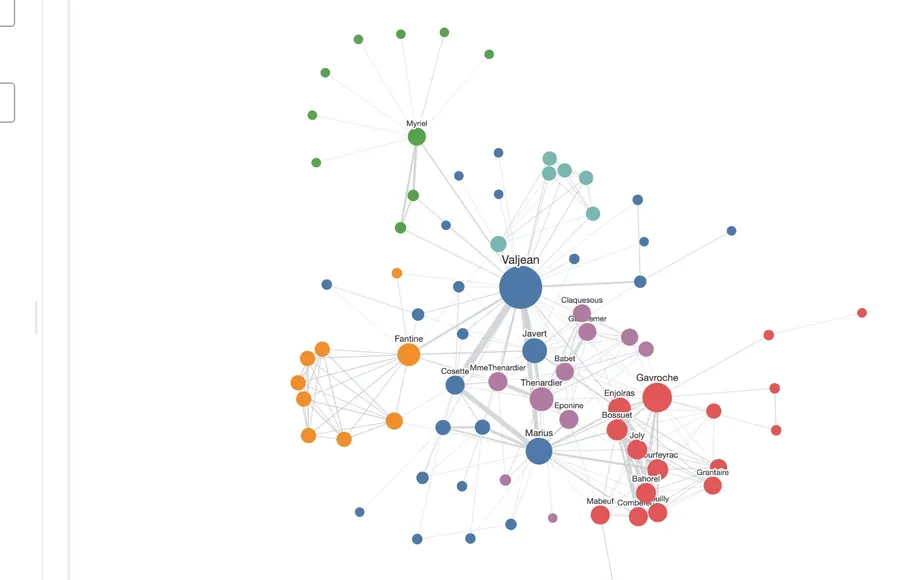
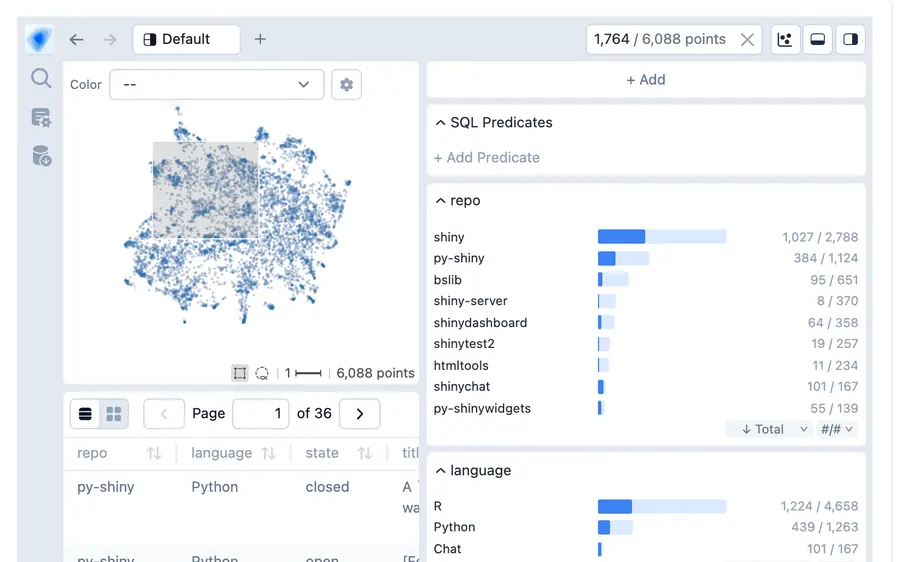
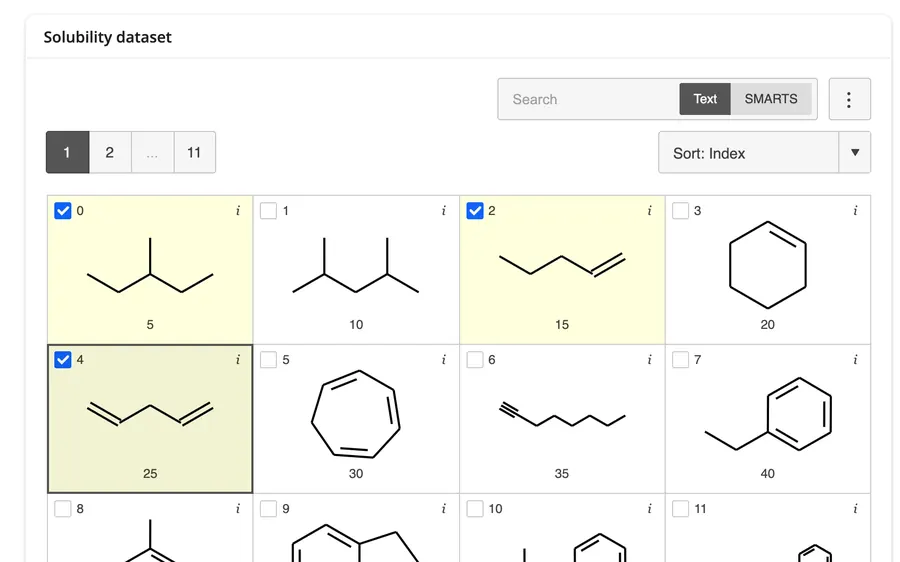
Every app here runs as-is: open its page for the source, the widgets it uses, and how to run it. Showcases combine several widgets into a full app; templates are small starting points for one pattern. Filter by kind of widget with the categories on the right.