leafmap
leafmap is a high-level geospatial mapping API by Qiusheng Wu, built for doing real GIS work with a few lines of code: one-liner basemaps from a 100+ provider catalog, vector and raster loaders that handle reprojection and styling for you, split-panel comparisons, legends and colorbars, and a drawing toolbar on every map by default. It is not a new rendering engine – it is a friendlier front door onto several of them. Depending on which leafmap.*.Map you construct, you get ipyleaflet (the default), MapLibre vector tiles, or a kepler.gl authoring surface, all through the same add_* method vocabulary.
@render_leafmap accepts a map from any of leafmap’s four widget-backed backends – leafmap.Map (ipyleaflet), leafmap.maplibregl.Map, leafmap.kepler.Map, and leafmap.plotlymap.Map – and neutralizes the one thing all of them get wrong for a web app: every backend defaults to a fixed 600px height, which overflows a Shiny card. render_leafmap treats that default as unset, so your map fills its container like any other shinywidgets output, while an explicit height you asked for is still respected. leafmap’s other two backends, folium and pydeck, aren’t ipywidgets at all; render_leafmap raises a TypeError that names the working alternative instead of a confusing stack trace.
The headline feature in this release is reactive accessors on the default (ipyleaflet) backend: bounds(), zoom(), center(), clicked(), and drawn_features() read the live map the same way input.my_slider() reads a control, so panning, clicking, and drawing shapes become ordinary Shiny reactivity – no manual callback wiring. On the other three backends, read state with .read() instead (render_leafmap points you to the right trait when you call an accessor on the wrong backend).
Choosing leafmap vs. its backends directly: reach for leafmap when you want its high-level loaders (add_gdf, add_data, add_cog_layer, split_map, time sliders, legends) or you’re not sure which mapping engine you need yet. Drop to ../ipyleaflet/guide.md directly when you only need ipyleaflet’s own layer/control API with no leafmap convenience methods, or to ../maplibre/guide.md for vector tiles and globe projection without leafmap’s wrapper. This guide focuses on what leafmap adds on top; see those guides for the low-level APIs and their accessors in depth (the ipyleaflet accessors are literally the same code leafmap’s default backend uses).
Installation
pip install 'shinywidgets[leafmap]'This installs leafmap and a plotly version compatible with its (optional) plotly backend. Two capabilities need one more package each, installed separately because they pull in a fair number of transitive dependencies:
- Local rasters / COGs (
add_raster,add_cog_layeron local files):pip install 'leafmap[raster]', which adds localtileserver – see../localtileserver/guide.mdfor how shinywidgets serves its tiles in a deployed app. - kepler.gl backend:
pip install keplergl. The current stable release (0.3.7) additionally needspip install "setuptools<81"(it importspkg_resourceswithout declaring the dependency).
Quick start
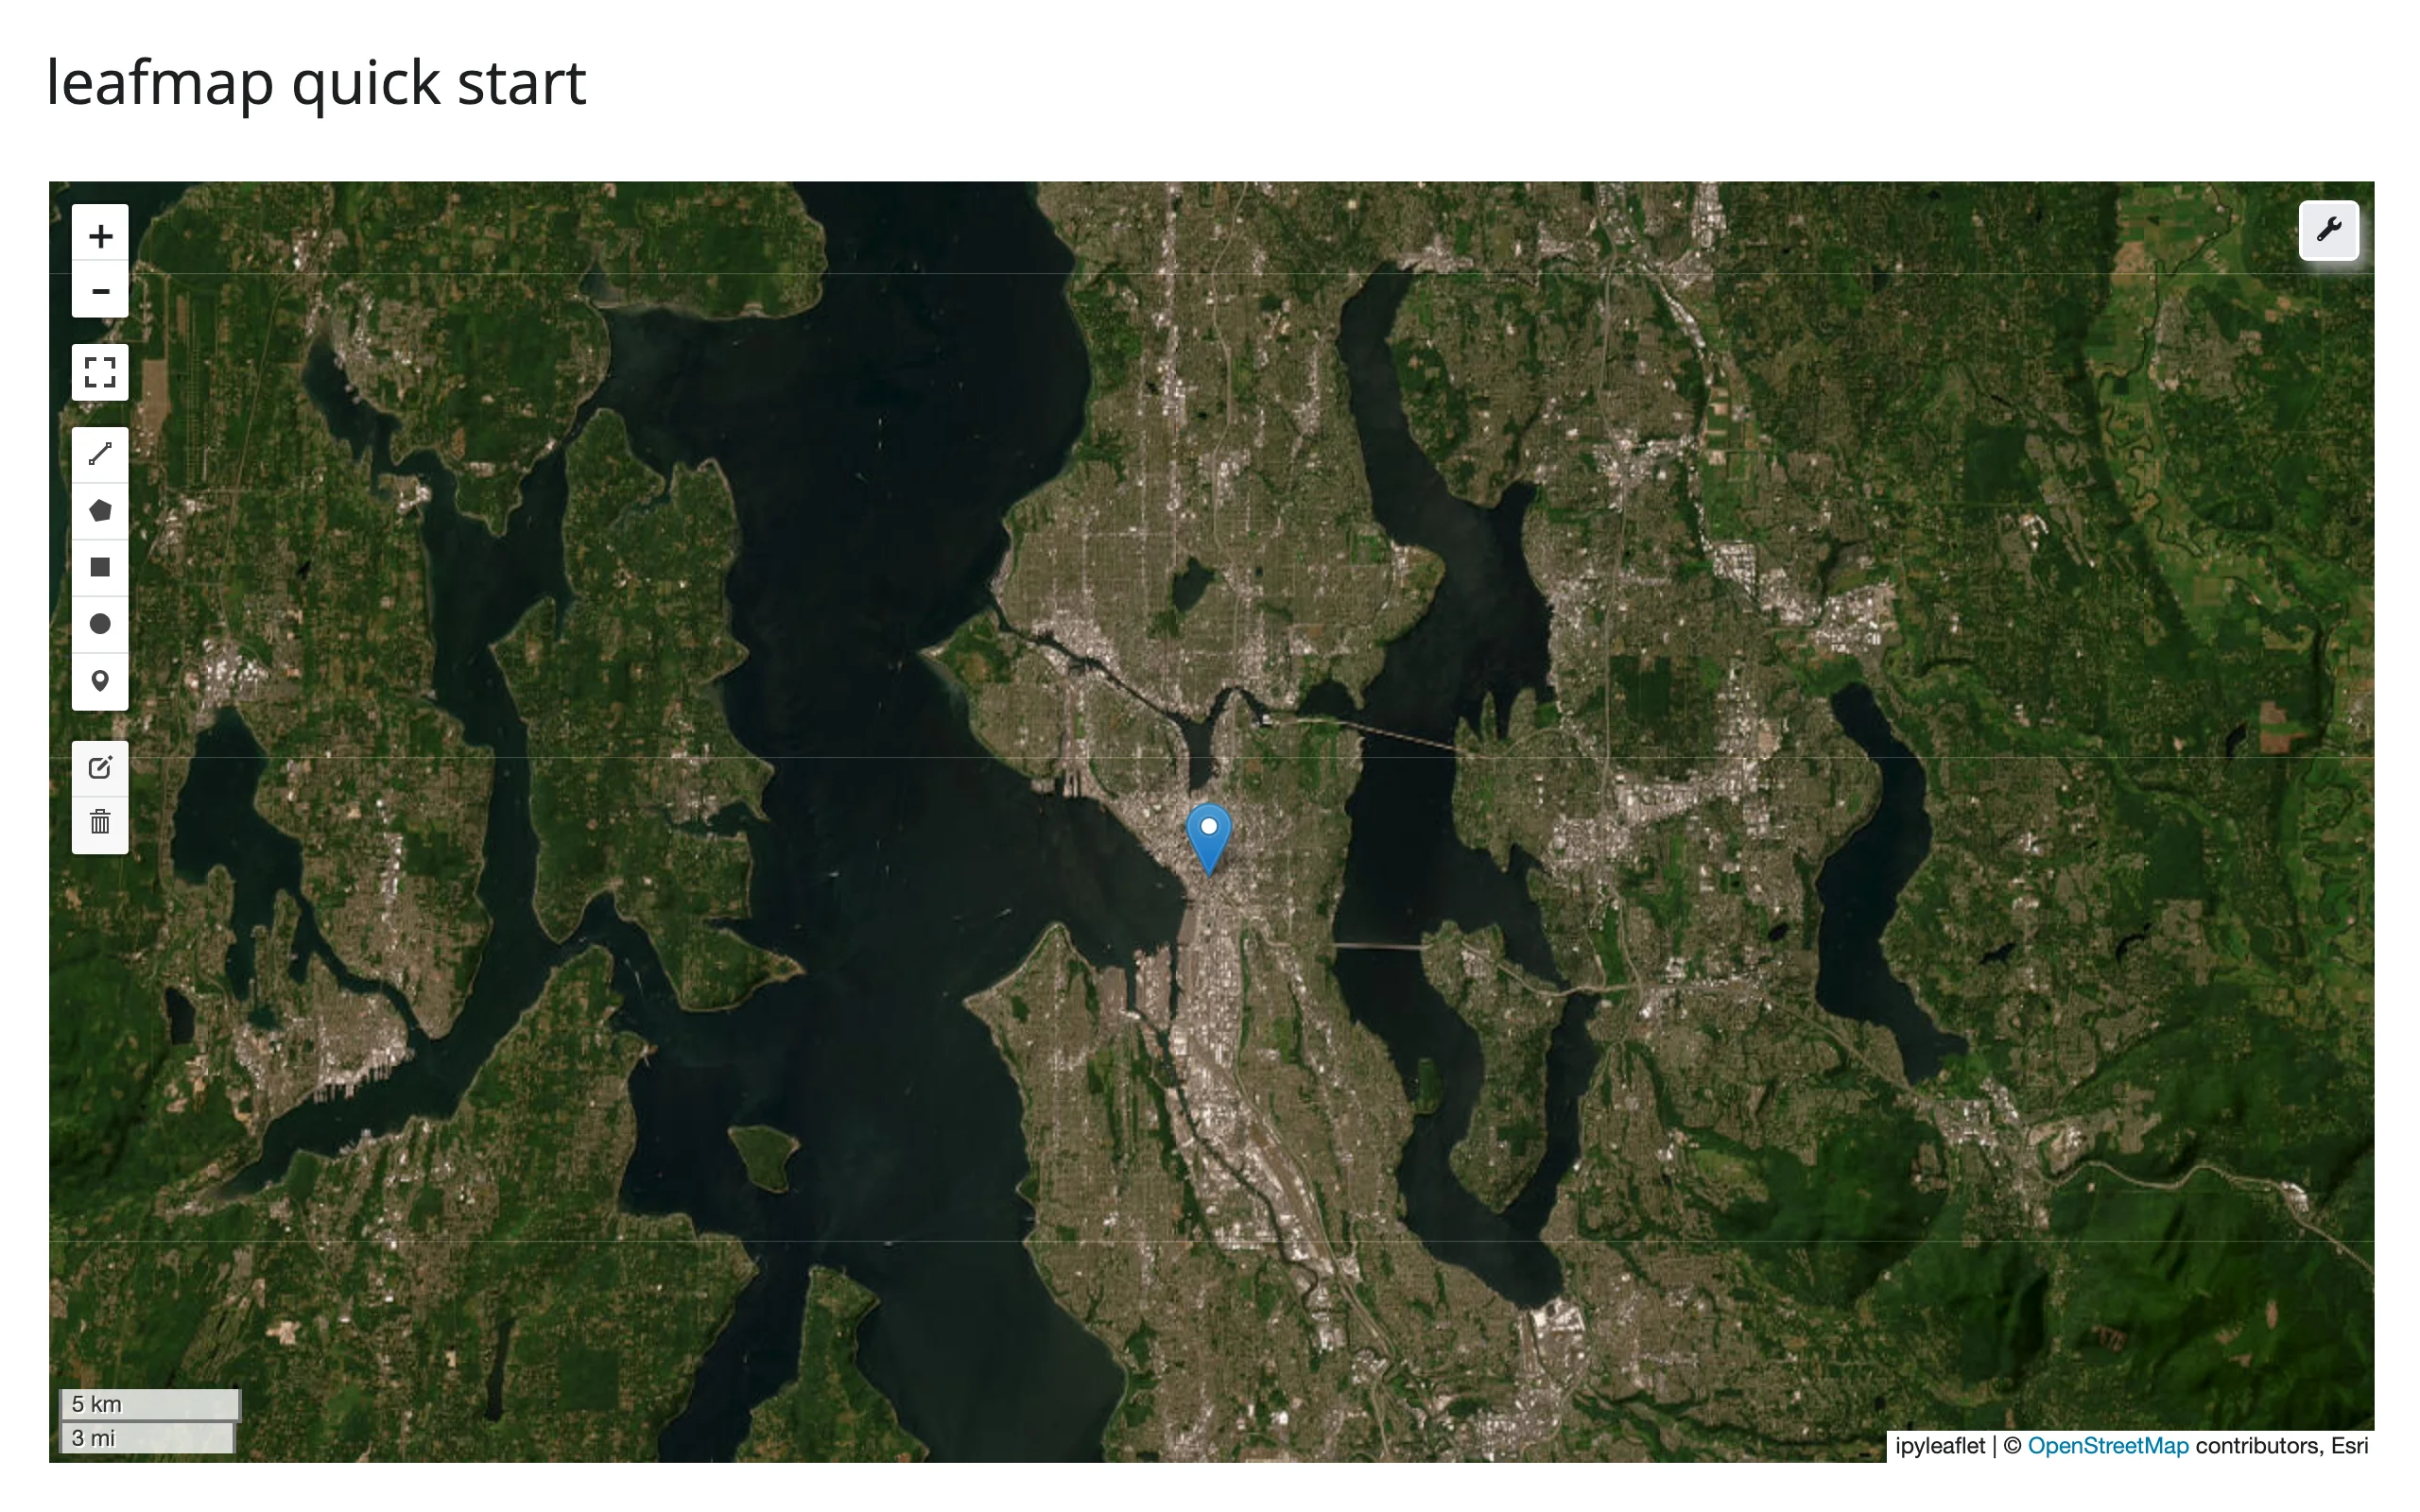
A map, a satellite basemap, and a marker – leafmap.Map() is an ipyleaflet.Map subclass, so it fills its card like any other shinywidgets map output:
import leafmap
from shiny.express import ui
from shinywidgets import render_leafmap

ui.page_opts(title="leafmap quick start", fillable=True)


@render_leafmap
def map():
    m = leafmap.Map(center=(47.62, -122.33), zoom=11)
    m.add_basemap("Esri.WorldImagery")
    m.add_marker(location=(47.6062, -122.3321), tooltip="Seattle")
    return m
Notice the toolbar (wrench icon, top right) and the drawing controls (left side) – leafmap adds these by default, and they work out of the box: the wrench opens a basemap gallery and other tools, and the drawing toolbar is what powers drawn_features() below.
What you can build
Basemaps from a 100+ provider catalog
add_basemap(name) looks up a tile provider by name from leafmap.basemaps (Esri, CartoDB, USGS, Stadia, NASA GIBS, and more – see list(leafmap.basemaps)) and swaps it in with one call; no XYZ URL or attribution string to track down yourself.
import leafmap
from shiny.express import input, ui
from shinywidgets import render_leafmap

ui.page_opts(title="leafmap basemaps", fillable=True)

with ui.sidebar():
    # leafmap.basemaps has 100+ names from the xyzservices registry (Esri,
    # CartoDB, USGS, NASA GIBS, ...) -- add_basemap() looks one up by name
    ui.input_select(
        "basemap",
        "Basemap",
        [
            "Esri.WorldImagery",
            "OpenTopoMap",
            "Stadia.AlidadeSmoothDark",
            "USGS.USImageryTopo",
        ],
    )


@render_leafmap
def map():
    m = leafmap.Map(center=(36.1, -112.1), zoom=10)  # Grand Canyon
    m.add_basemap(input.basemap())
    return m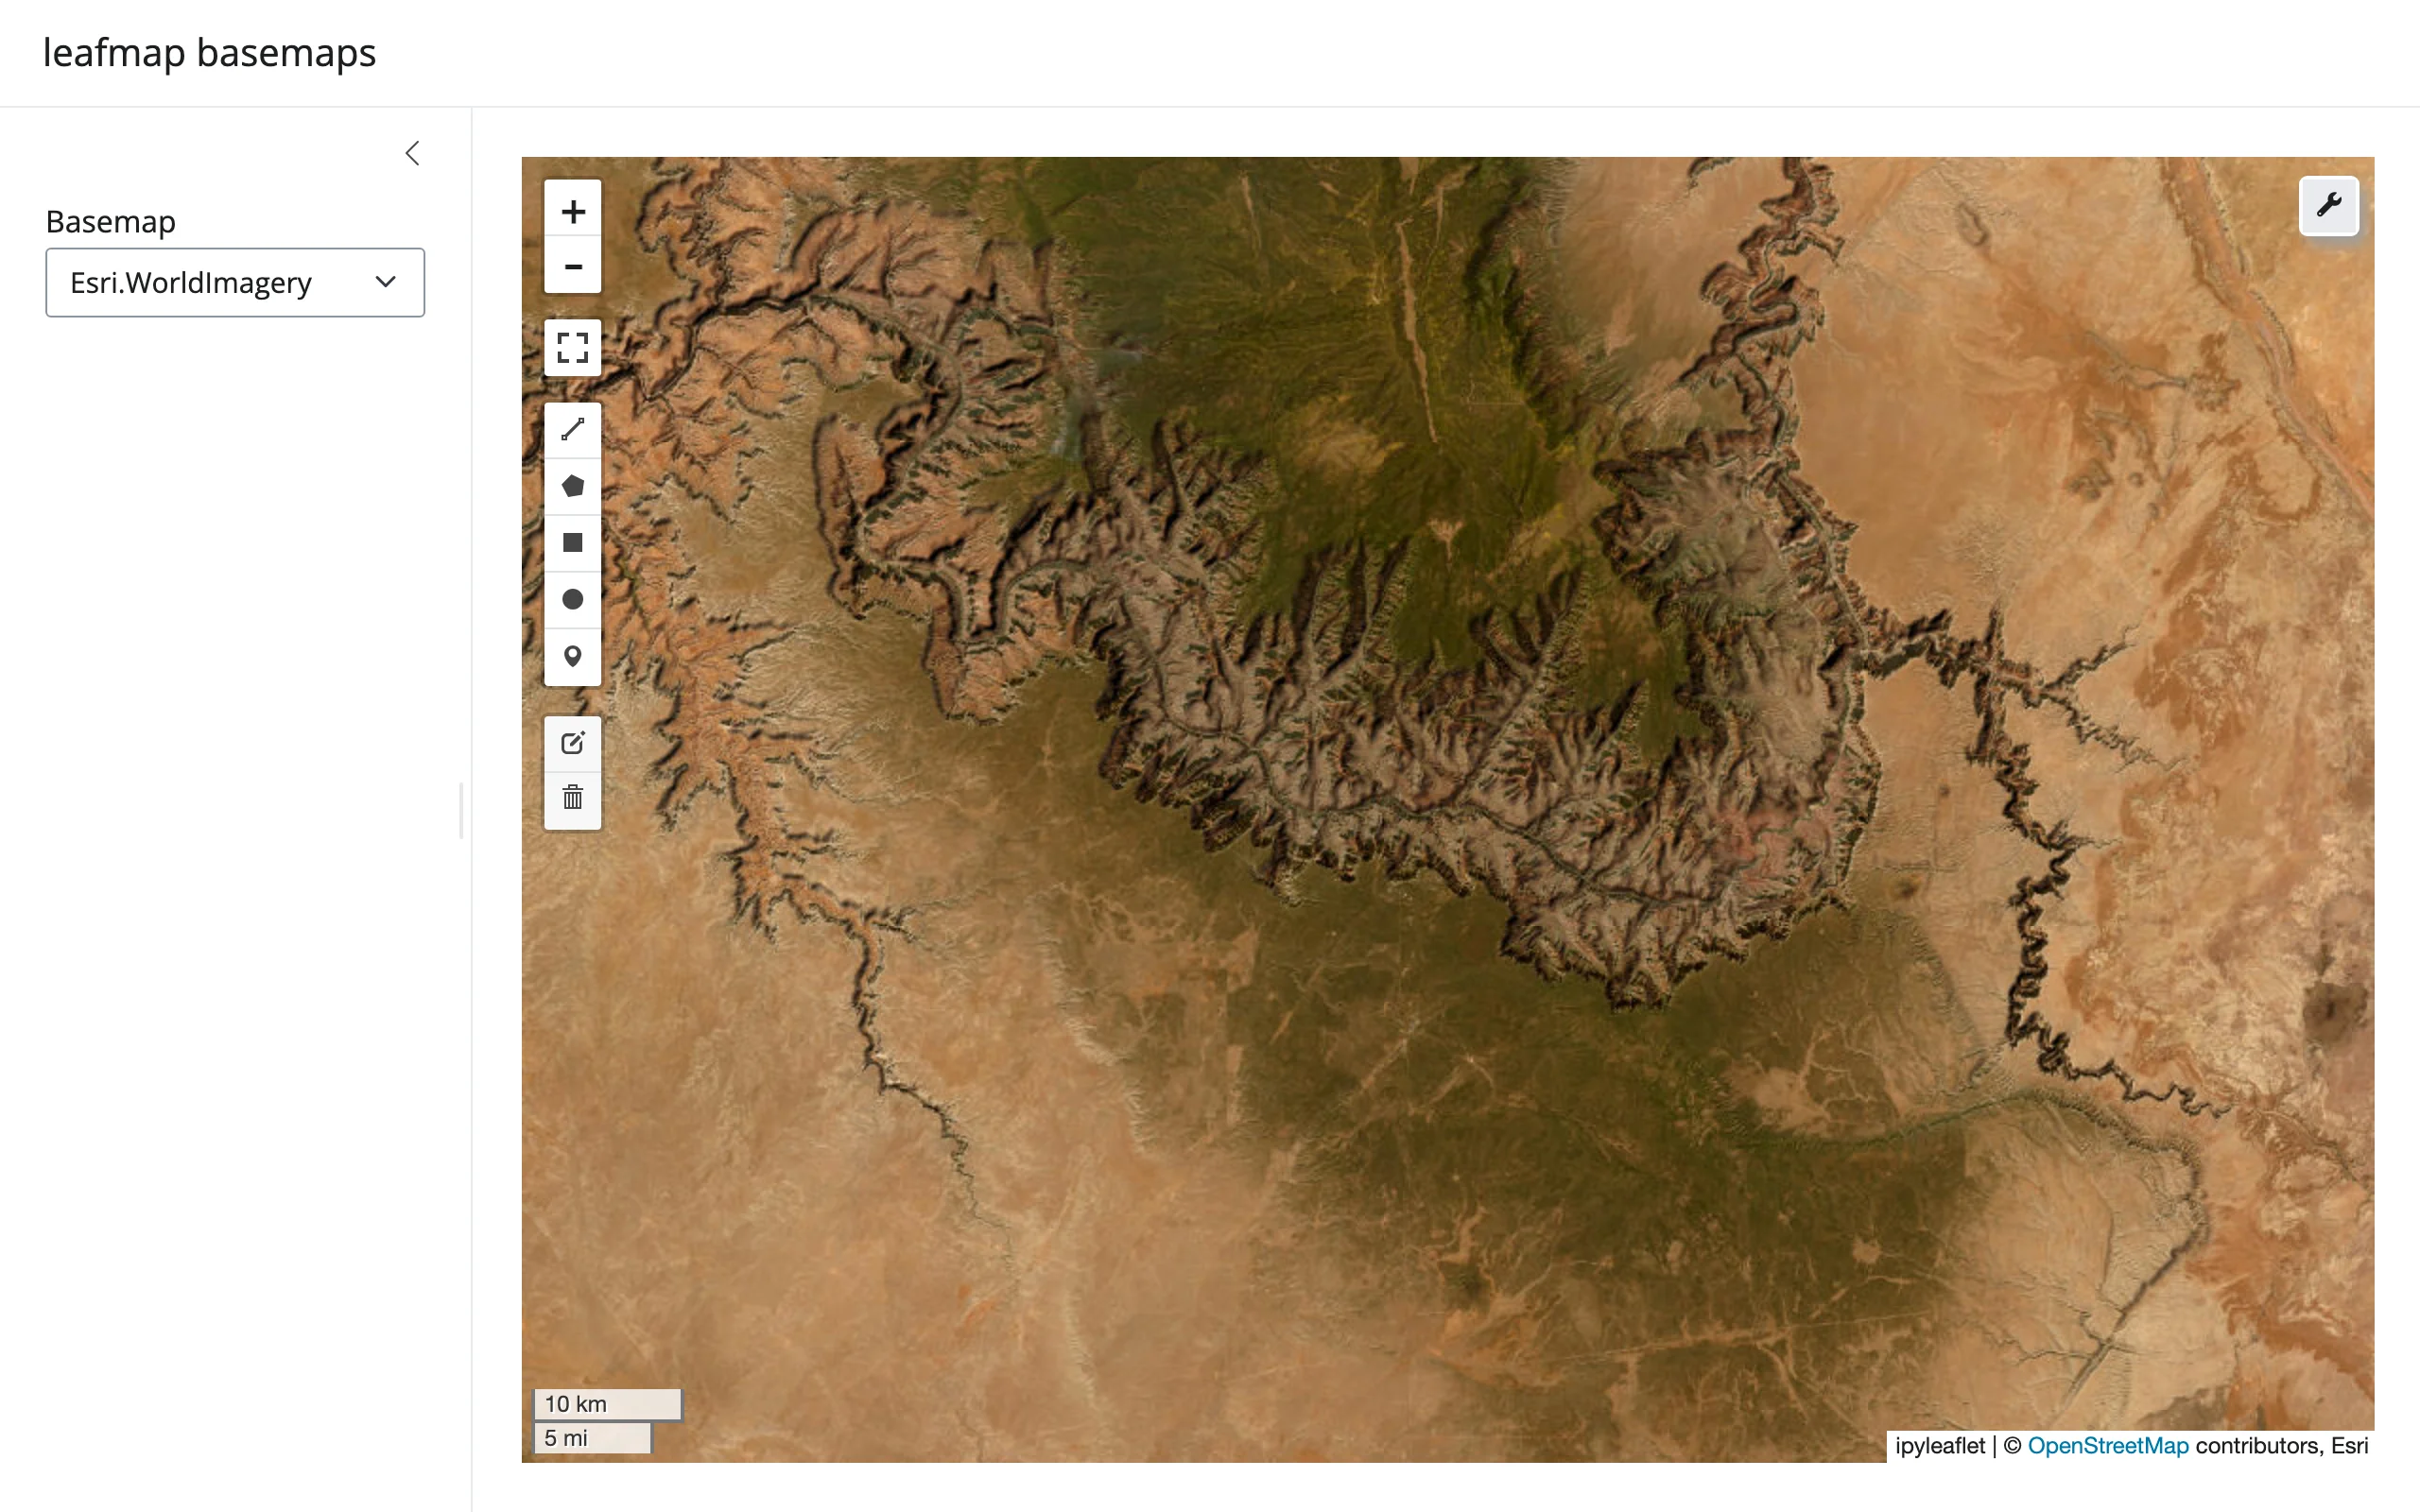
Vector data with hover details, no manual GeoJSON wiring
add_gdf() (a GeoPandas GeoDataFrame) and add_geojson() (a dict or URL) both take a style_callback for per-feature styling and info_mode="on_hover" for an automatic tooltip built from every property – the feature inspector you’d otherwise hand-build with an ipyleaflet GeoJSON layer and a popup callback.
import leafmap
from shiny.express import ui
from shinywidgets import render_leafmap

COUNTRIES = "https://raw.githubusercontent.com/opengeos/leafmap/master/examples/data/countries.geojson"

ui.page_opts(title="leafmap vector data", fillable=True)


@render_leafmap
def map():
    m = leafmap.Map(center=(20, 0), zoom=2)
    m.add_basemap("CartoDB.Positron")
    # add_geojson/add_gdf take a style dict, a per-feature style_callback, and a
    # hover tooltip built from every property -- no manual GeoJSON layer wiring
    m.add_geojson(
        COUNTRIES,
        layer_name="Countries",
        style_callback=lambda feat: {
            "fillColor": "#2a9d8f"
            if feat["properties"]["CONTINENT"] == "Africa"
            else "#264653",
            "color": "white",
            "weight": 0.5,
            "fillOpacity": 0.6,
        },
        hover_style={"fillOpacity": 0.9, "weight": 2},
        info_mode="on_hover",
    )
    return m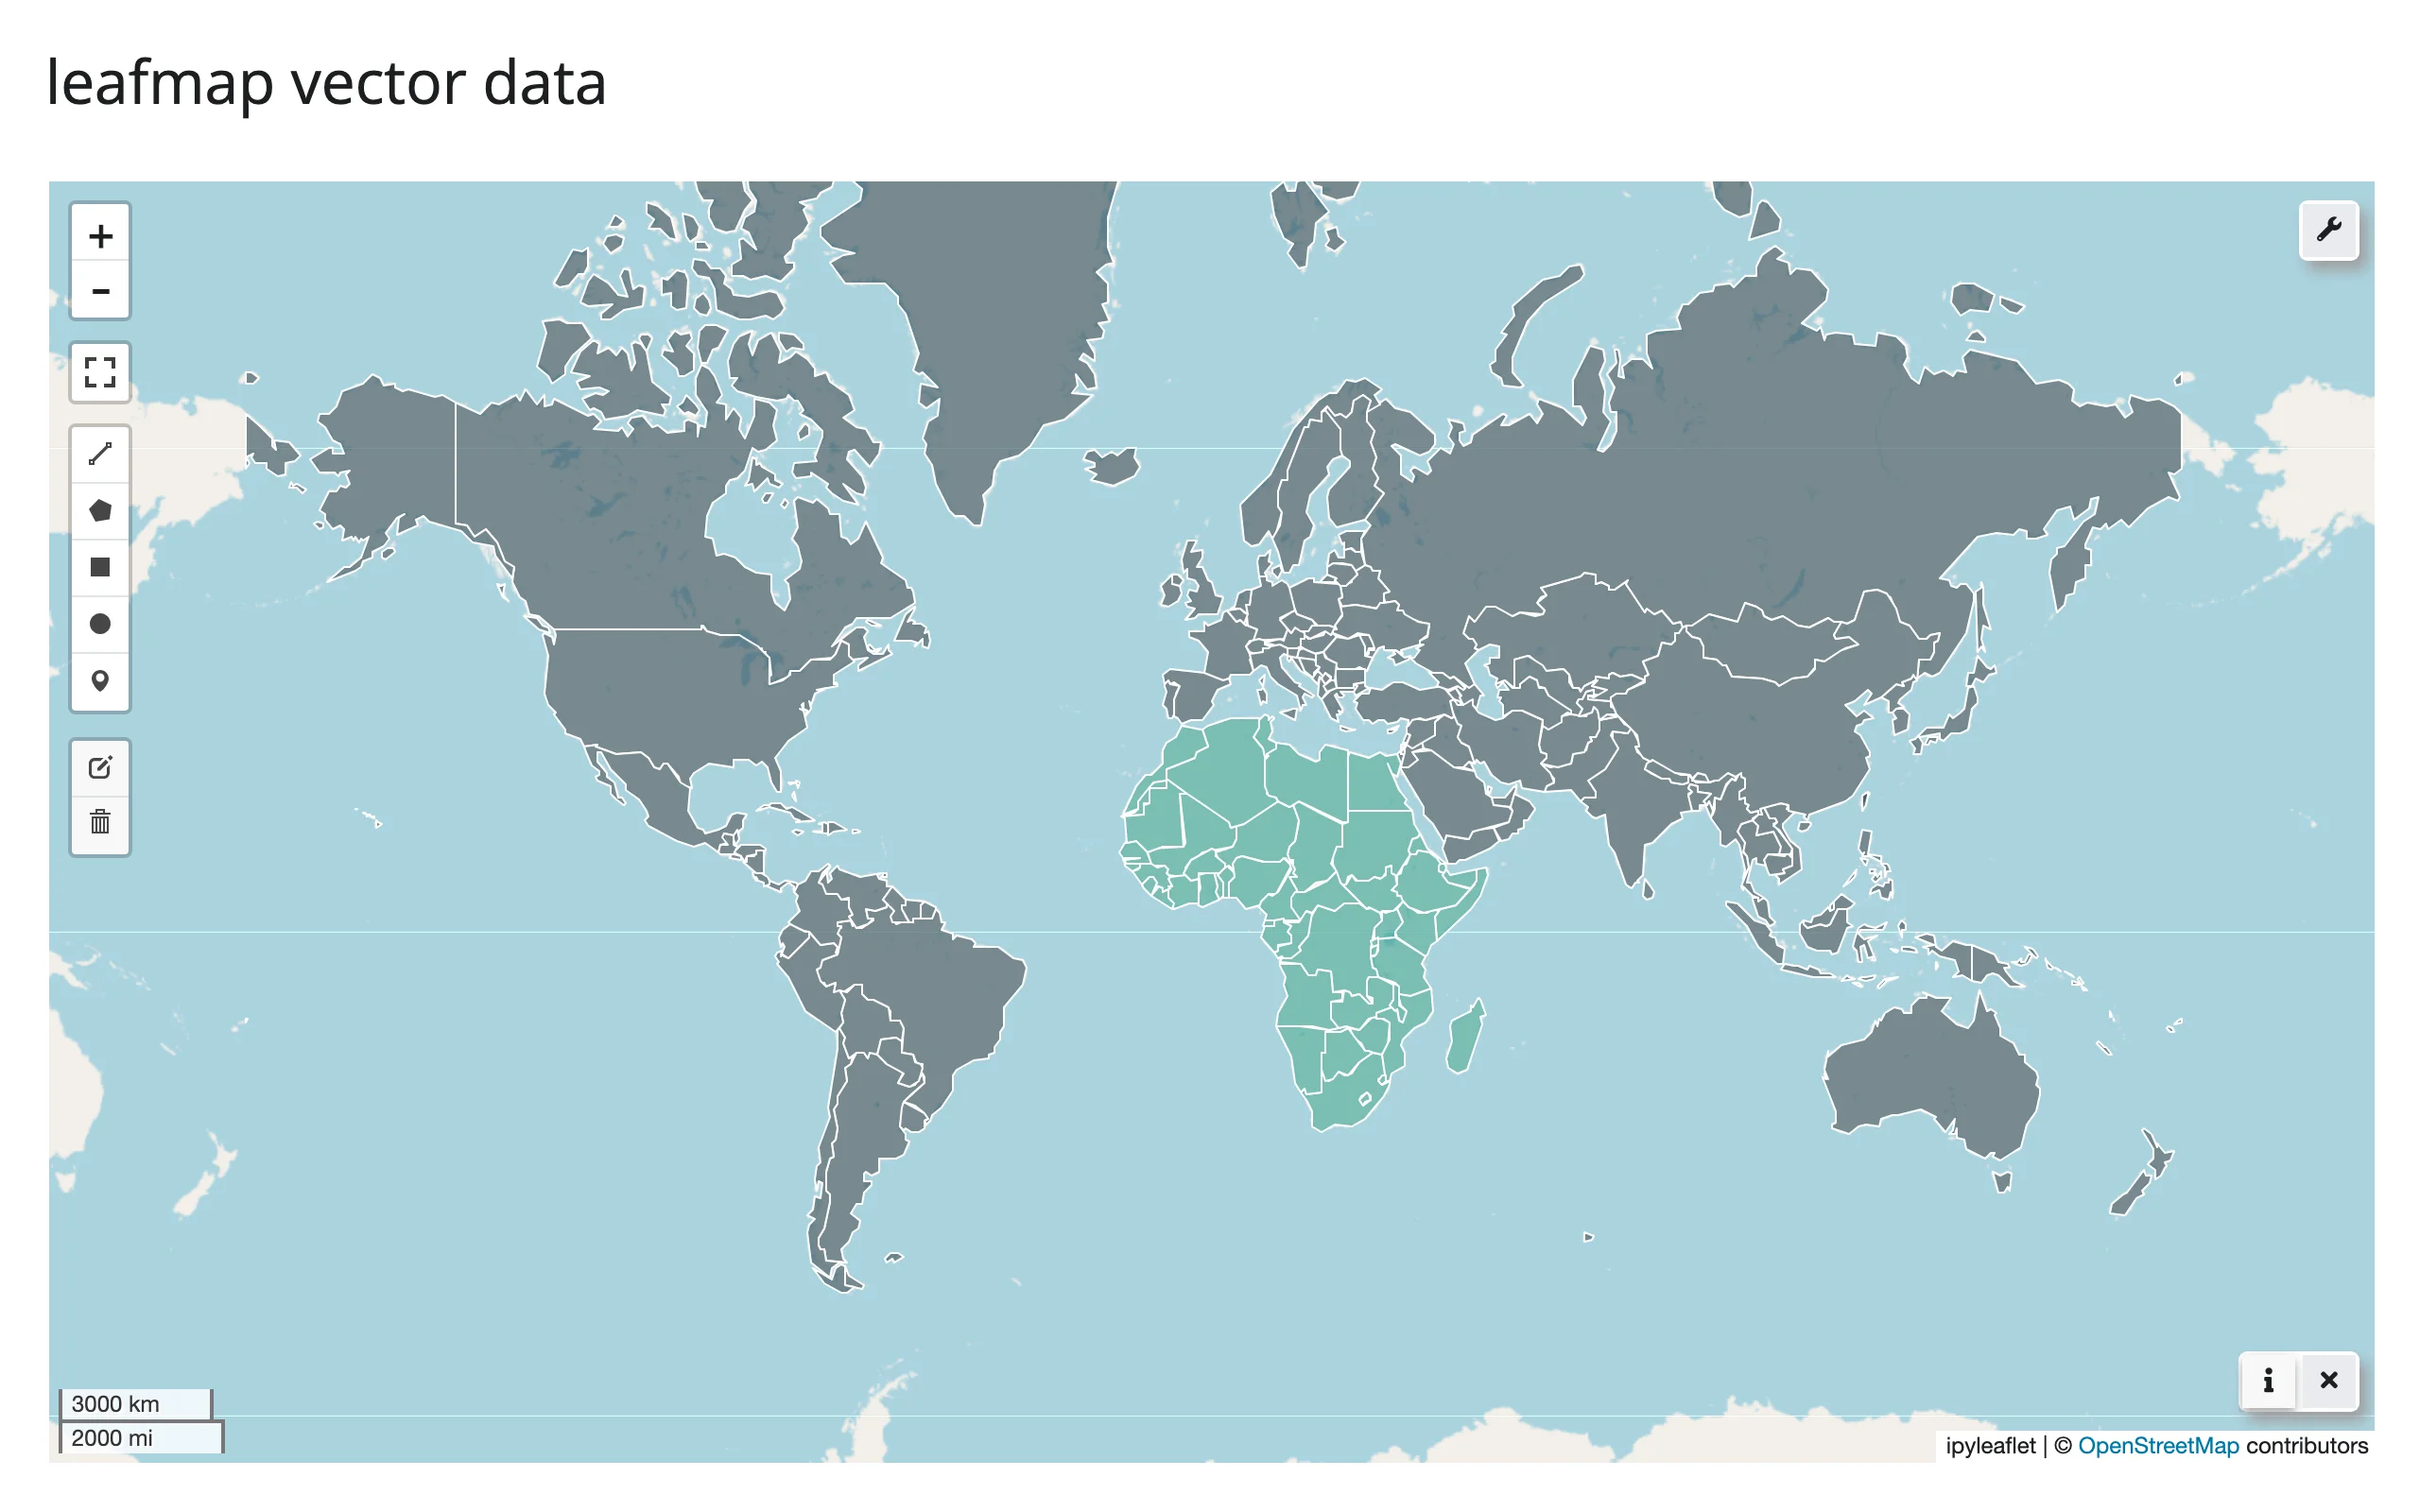
Choropleths in one call
add_data() classifies a numeric column (Quantiles, Equal Interval, Natural Breaks, …), colors the layer, and adds the legend – the one-liner version of a geopandas.GeoDataFrame.plot(column=...) choropleth. It needs mapclassify installed for the classification step.
# Needs mapclassify for the classification scheme: `uv run --with mapclassify shiny run
# 04_choropleth.py` (or pip install mapclassify).
import leafmap
from shiny.express import ui
from shinywidgets import render_leafmap

COUNTRIES = "https://raw.githubusercontent.com/opengeos/leafmap/master/examples/data/countries.geojson"

ui.page_opts(title="leafmap choropleth", fillable=True)


@render_leafmap
def map():
    m = leafmap.Map(center=(20, 0), zoom=2)
    # add_data classifies a numeric column (here, Natural Earth's estimated GDP),
    # colors the layer, and adds the legend -- the one-liner version of a
    # geopandas .plot(column=...) choropleth
    m.add_data(
        COUNTRIES,
        column="GDP_MD_EST",
        scheme="Quantiles",
        k=6,
        cmap="YlGnBu",
        legend_title="GDP (million USD)",
        layer_name="GDP",
    )
    return m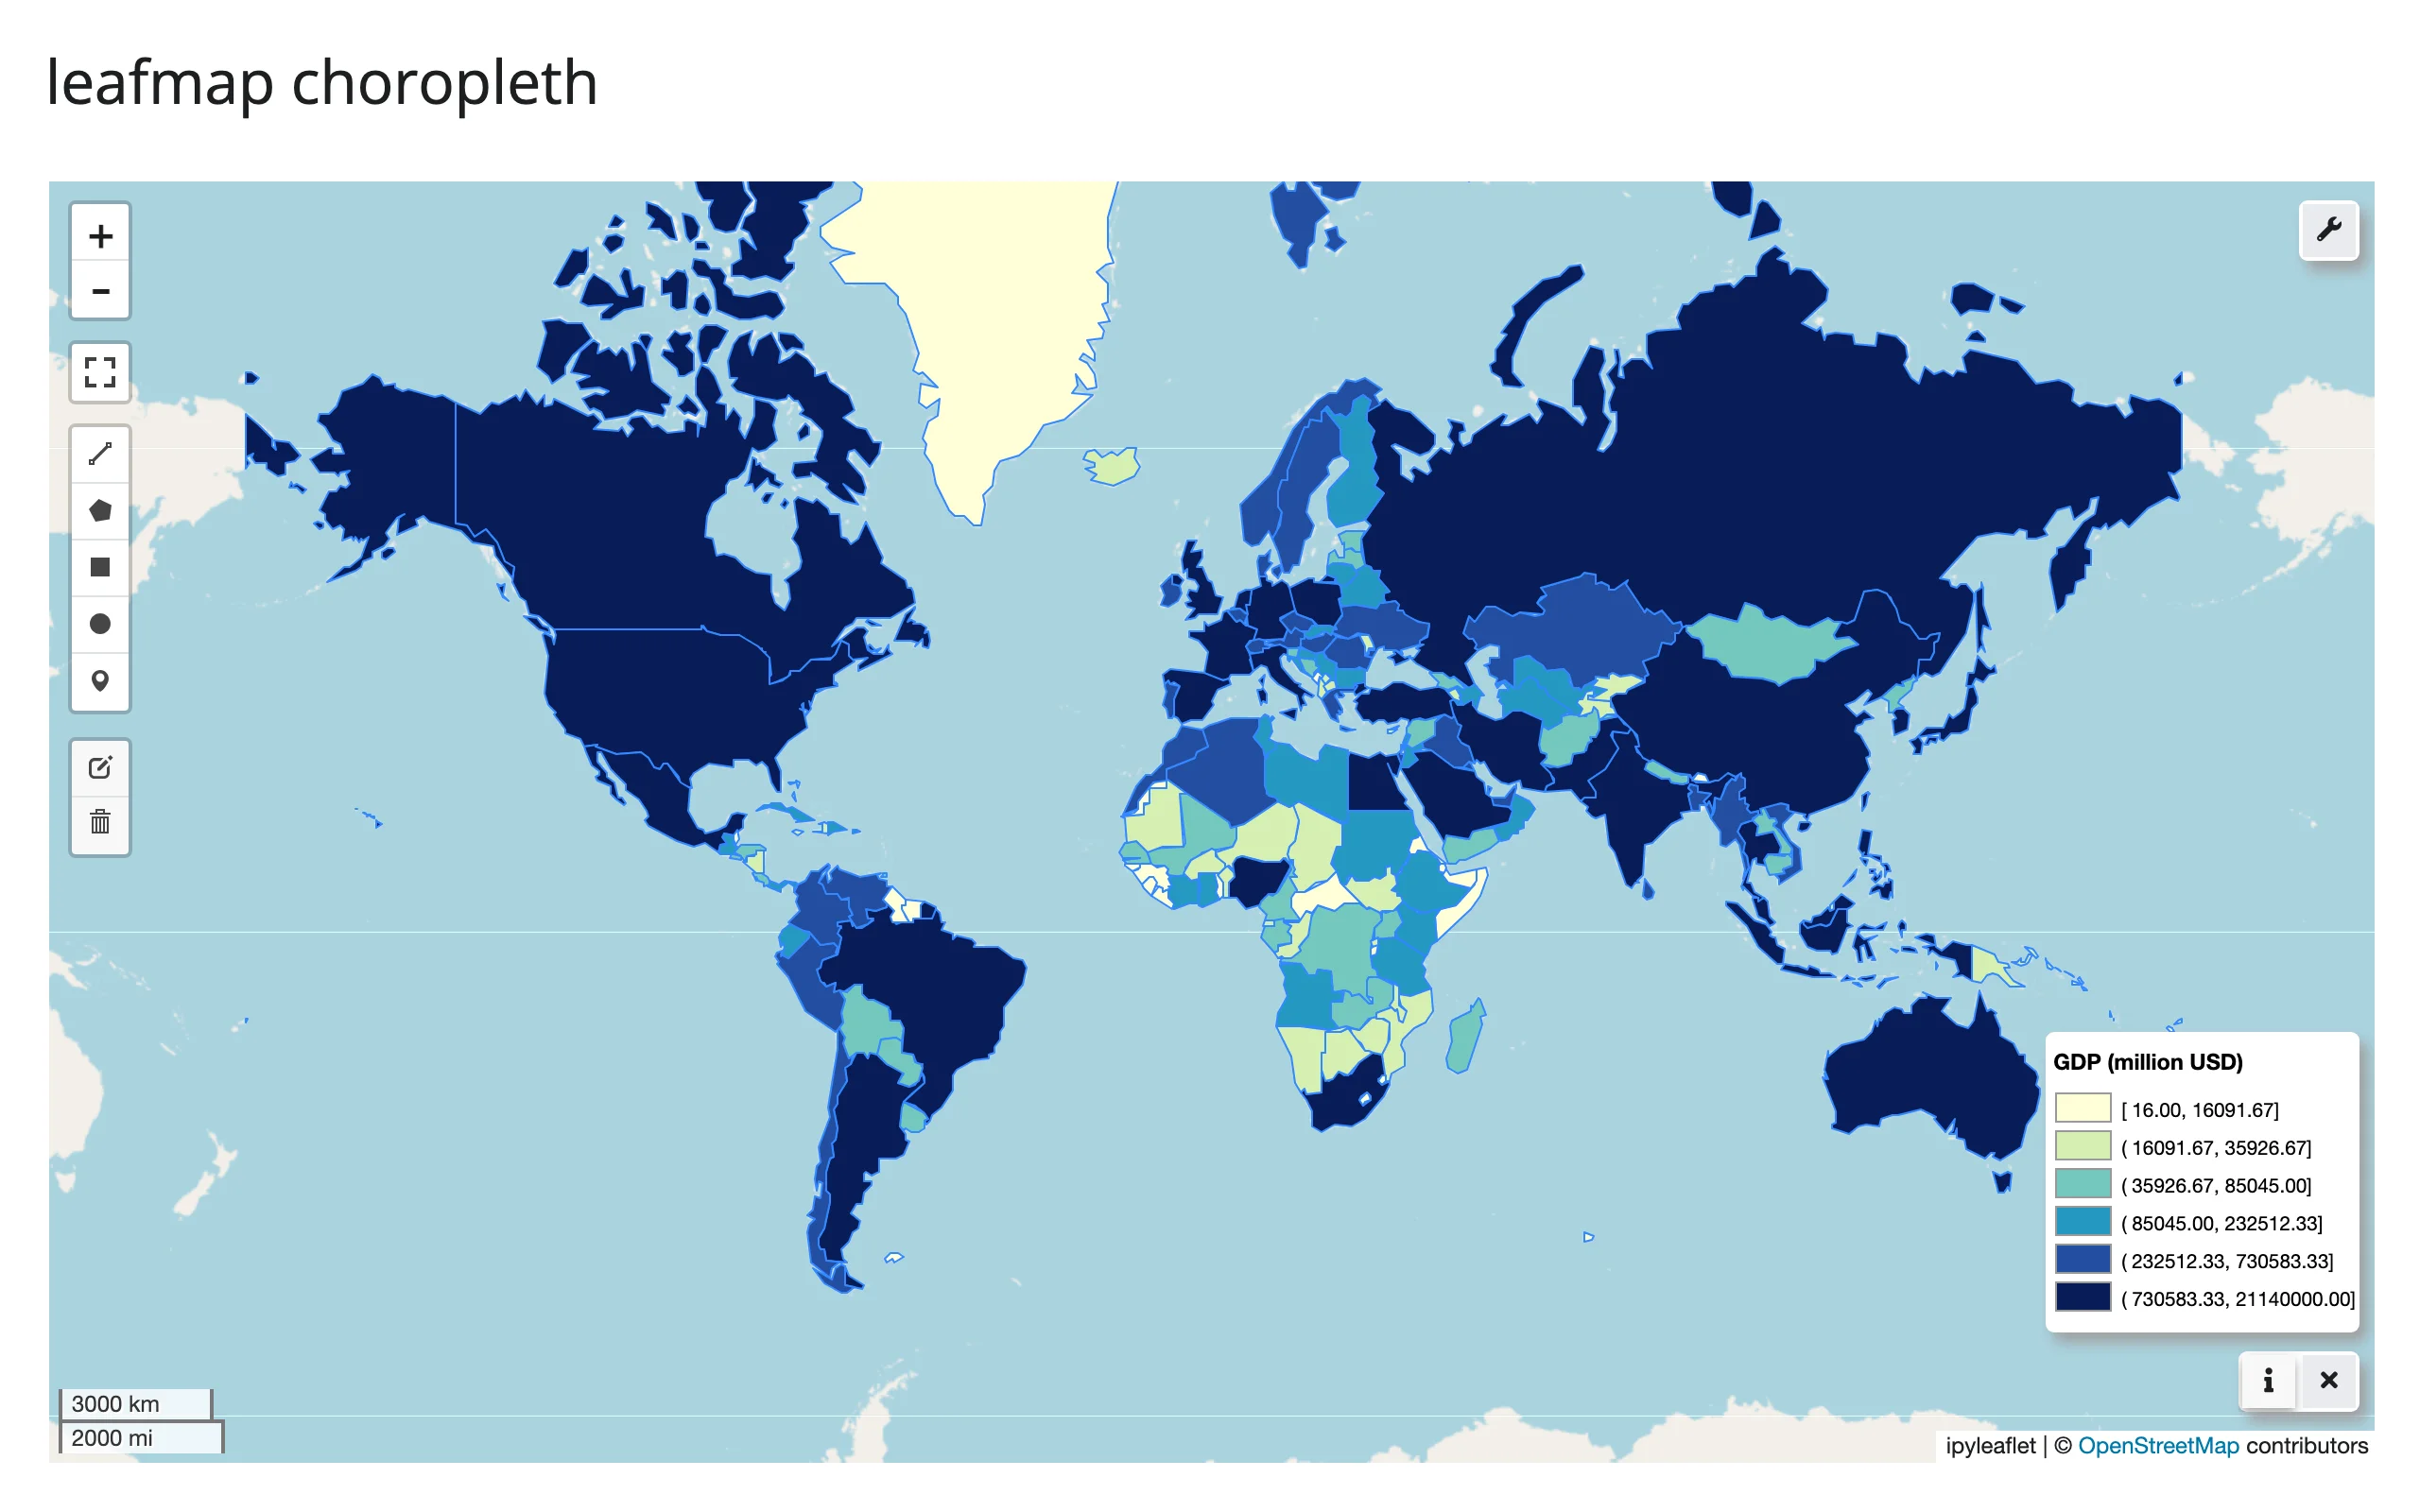
Local rasters and COGs, deployment-safe
add_raster() serves a local GeoTIFF (ideally a Cloud-Optimized GeoTIFF) as slippy-map tiles via localtileserver, with band selection, a colormap, and value rescaling, all without you running a tile server yourself. Pass a str path – a pathlib.Path raises (see Gotchas). shinywidgets automatically mounts a reverse proxy for localtileserver’s tiles, so this also works once the app is deployed; see ../localtileserver/guide.md for that mechanism and add_cog_layer() for remote, already-tiled COGs via a titiler endpoint instead of a local file.
# A synthetic elevation raster is written to a local Cloud-Optimized GeoTIFF at
# startup; leafmap's add_raster() serves it with localtileserver, and
# shinywidgets' loopback proxy makes the tile requests work even when the app
# is deployed (see ../../localtileserver/guide.md). Needs leafmap's raster
# extra (pip install 'leafmap[raster]') plus rioxarray and scipy to generate
# the sample data: `uv run --with rioxarray,scipy shiny run 05_raster_cog.py`.
import tempfile
from pathlib import Path

import leafmap
import numpy as np
import rioxarray  # noqa: F401  (registers the .rio accessor)
import xarray as xr
from scipy.ndimage import zoom
from shiny.express import ui
from shinywidgets import render_leafmap


def make_terrain_cog(path: Path, n: int = 600) -> None:
    rng = np.random.default_rng(7)
    elev = np.zeros((n, n), dtype=np.float32)
    for octave in range(6):  # fBm: stack smoothed noise at doubling frequencies
        k = 3 * 2**octave
        elev += zoom(rng.normal(0, 1, (k, k)).astype(np.float32), n / k, order=3)[
            :n, :n
        ] * (400 / 2**octave)
    elev = np.clip(elev - elev.min(), 0, None)
    ys = np.linspace(47.75, 47.45, n)
    xs = np.linspace(-122.5, -122.15, n)
    da = xr.DataArray(elev, dims=("y", "x"), coords={"y": ys, "x": xs})
    da.rio.set_spatial_dims(x_dim="x", y_dim="y", inplace=True)
    da.rio.write_crs("EPSG:4326", inplace=True)
    da.rio.to_raster(path, driver="COG", compress="deflate")


COG = Path(tempfile.gettempdir()) / "shinywidgets_leafmap_terrain.tif"
if not COG.exists():
    make_terrain_cog(COG)

ui.page_opts(title="leafmap local raster", fillable=True)


@render_leafmap
def map():
    m = leafmap.Map(center=(47.6, -122.33), zoom=12)
    # zoom_to_layer=False keeps the view above; True (the default) refits to
    # the raster's bounds, which is usually what you want for a first render
    m.add_raster(
        str(COG), colormap="terrain", layer_name="Elevation", zoom_to_layer=False
    )
    return m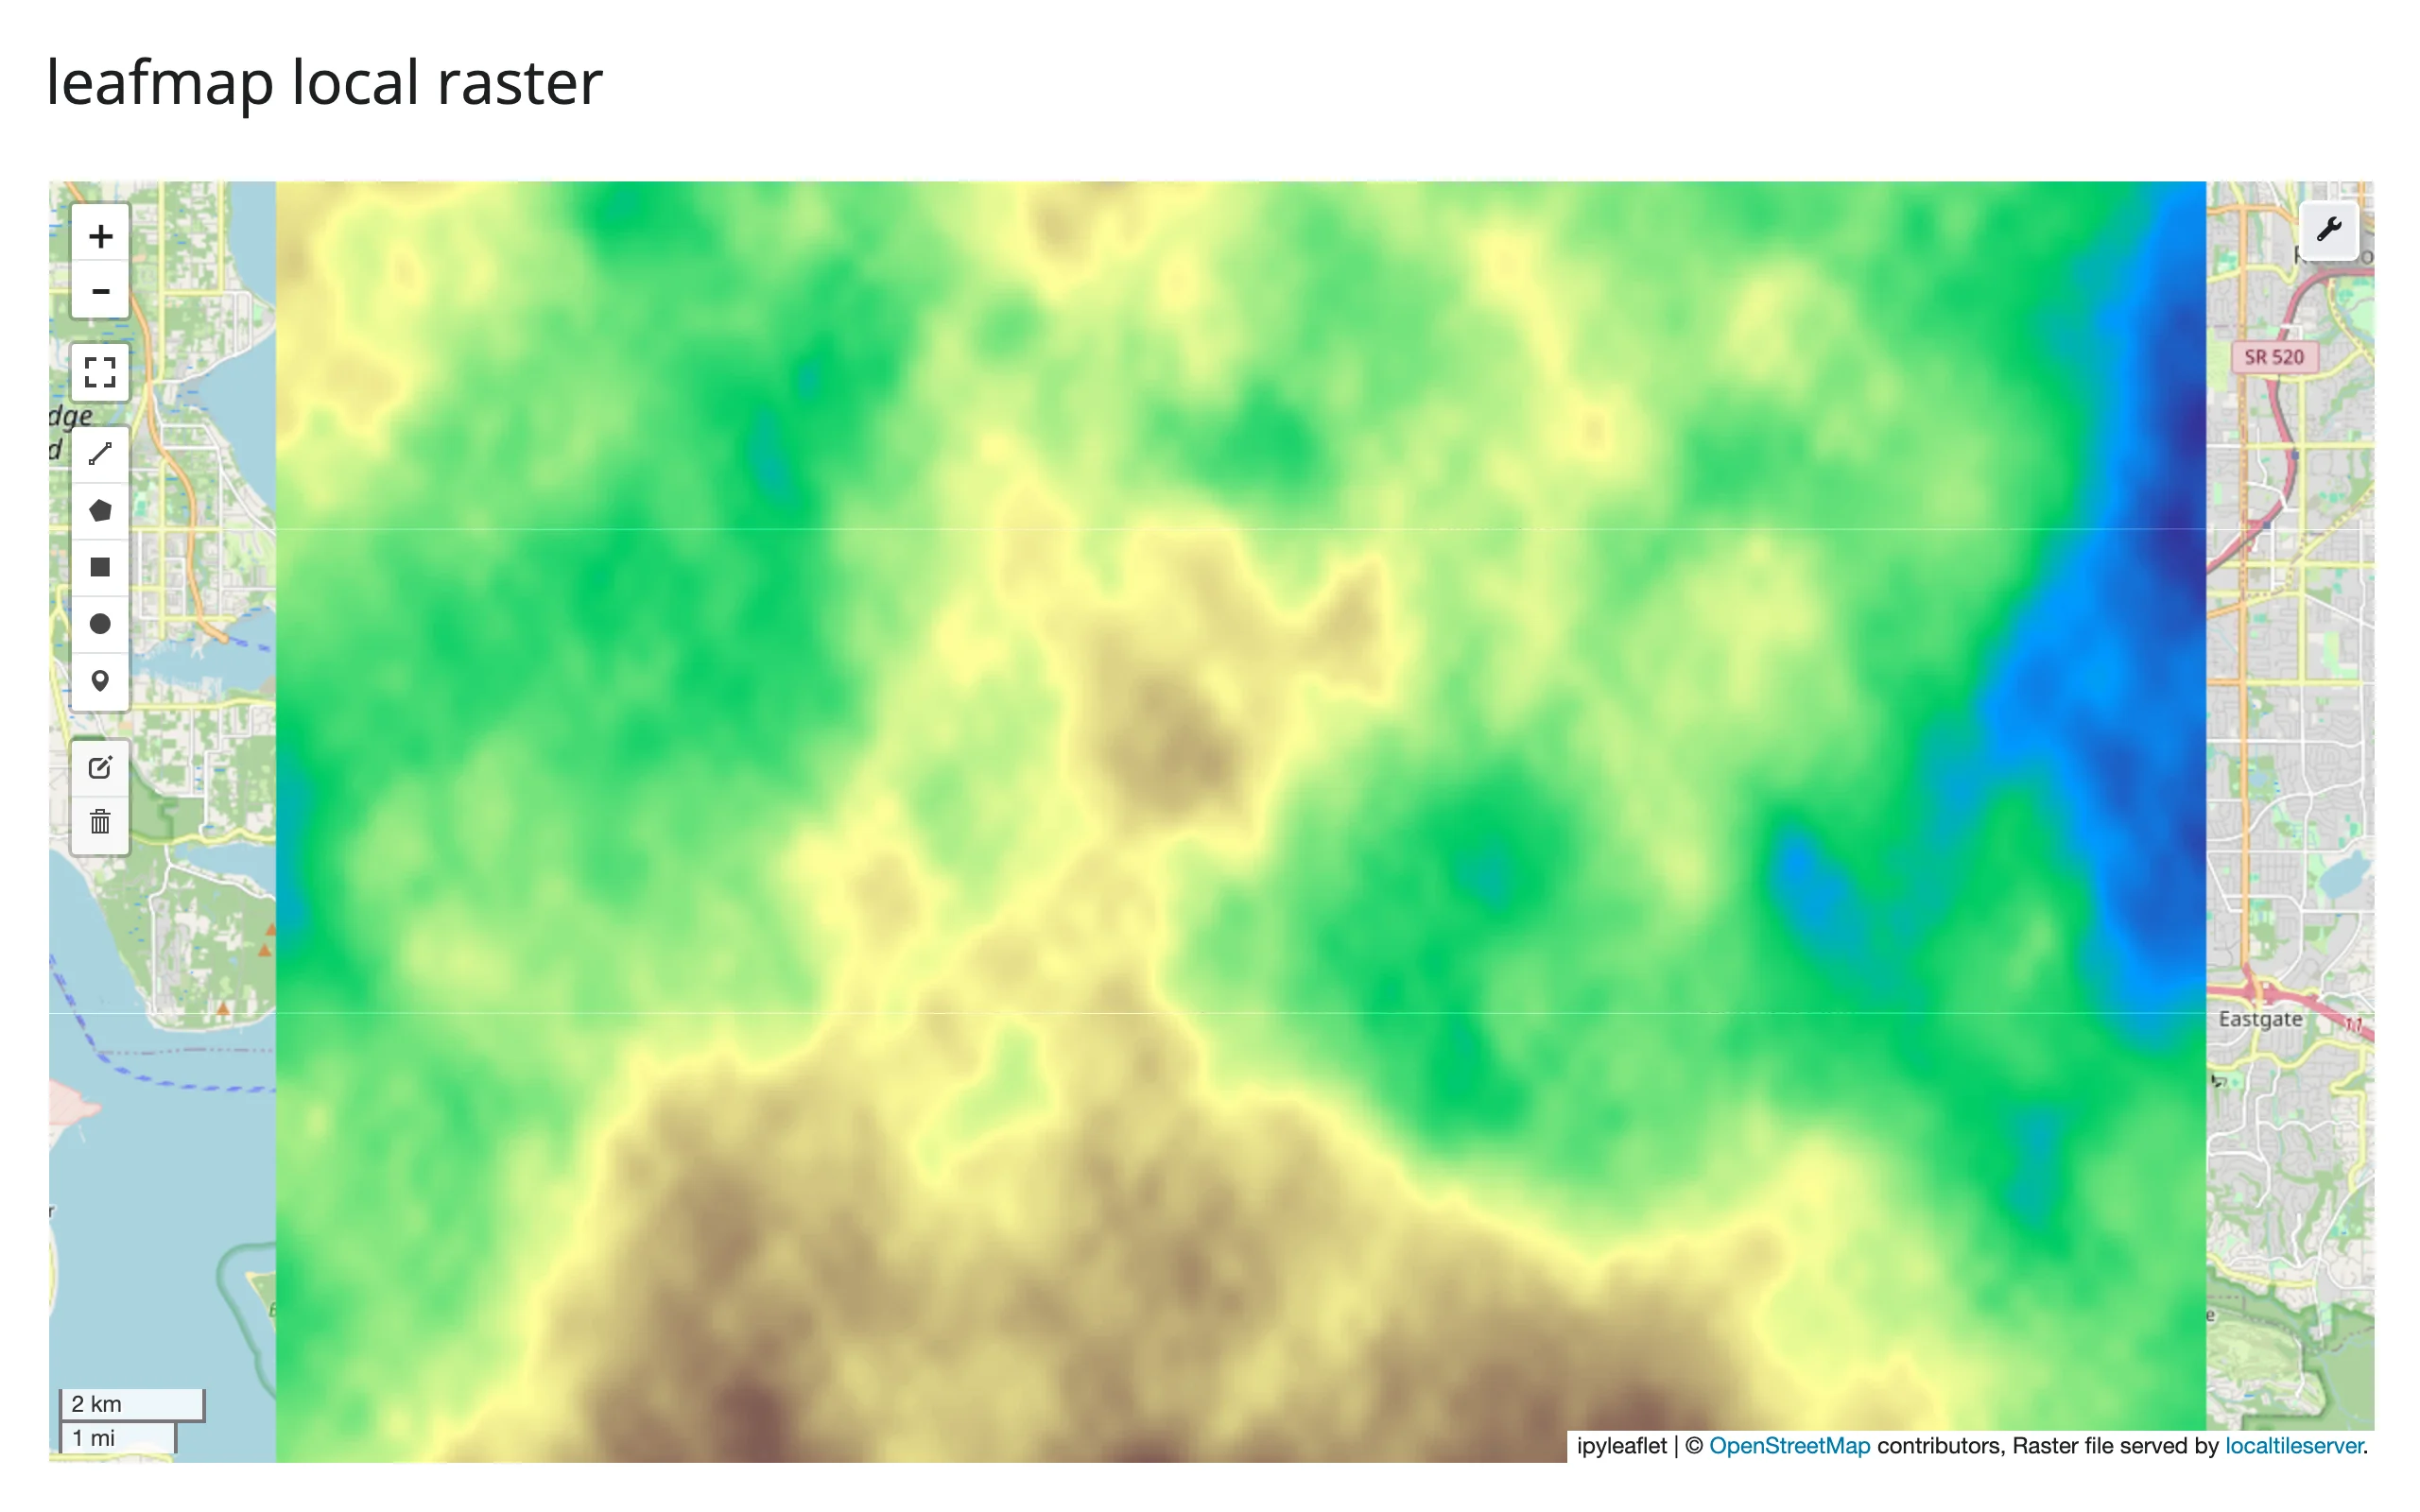
Split-panel comparisons
split_map() divides the existing map into two synced, draggable panes – before/after imagery, two basemaps, or two time periods – with no second widget to manage.
import leafmap
from shiny.express import ui
from shinywidgets import render_leafmap

ui.page_opts(title="leafmap split map", fillable=True)


@render_leafmap
def map():
    m = leafmap.Map(center=(37.75, -119.58), zoom=11)  # Yosemite Valley
    # split_map() divides the existing map into two synced panes with a
    # draggable divider -- handy for before/after imagery or basemap compares
    m.split_map(
        left_layer="Esri.WorldImagery",
        right_layer="USGS.USTopo",
        left_label="Satellite",
        right_label="USGS Topo",
    )
    return m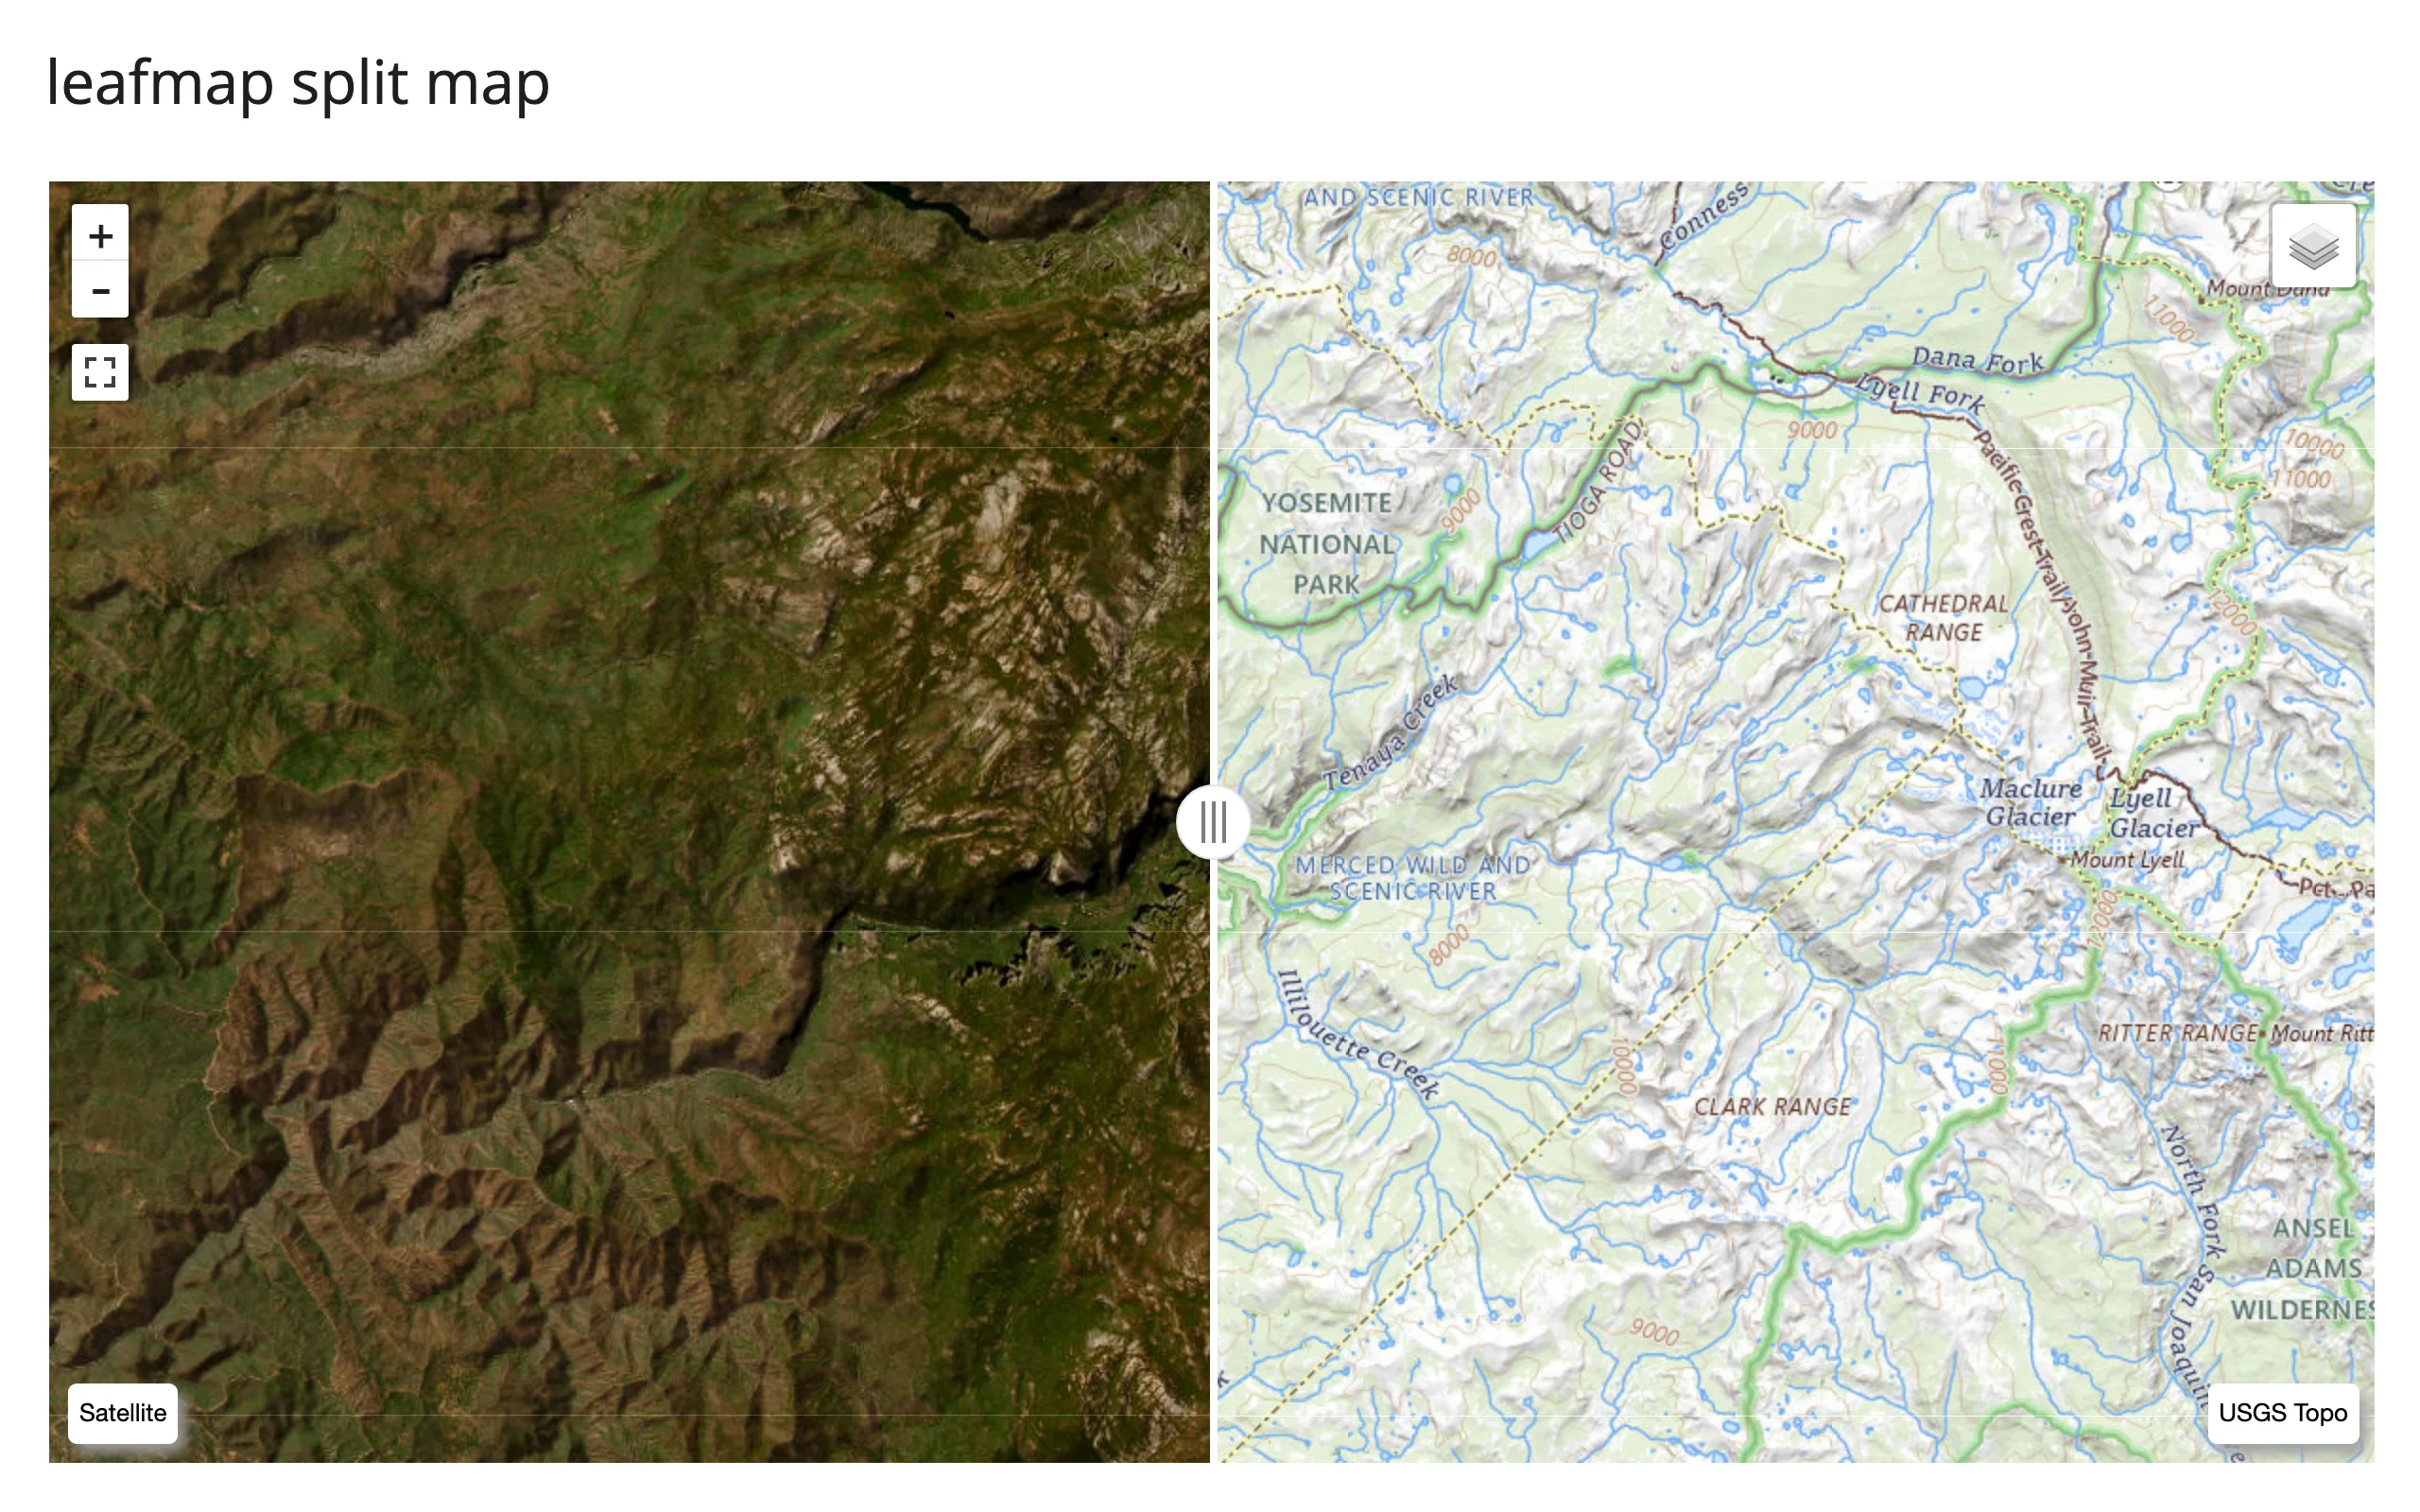
leafmap also has add_legend()/add_colorbar() for bespoke (non-choropleth) legends, add_time_slider() / add_gdf_time_slider() for animating a sequence of layers, and the toolbar’s basemap gallery and inspector tools accessible from the map with zero app code – see Learn more for the upstream docs on these; the AOI workbench in Gallery candidates below exercises add_colorbar() on a live raster.
Reacting to user interaction
Accessor reference
These five methods are available on the ipyleaflet backend only (leafmap.Map(), the default). They are the exact same accessors documented in ../ipyleaflet/guide.md, since leafmap’s default backend is an ipyleaflet.Map.
Every accessor attaches the moment the map renders and records what the user does whether or not anything has read it yet – a click, pan, or drawn shape that happens before the first read still shows up in it.
| Accessor | Returns | Before any interaction | Across re-render | Rate policy |
|---|---|---|---|---|
bounds() |
((south, west), (north, east)) |
Cancels (no output) until the browser’s first report | Re-seeded; cancels again until the new map reports | Not rate-limited |
zoom() |
float |
Seeded (the map’s own .zoom) |
Re-seeded from the new map | Not rate-limited |
center() |
[lat, lng] |
Seeded (the map’s own .center) |
Re-seeded from the new map | Not rate-limited |
clicked() |
{"coordinates": [lat, lng], ...} or None |
None until the first click |
Kept until the user clicks the new map | Not rate-limited |
drawn_features() |
list[GeoJSON Feature] |
[] until something is drawn |
Re-seeded ([] for a fresh DrawControl) |
Not rate-limited |
Coordinates are [lat, lng] throughout, matching ipyleaflet (lonboard and the maplibre backend below use (lng, lat)). None of the five accessors are rate-limited by default, and none benefit from rate_policy/ rate_delay either – each only fires once per completed gesture (confirmed in ../ipyleaflet/guide.md’s rate-limiting section). You would still reach for rate_policy/rate_delay on a reactive_read() of a trait that streams many updates per gesture, such as a raw marker’s location while it’s being dragged – see that guide’s example. bounds()/zoom()/center()/ drawn_features() describe the map’s own state, so a re-render re-seeds them from the fresh map; clicked() is something the user did, not something the map owns, so it’s kept until the user clicks the new map – the same behavior documented (and verified with a real re-render gesture) in ../ipyleaflet/guide.md, since this is the identical accessor code.
bounds(): driving a chart from the viewport
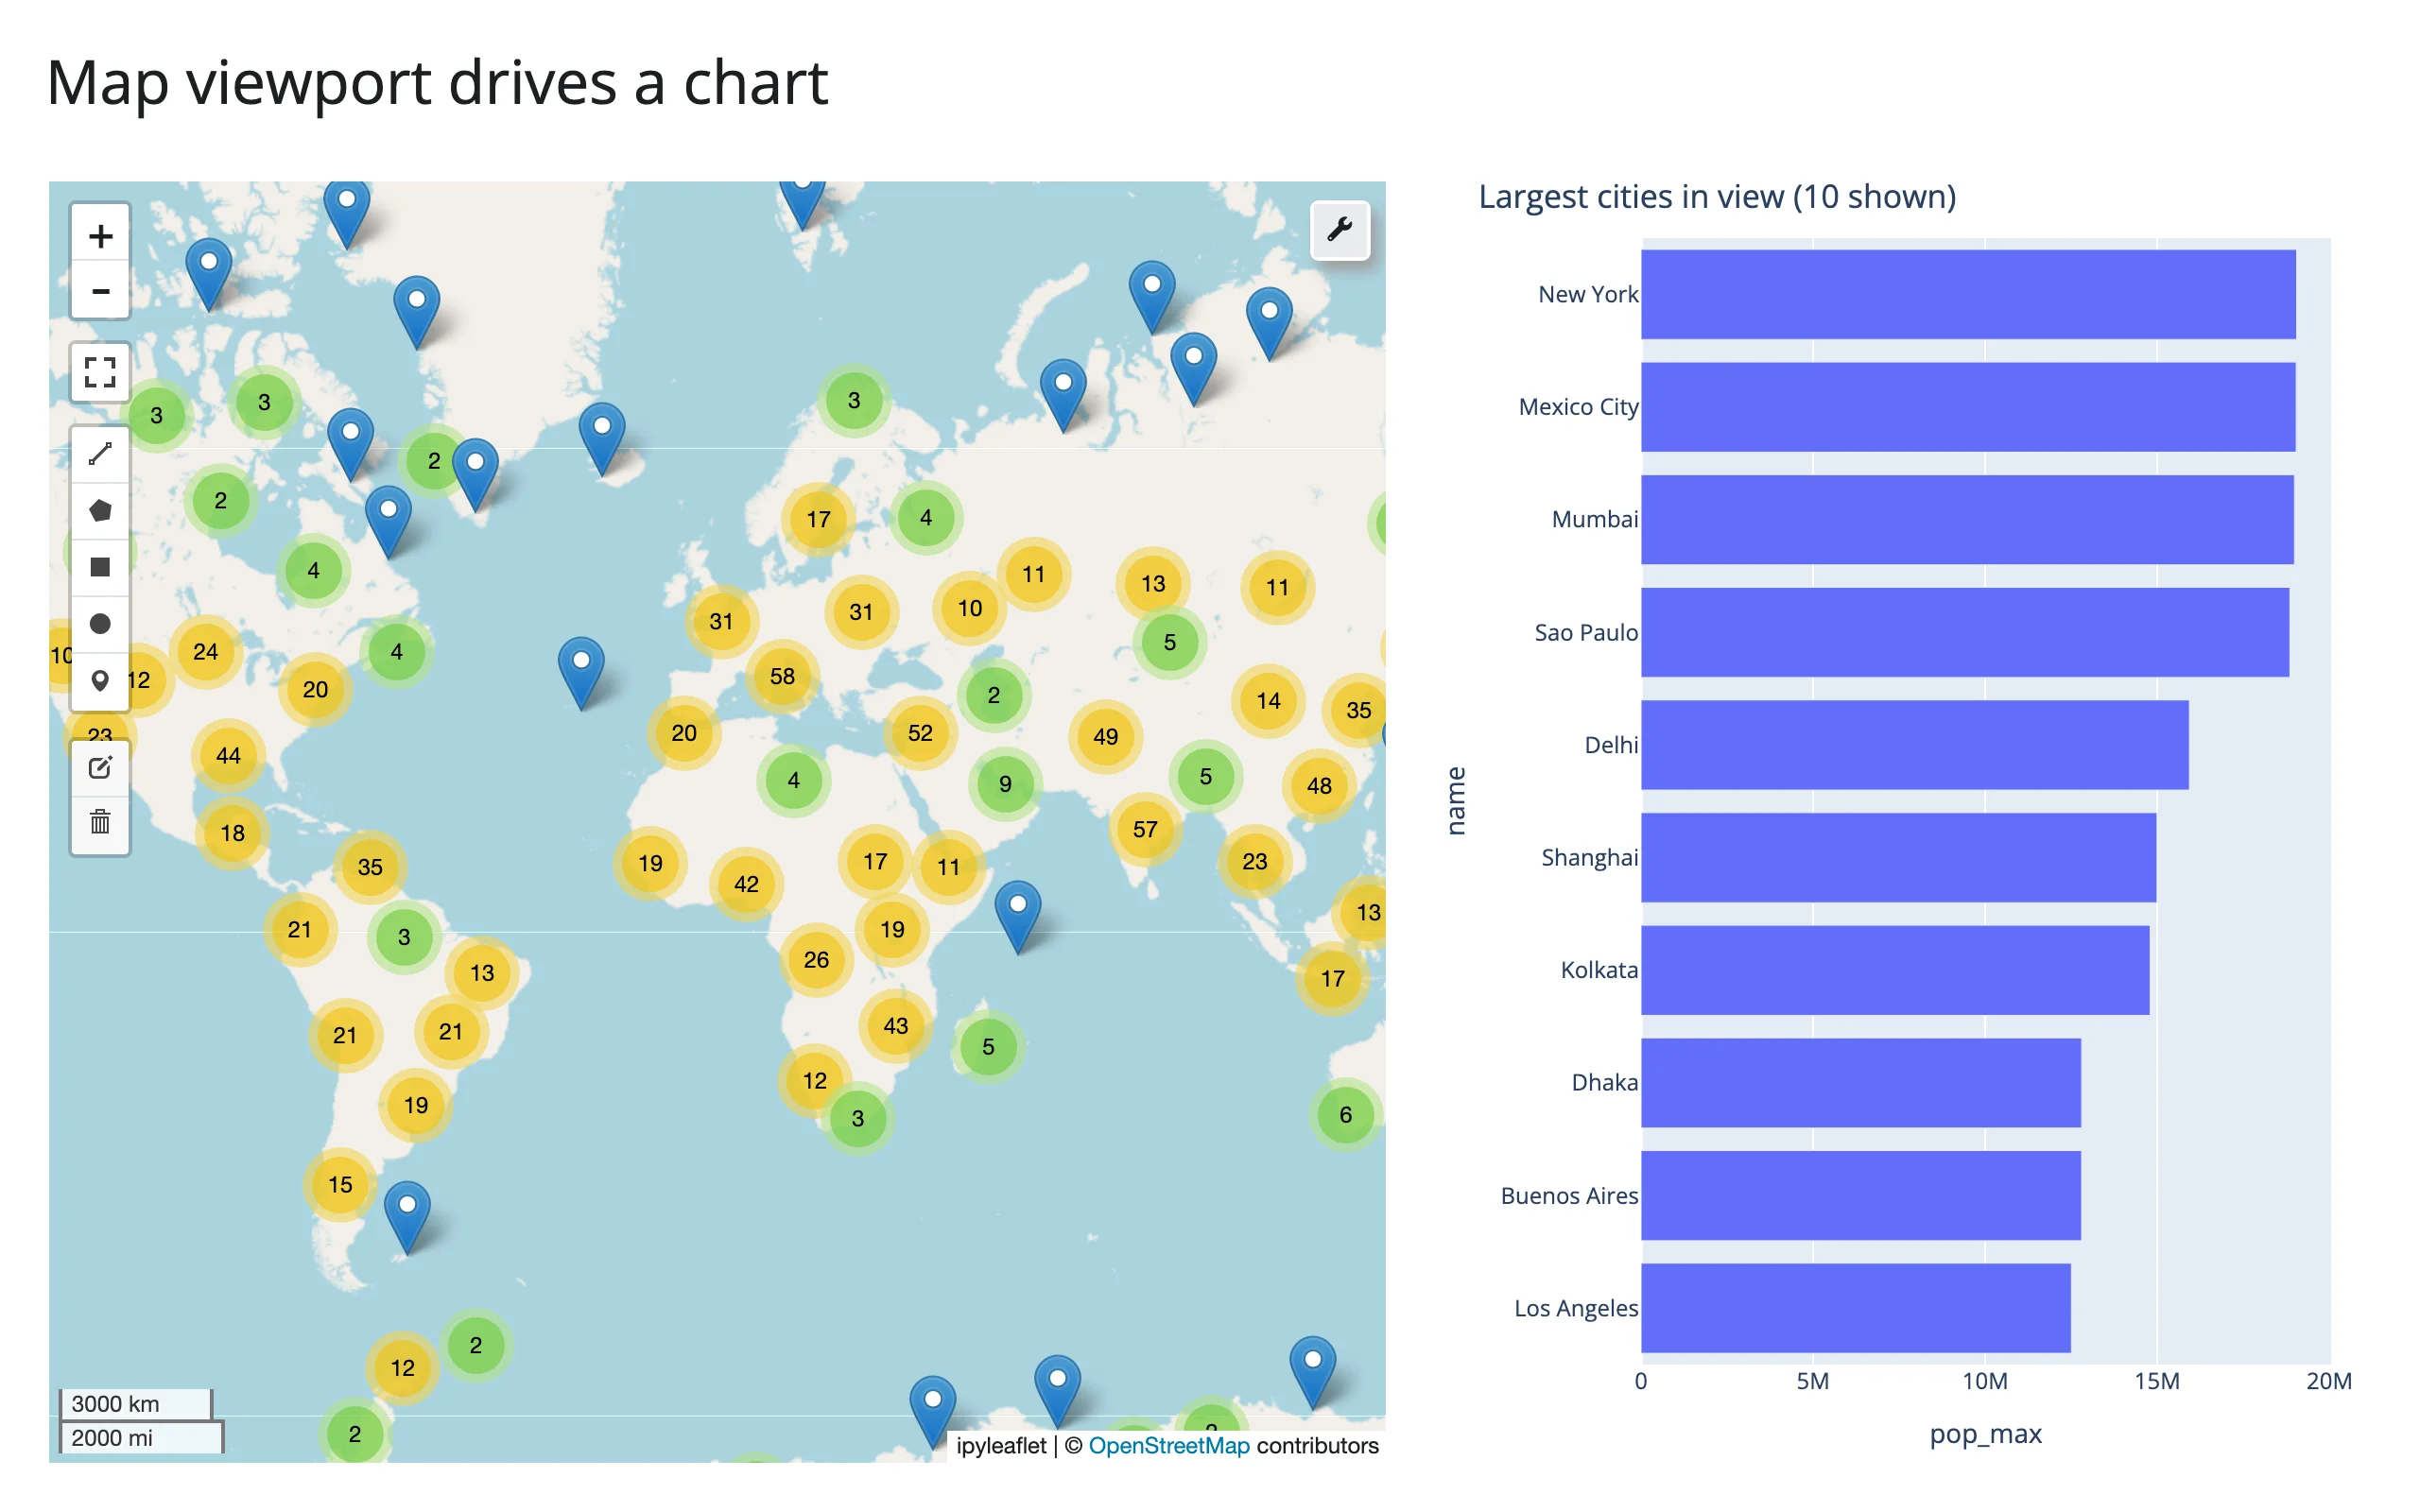
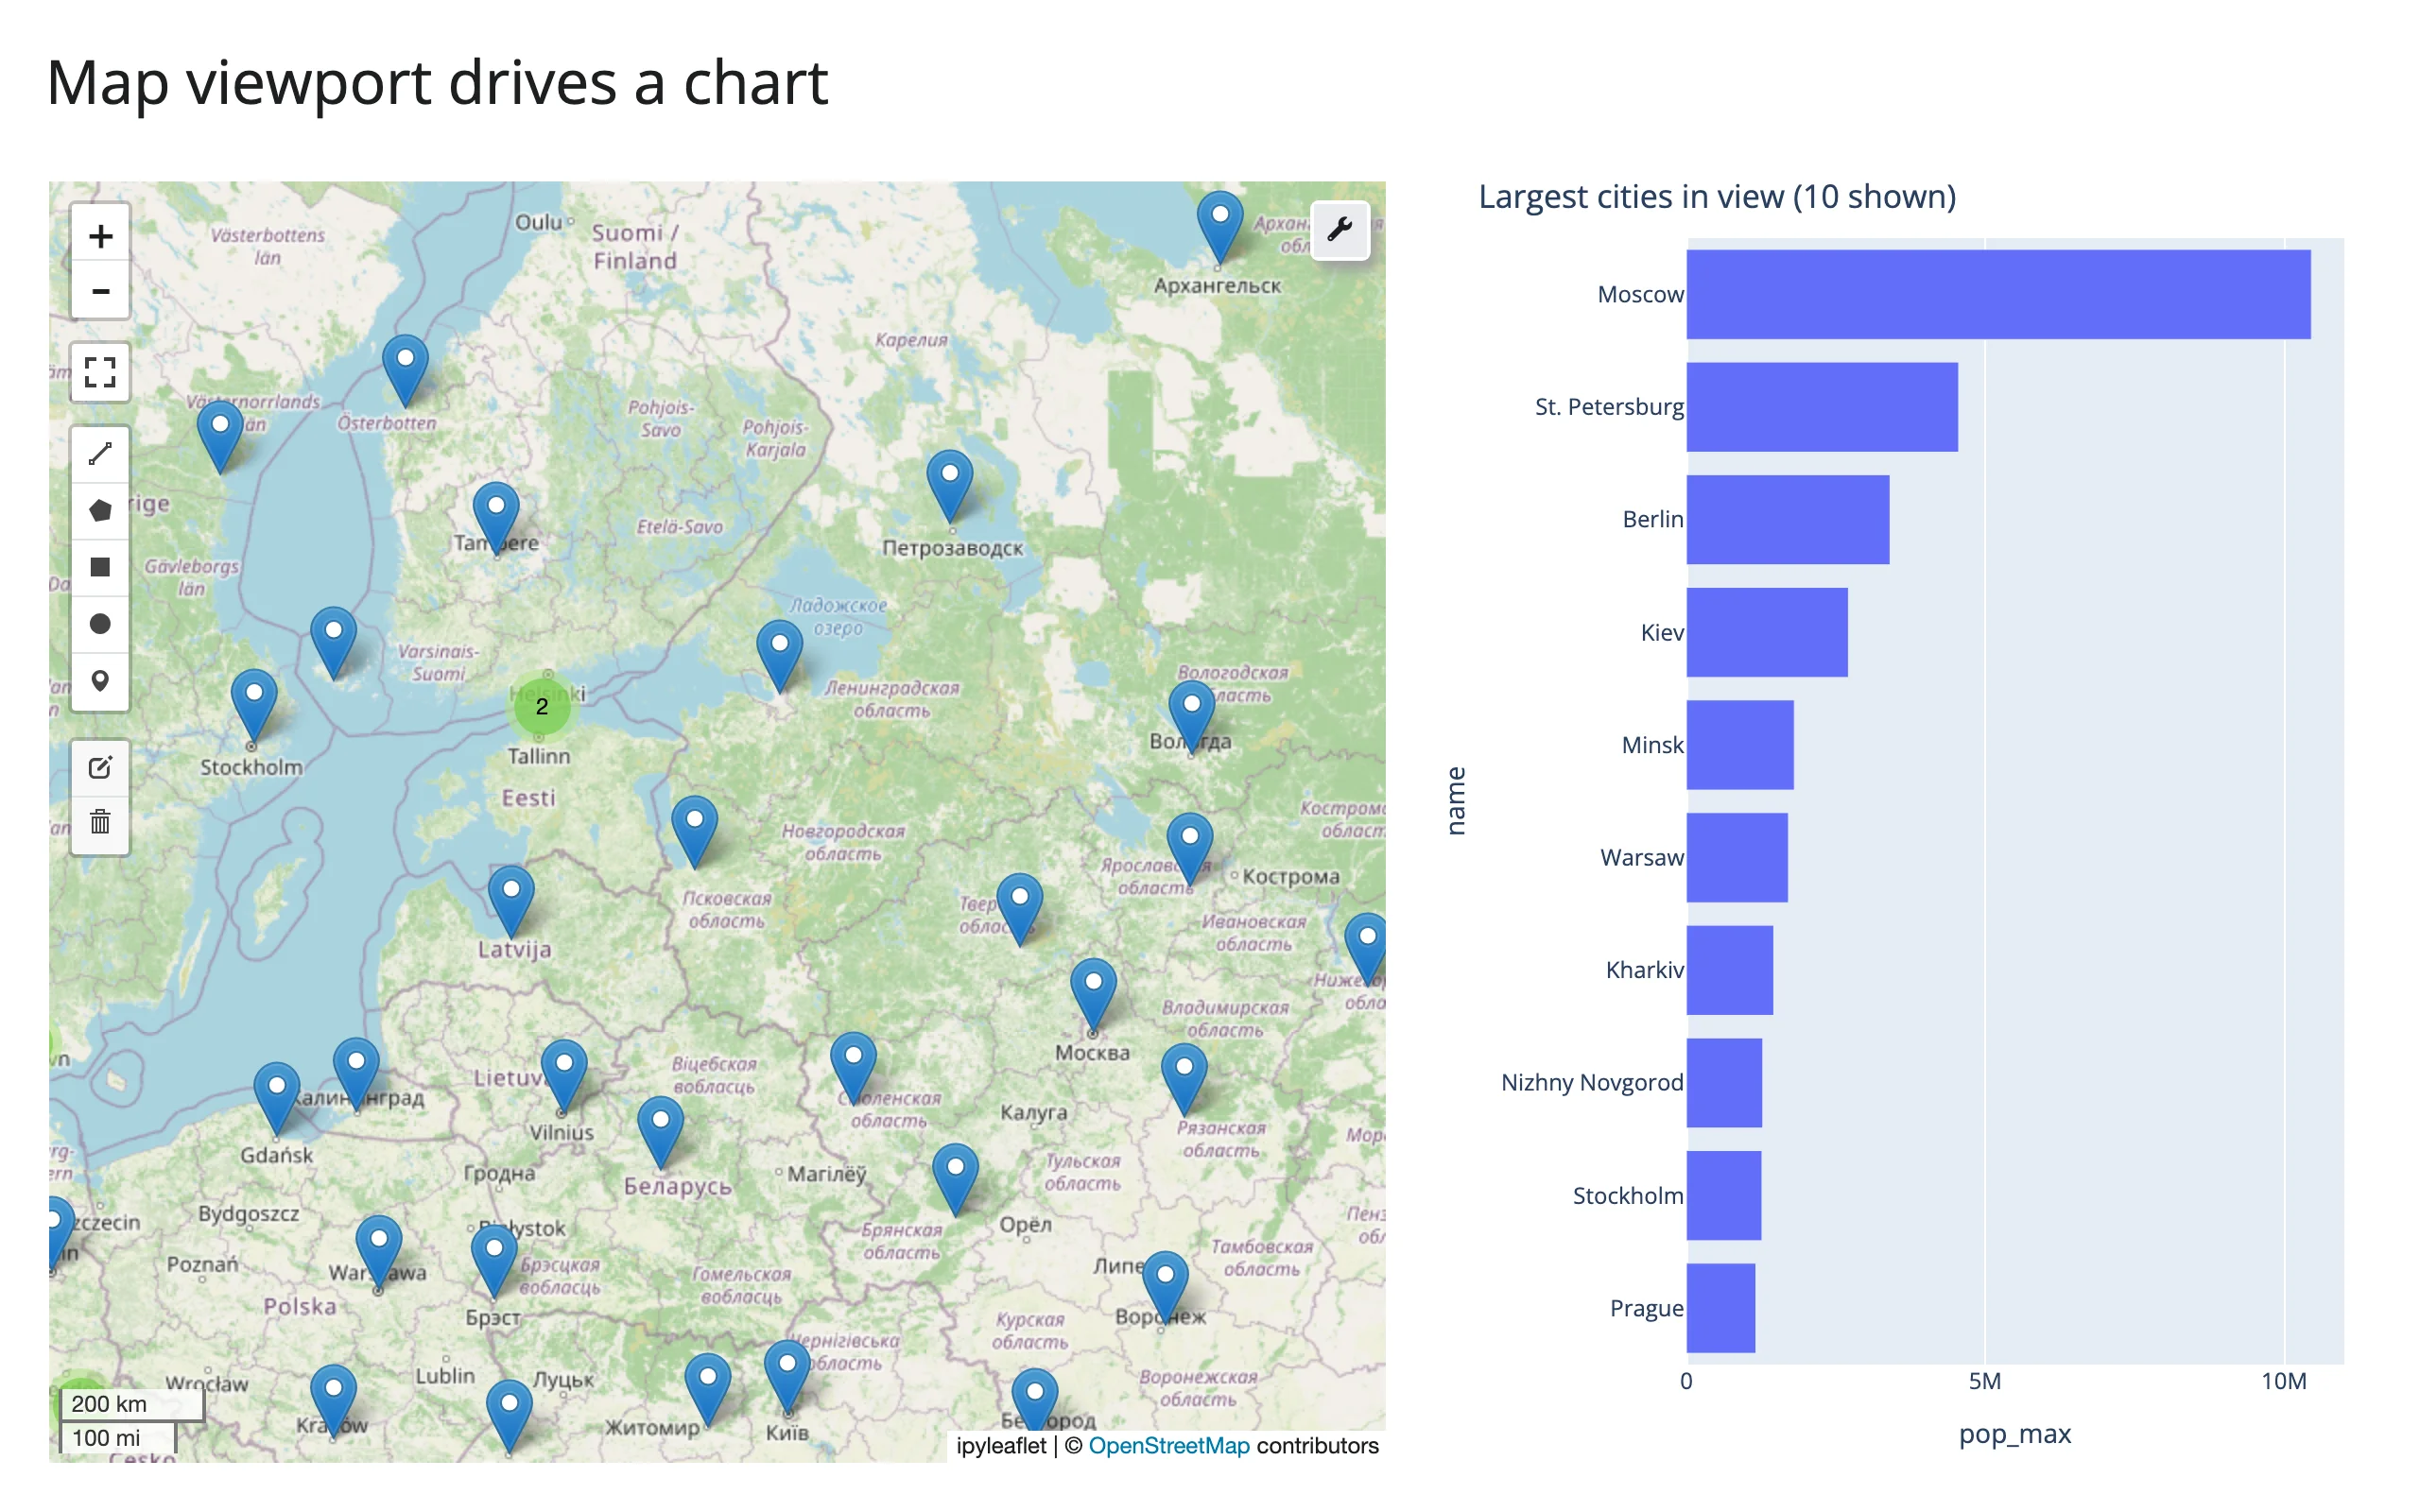
The map’s visible area is reactive state: pan or zoom, and anything reading bounds() recomputes. Here, a bar chart tracks the most populous cities currently on screen.
# Needs: pip install 'shinywidgets[leafmap,plotly]' pandas, or
# `uv run --with pandas,plotly shiny run 07_bounds_viewport_chart.py`.
import leafmap
import pandas as pd
import plotly.express as px
from shiny.express import ui
from shinywidgets import render_leafmap, render_plotly

CITIES = pd.read_csv(
    "https://raw.githubusercontent.com/opengeos/leafmap/master/examples/data/world_cities.csv"
)

ui.page_opts(title="Map viewport drives a chart", fillable=True)

with ui.layout_columns(col_widths=(7, 5)):

    @render_leafmap
    def map():
        m = leafmap.Map(center=(20, 0), zoom=2)
        m.add_points_from_xy(
            CITIES,
            x="longitude",
            y="latitude",
            layer_name="Cities",
            max_cluster_radius=40,
        )
        return m

    @render_plotly
    def top_cities():
        # map.bounds() is ((south, west), (north, east)); it cancels (renders
        # nothing) until the browser first reports a viewport
        (south, west), (north, east) = map.bounds()
        in_view = CITIES[
            CITIES.latitude.between(south, north) & CITIES.longitude.between(west, east)
        ].nlargest(10, "pop_max")
        return px.bar(
            in_view.sort_values("pop_max"),
            x="pop_max",
            y="name",
            orientation="h",
            title=f"Largest cities in view ({len(in_view)} shown)",
        )
Zoomed out, the world’s biggest cities lead the chart; zoom into a region and the chart narrows to what’s visible:
zoom() and center(): the live camera
Both read instantly and update on every pan/zoom gesture, or whenever Python sets .zoom/.center on .widget:
import leafmap
from shiny.express import render, ui
from shinywidgets import render_leafmap

ui.page_opts(title="leafmap zoom() and center()", fillable=True)

with ui.layout_columns(col_widths=(9, 3)):

    @render_leafmap
    def map():
        m = leafmap.Map(center=(47.62, -122.33), zoom=11)
        m.add_basemap("OpenTopoMap")
        return m

    with ui.card():
        ui.card_header("Live camera")

        @render.code
        def camera():
            # Both fire on every pan/zoom gesture and whenever Python sets
            # map.widget.zoom/center; neither is rate-limited
            lat, lng = map.center()
            return f"zoom:   {map.zoom():.1f}\ncenter: ({lat:.3f}, {lng:.3f})"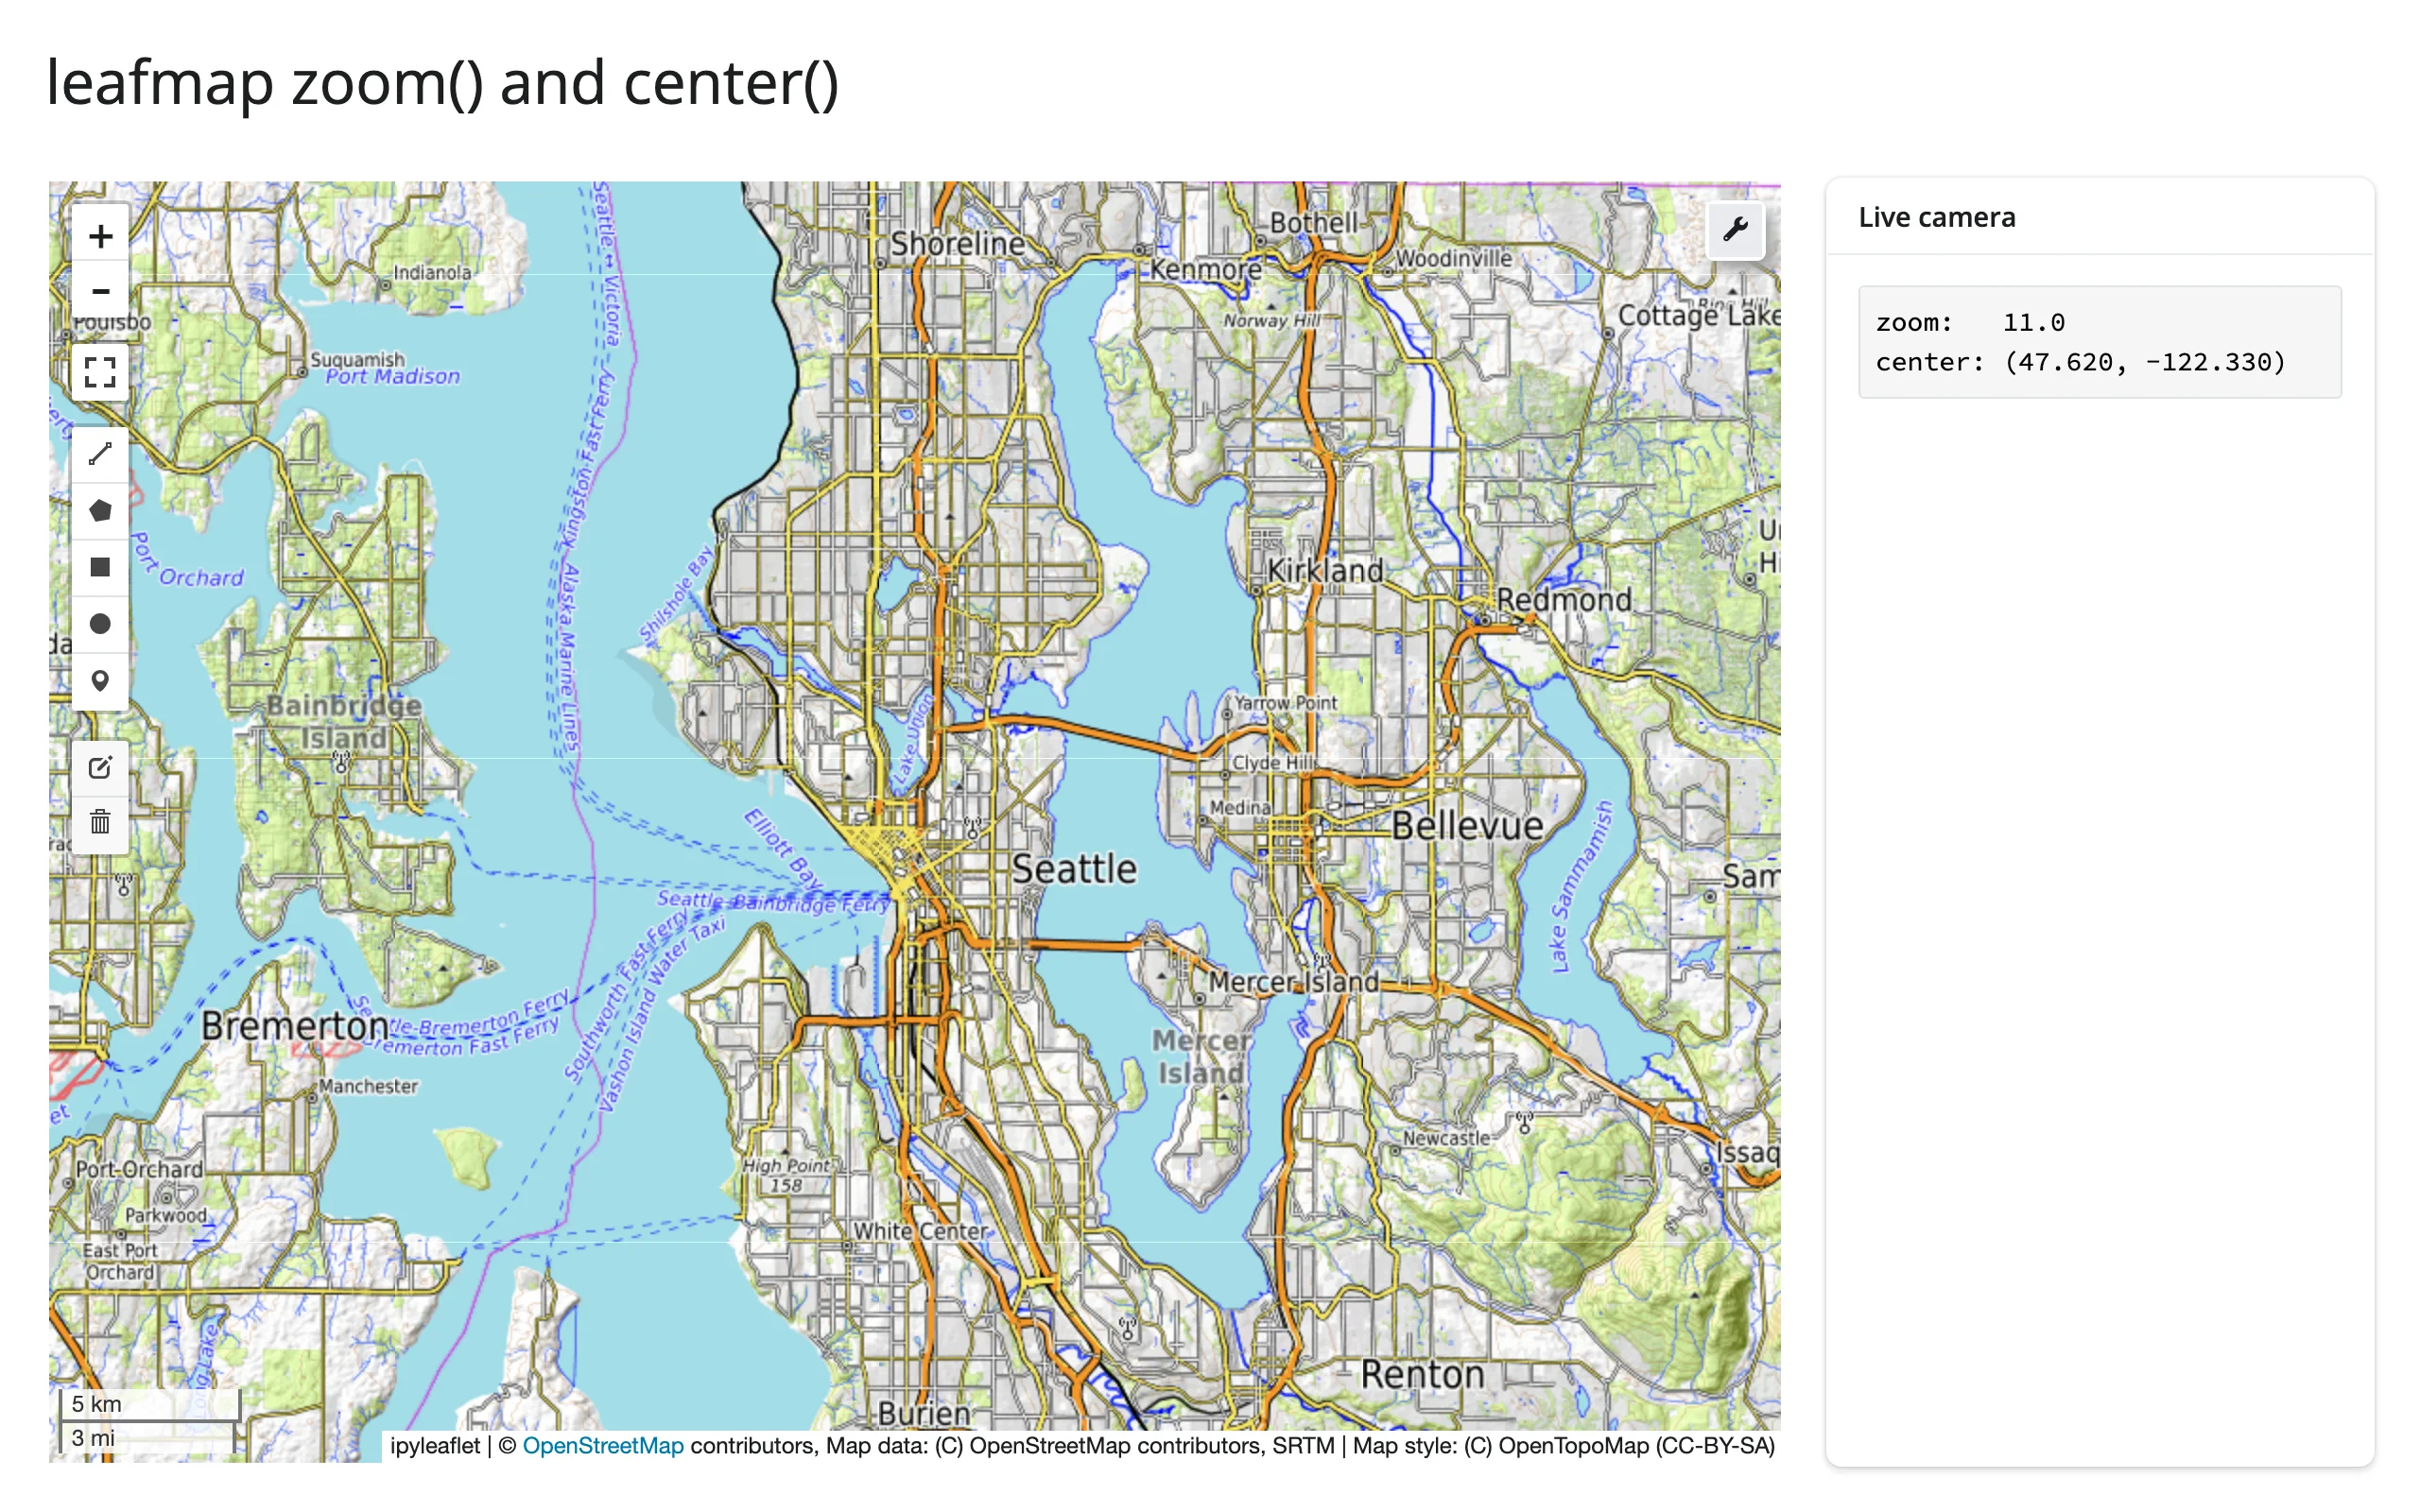
clicked(): click-to-detail
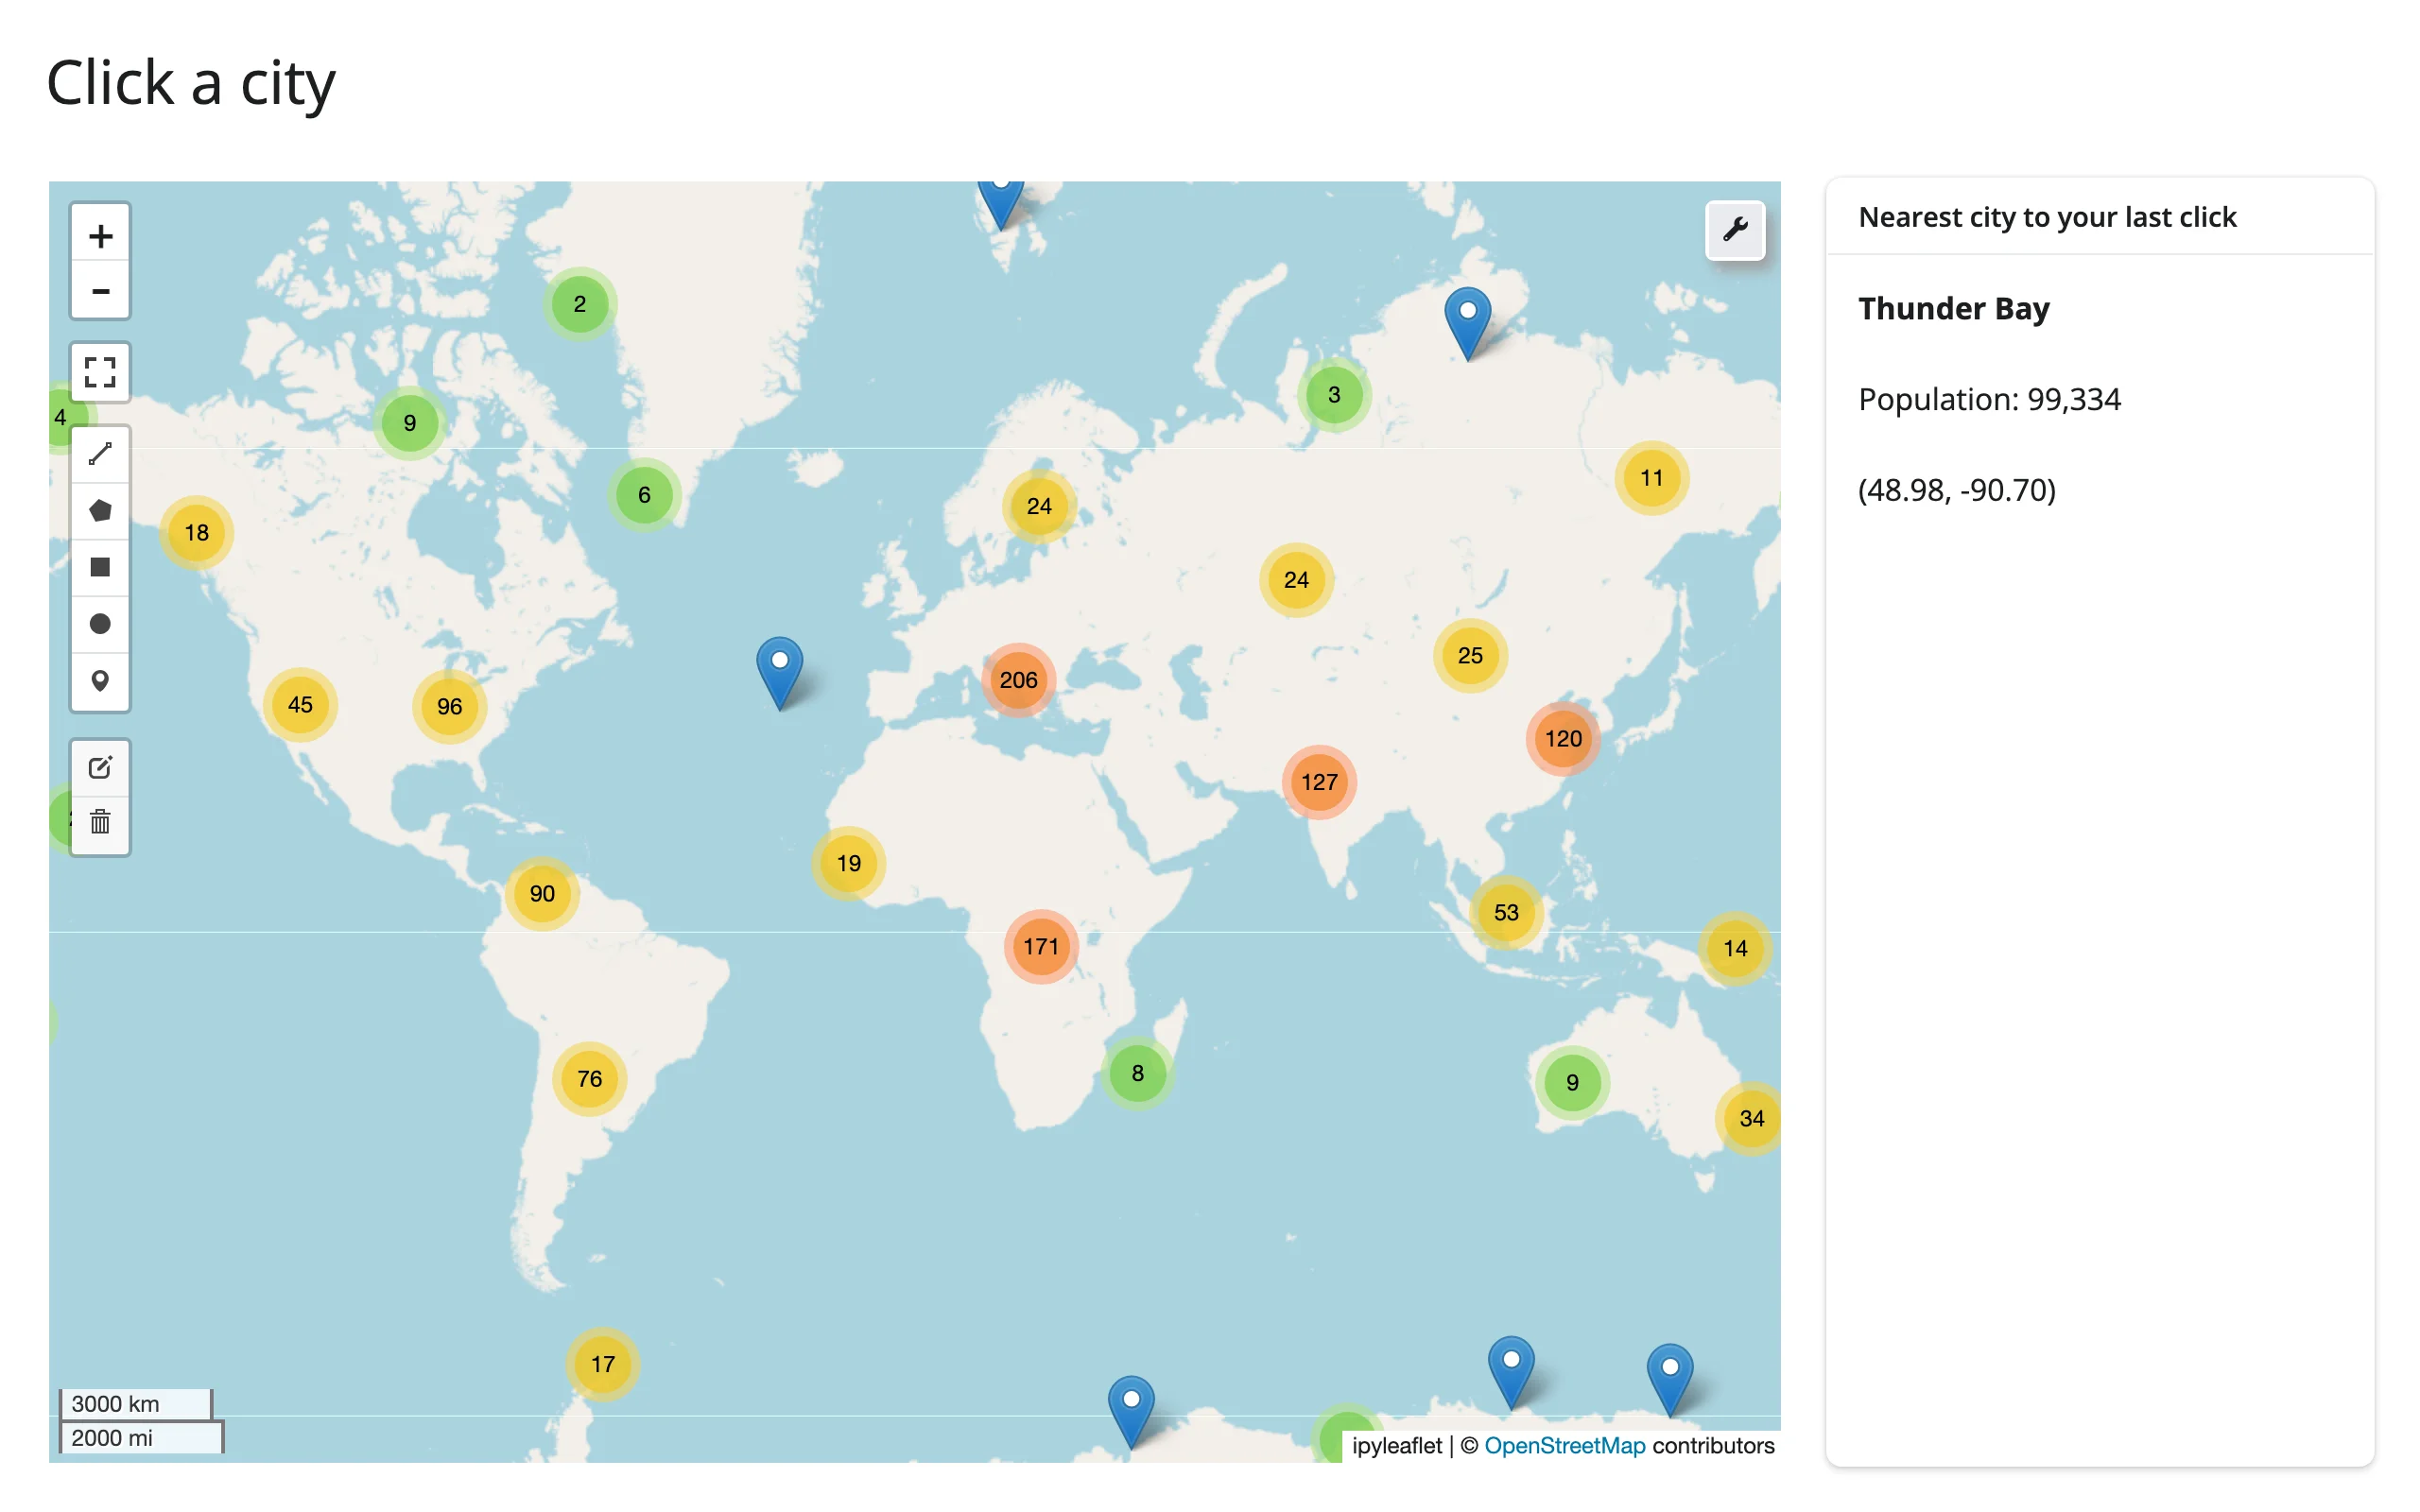
A click anywhere on the map (not on a marker – marker clicks don’t bubble up) updates clicked(), and the value is kept across a re-render until the user clicks the new map – so a detail card like the one below doesn’t flash back to empty just because something else on the page re-rendered the map. Pair it with your own nearest-neighbor lookup for a “click the map, see the nearest thing” pattern:
# Needs pandas: `uv run --with pandas shiny run 09_clicked_detail.py`.
import leafmap
import numpy as np
import pandas as pd
from shiny import req
from shiny.express import render, ui
from shinywidgets import render_leafmap

CITIES = pd.read_csv(
    "https://raw.githubusercontent.com/opengeos/leafmap/master/examples/data/world_cities.csv"
)

ui.page_opts(title="Click a city", fillable=True)

with ui.layout_columns(col_widths=(9, 3)):

    @render_leafmap
    def map():
        m = leafmap.Map(center=(20, 0), zoom=2)
        m.add_points_from_xy(CITIES, x="longitude", y="latitude", layer_name="Cities")
        return m

    with ui.card():
        ui.card_header("Nearest city to your last click")

        @render.express
        def detail():
            clicked = map.clicked()
            # req() returns its argument, and render.express treats every bare
            # top-level expression as UI, so assign it rather than leave it bare
            clicked = req(clicked)  # None until the first click
            lat, lng = clicked["coordinates"]
            d2 = (CITIES.latitude - lat) ** 2 + (CITIES.longitude - lng) ** 2
            city = CITIES.loc[np.argmin(d2)]
            ui.markdown(f"**{city['name']}**")
            ui.div(f"Population: {city['pop_max']:,}")
            ui.div(f"({lat:.2f}, {lng:.2f})")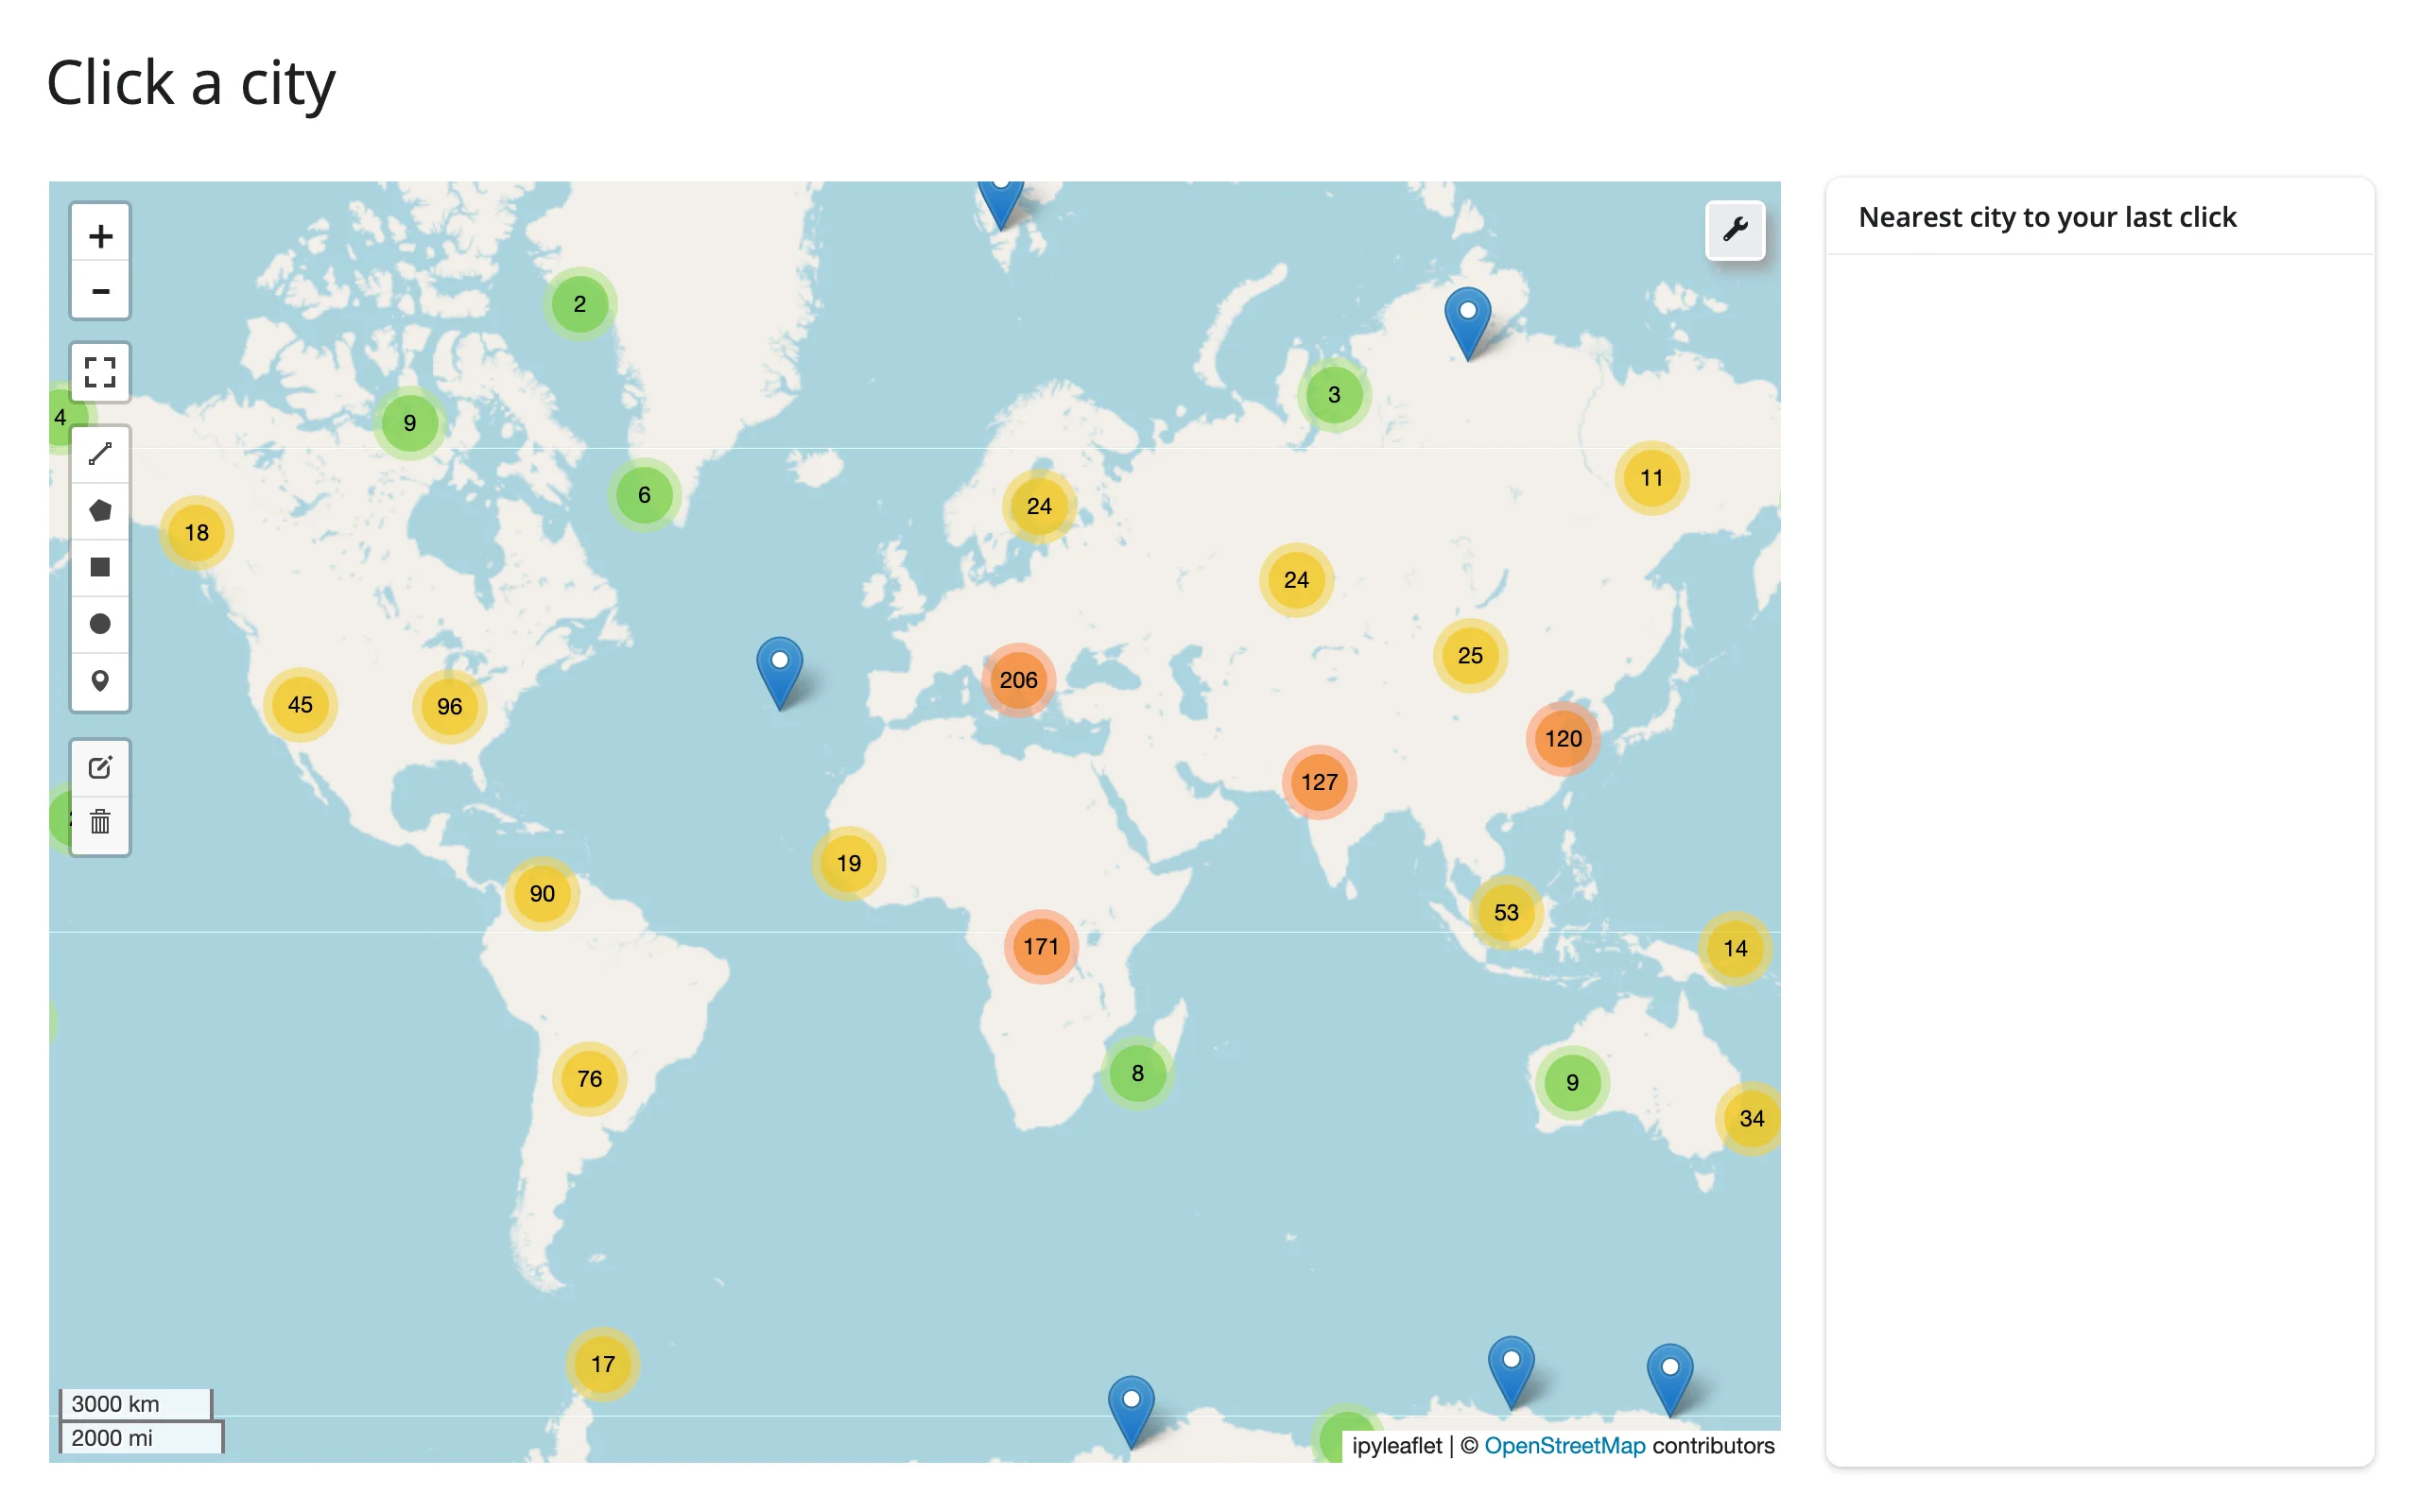
drawn_features(): the GIS-analyst workflow
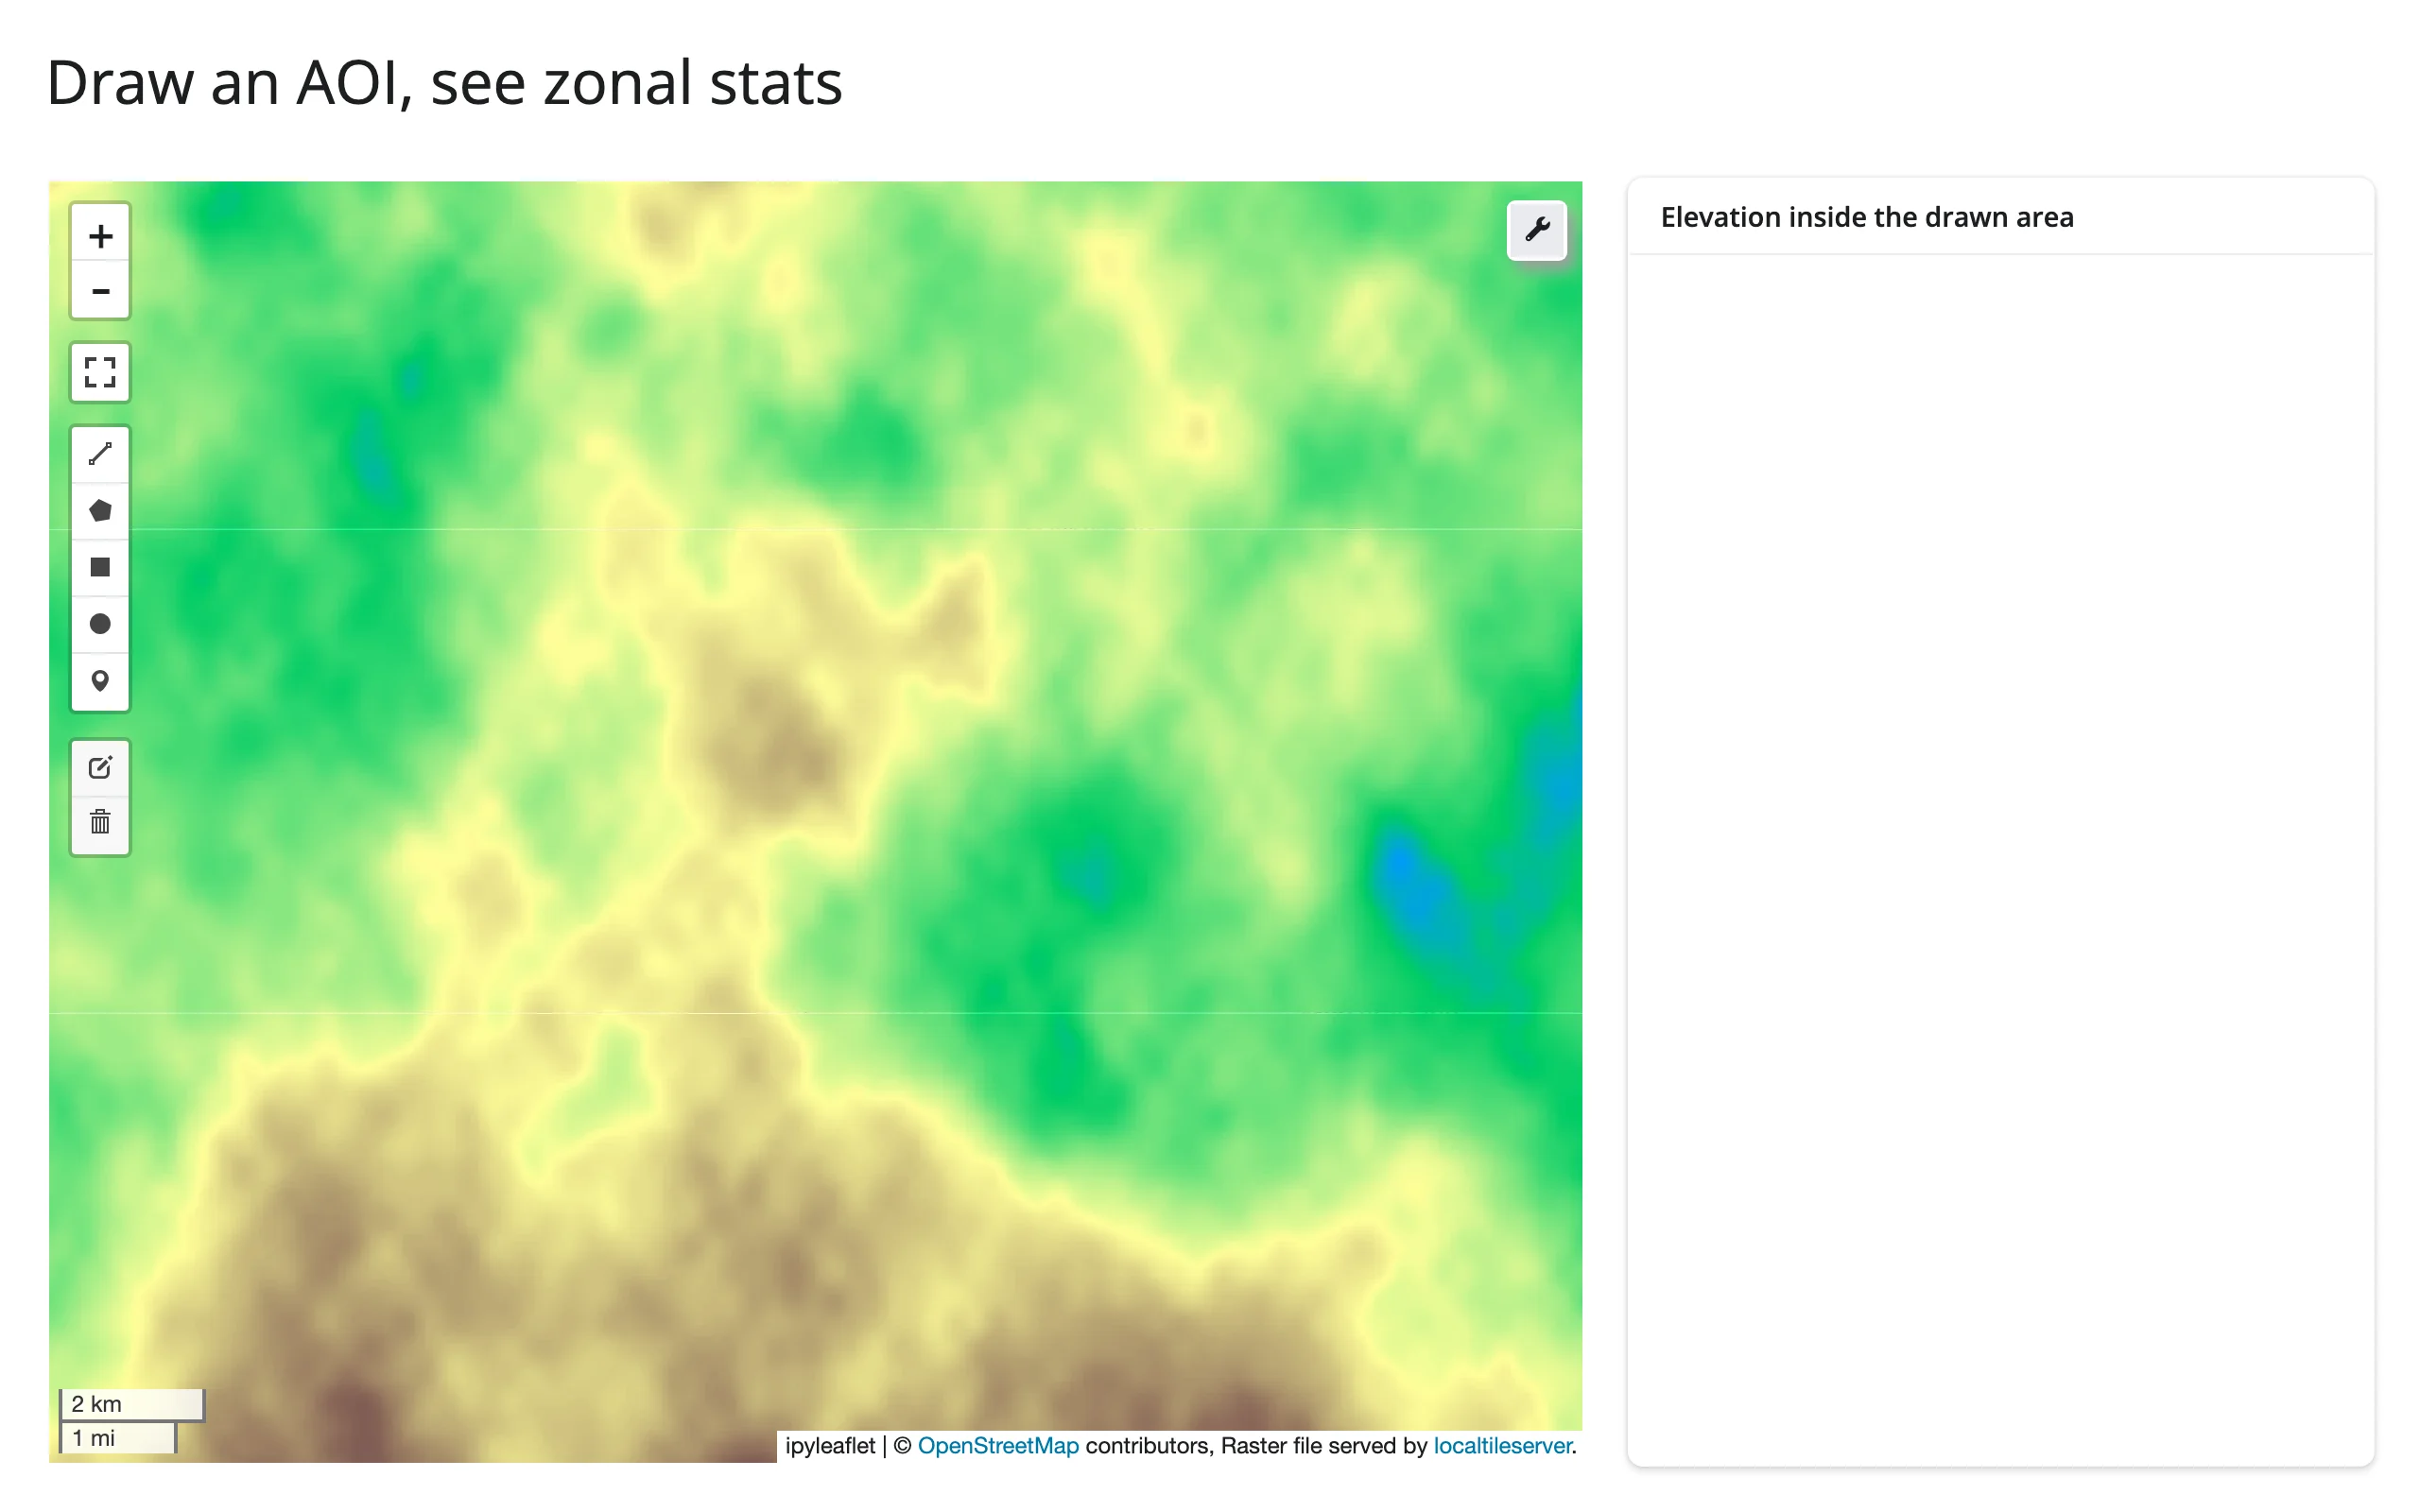
This is where leafmap’s default DrawControl (on every map, no setup) becomes a real tool: draw an AOI, clip a raster to it, and report zonal statistics – the core loop of a lot of GIS analyst work, in well under 100 lines.
# Needs leafmap's raster extra (pip install 'leafmap[raster]') plus rioxarray,
# scipy, and shapely for the synthetic raster and the AOI clip: `uv run --with
# rioxarray,scipy,shapely,plotly shiny run 10_drawn_features_zonal.py`.
import tempfile
from pathlib import Path

import leafmap
import numpy as np
import plotly.express as px
import rioxarray  # noqa: F401  (registers the .rio accessor)
import shapely.geometry
import xarray as xr
from scipy.ndimage import zoom
from shiny import reactive, req
from shiny.express import render, ui
from shinywidgets import render_leafmap, render_plotly


def make_terrain_cog(path: Path, n: int = 600) -> None:
    rng = np.random.default_rng(7)
    elev = np.zeros((n, n), dtype=np.float32)
    for octave in range(6):
        k = 3 * 2**octave
        elev += zoom(rng.normal(0, 1, (k, k)).astype(np.float32), n / k, order=3)[
            :n, :n
        ] * (400 / 2**octave)
    elev = np.clip(elev - elev.min(), 0, None)
    ys = np.linspace(47.75, 47.45, n)
    xs = np.linspace(-122.5, -122.15, n)
    da = xr.DataArray(elev, dims=("y", "x"), coords={"y": ys, "x": xs})
    da.rio.set_spatial_dims(x_dim="x", y_dim="y", inplace=True)
    da.rio.write_crs("EPSG:4326", inplace=True)
    da.rio.to_raster(path, driver="COG", compress="deflate")


COG = Path(tempfile.gettempdir()) / "shinywidgets_leafmap_terrain.tif"
if not COG.exists():
    make_terrain_cog(COG)
ELEVATION = rioxarray.open_rasterio(COG).squeeze("band", drop=True)

ui.page_opts(title="Draw an AOI, see zonal stats", fillable=True)

with ui.layout_columns(col_widths=(8, 4)):

    @render_leafmap
    def map():
        m = leafmap.Map(center=(47.6, -122.33), zoom=12)
        m.add_raster(
            str(COG), colormap="terrain", layer_name="Elevation", zoom_to_layer=False
        )
        return m

    with ui.card():
        ui.card_header("Elevation inside the drawn area")

        @reactive.calc
        def clipped():
            # drawn_features() is a list of GeoJSON Features: the AOI to clip to
            features = map.drawn_features()
            req(features)
            geom = shapely.geometry.shape(features[-1]["geometry"])
            return ELEVATION.rio.clip([geom.__geo_interface__], "EPSG:4326")

        @render.express
        def stats():
            data = clipped()
            ui.div(f"mean: {float(data.mean()):.0f} m")
            ui.div(f"min: {float(data.min()):.0f} m -- max: {float(data.max()):.0f} m")
            ui.div(f"{data.size} pixels in the drawn area")

        @render_plotly
        def hist():
            return px.histogram(
                clipped().values.ravel(), nbins=30, labels={"value": "elevation (m)"}
            )
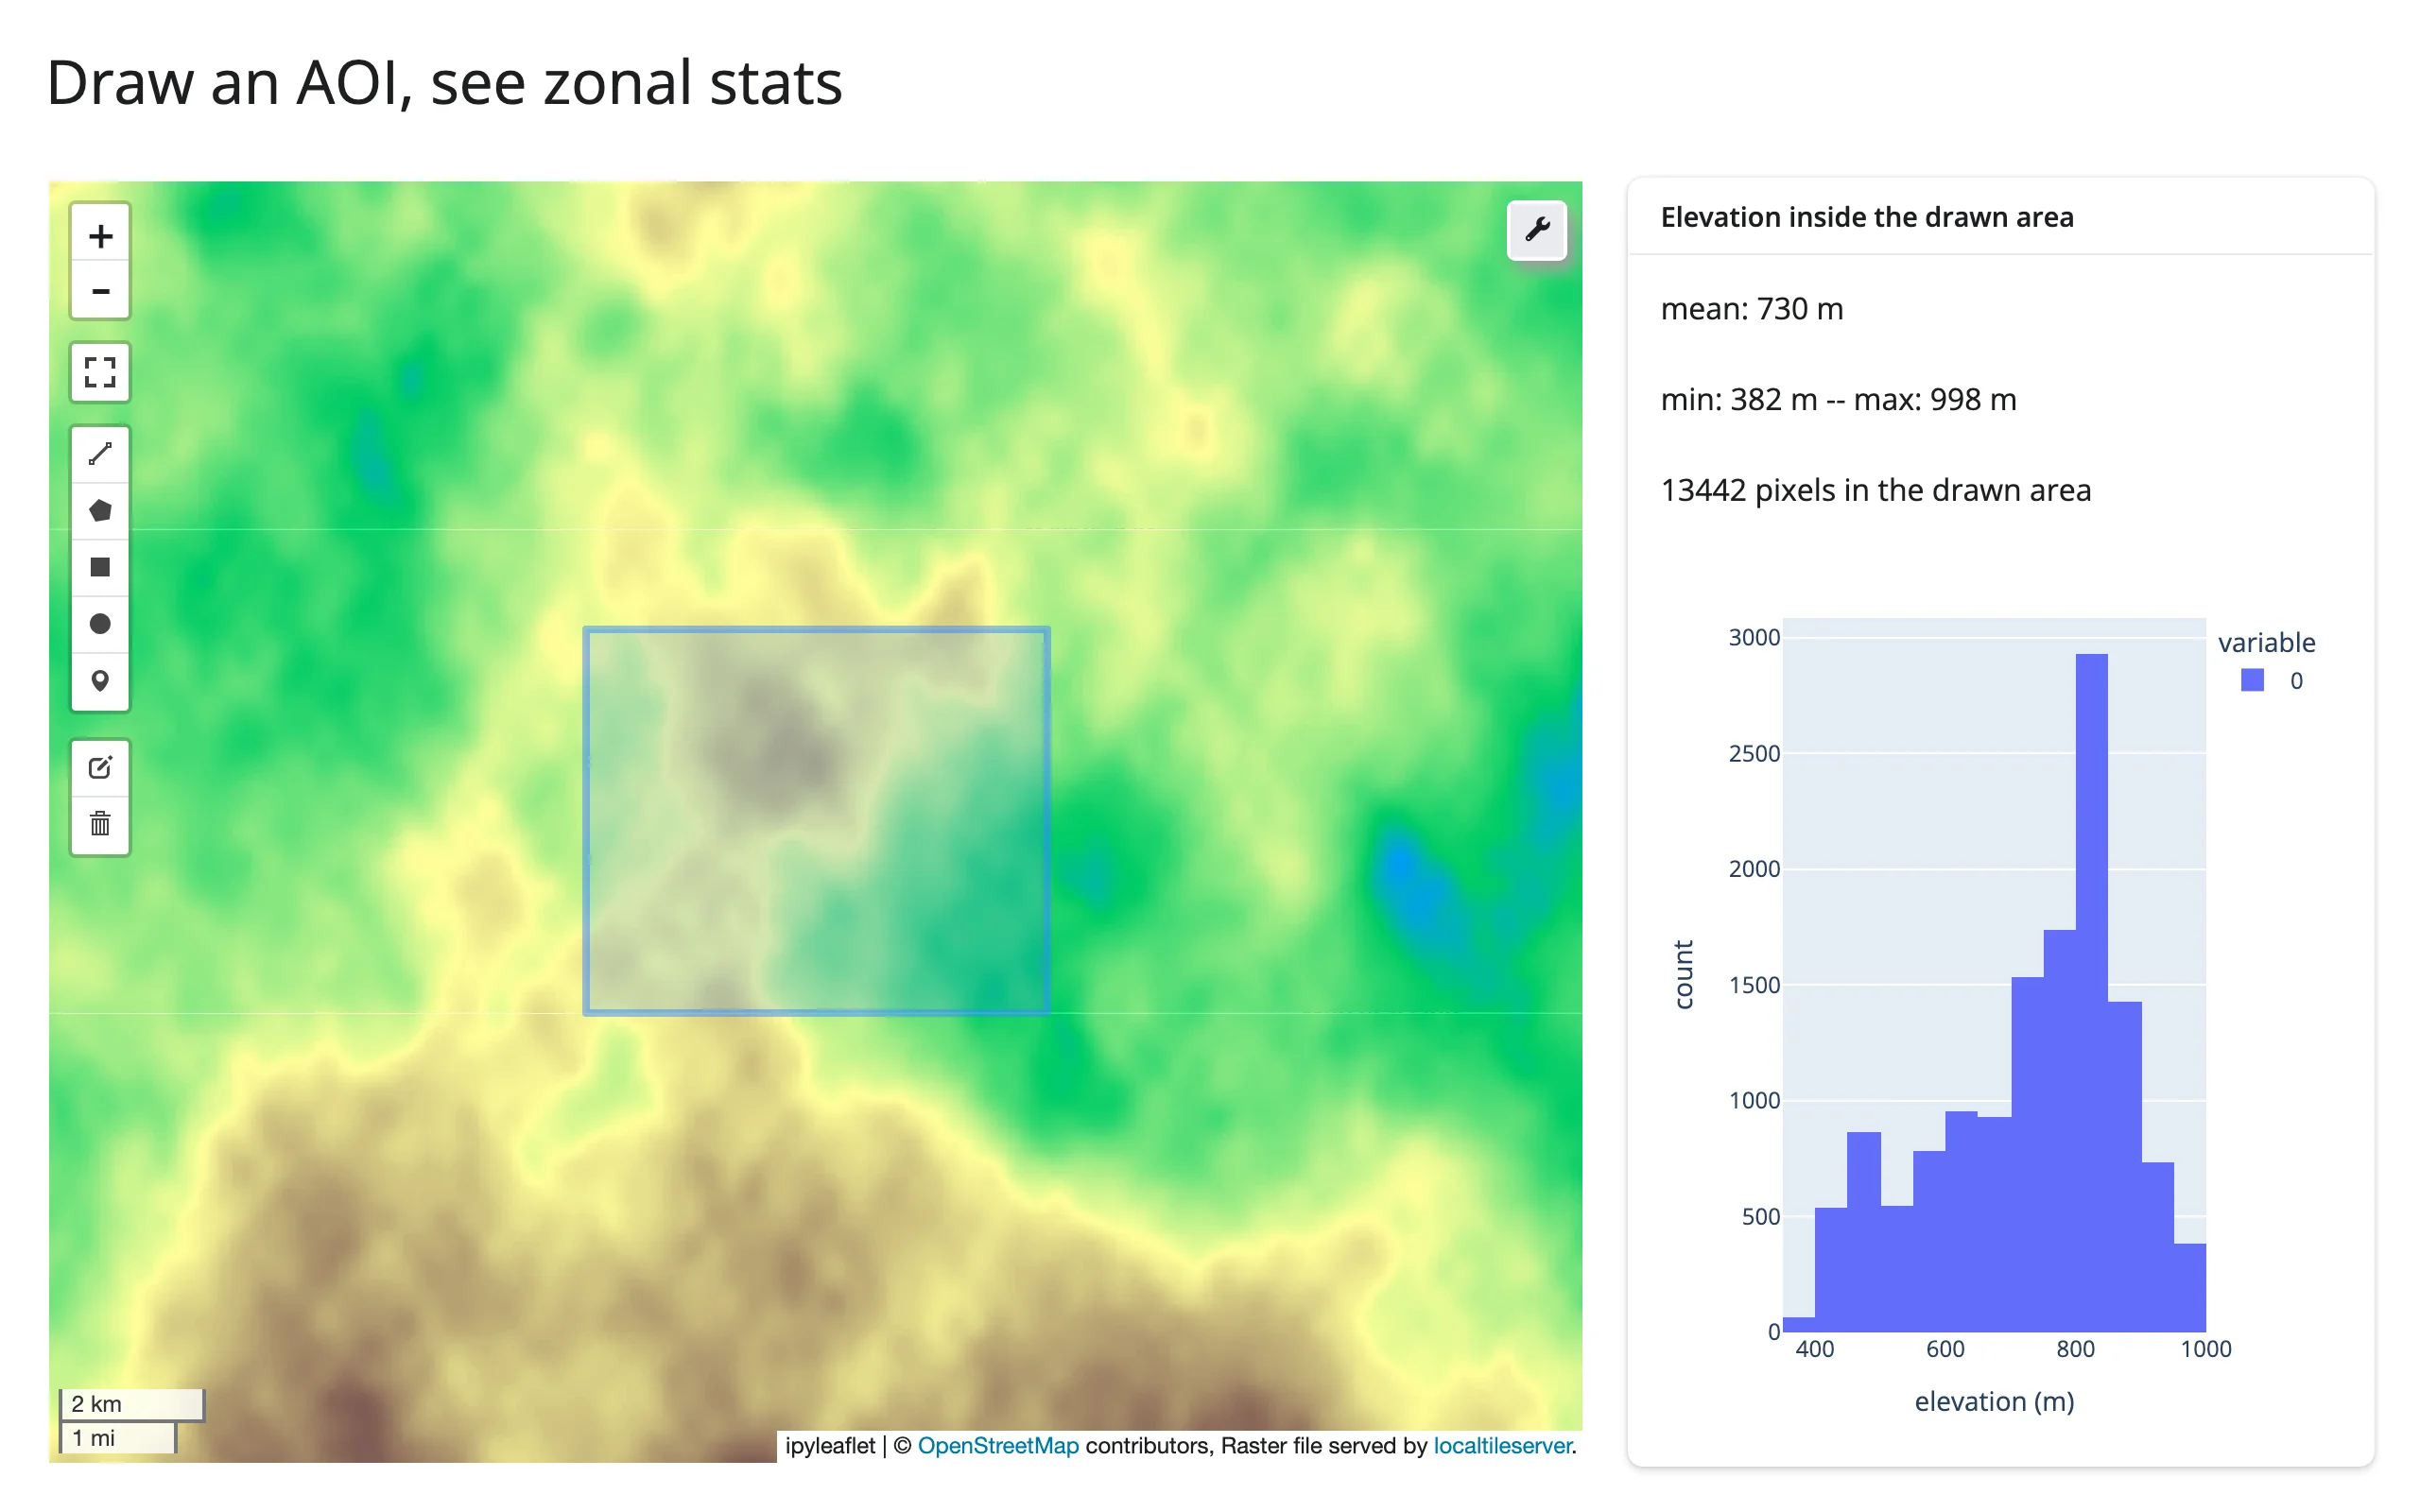
drawn_features() raises TypeError if the map has no DrawControl (not an issue with leafmap’s default map, which always has one) and reports TypeError on non-ipyleaflet backends, same as the other four accessors.
Reading on demand
Because every accessor attaches at render, a button (or a download handler, or a chat/LLM tool callback) can read center()/zoom()/drawn_features() with no warm-up – nothing else in the app needs to keep reading them to keep them live:
import leafmap
from shiny import reactive
from shiny.express import input, render, ui
from shinywidgets import render_leafmap

ui.page_opts(title="Save the current view on demand", fillable=True)

# Every accessor attaches when the map renders, so this button's reads see
# the user's latest pan or drawn shape with no warm-up read elsewhere in
# the app keeping bounds()/drawn_features() "live" first.
saved = reactive.value([])

with ui.layout_columns(col_widths=[8, 4]):
    with ui.card():
        ui.input_action_button("save", "Save current view", class_="mb-2")

        @render_leafmap
        def map():
            m = leafmap.Map(center=(47.62, -122.33), zoom=11)
            m.add_basemap("Esri.WorldImagery")
            return m

    with ui.card():
        ui.card_header("Saved views")

        @render.ui
        def views():
            if not saved():
                return "Pan the map, maybe draw a shape, then click Save."
            items = [
                ui.tags.li(f"center={c} zoom={z:.0f} shapes={n}") for c, z, n in saved()
            ]
            return ui.tags.ol(*items)


@reactive.effect
@reactive.event(input.save)
def _save_view():
    saved.set([*saved(), (map.center(), map.zoom(), len(map.drawn_features()))])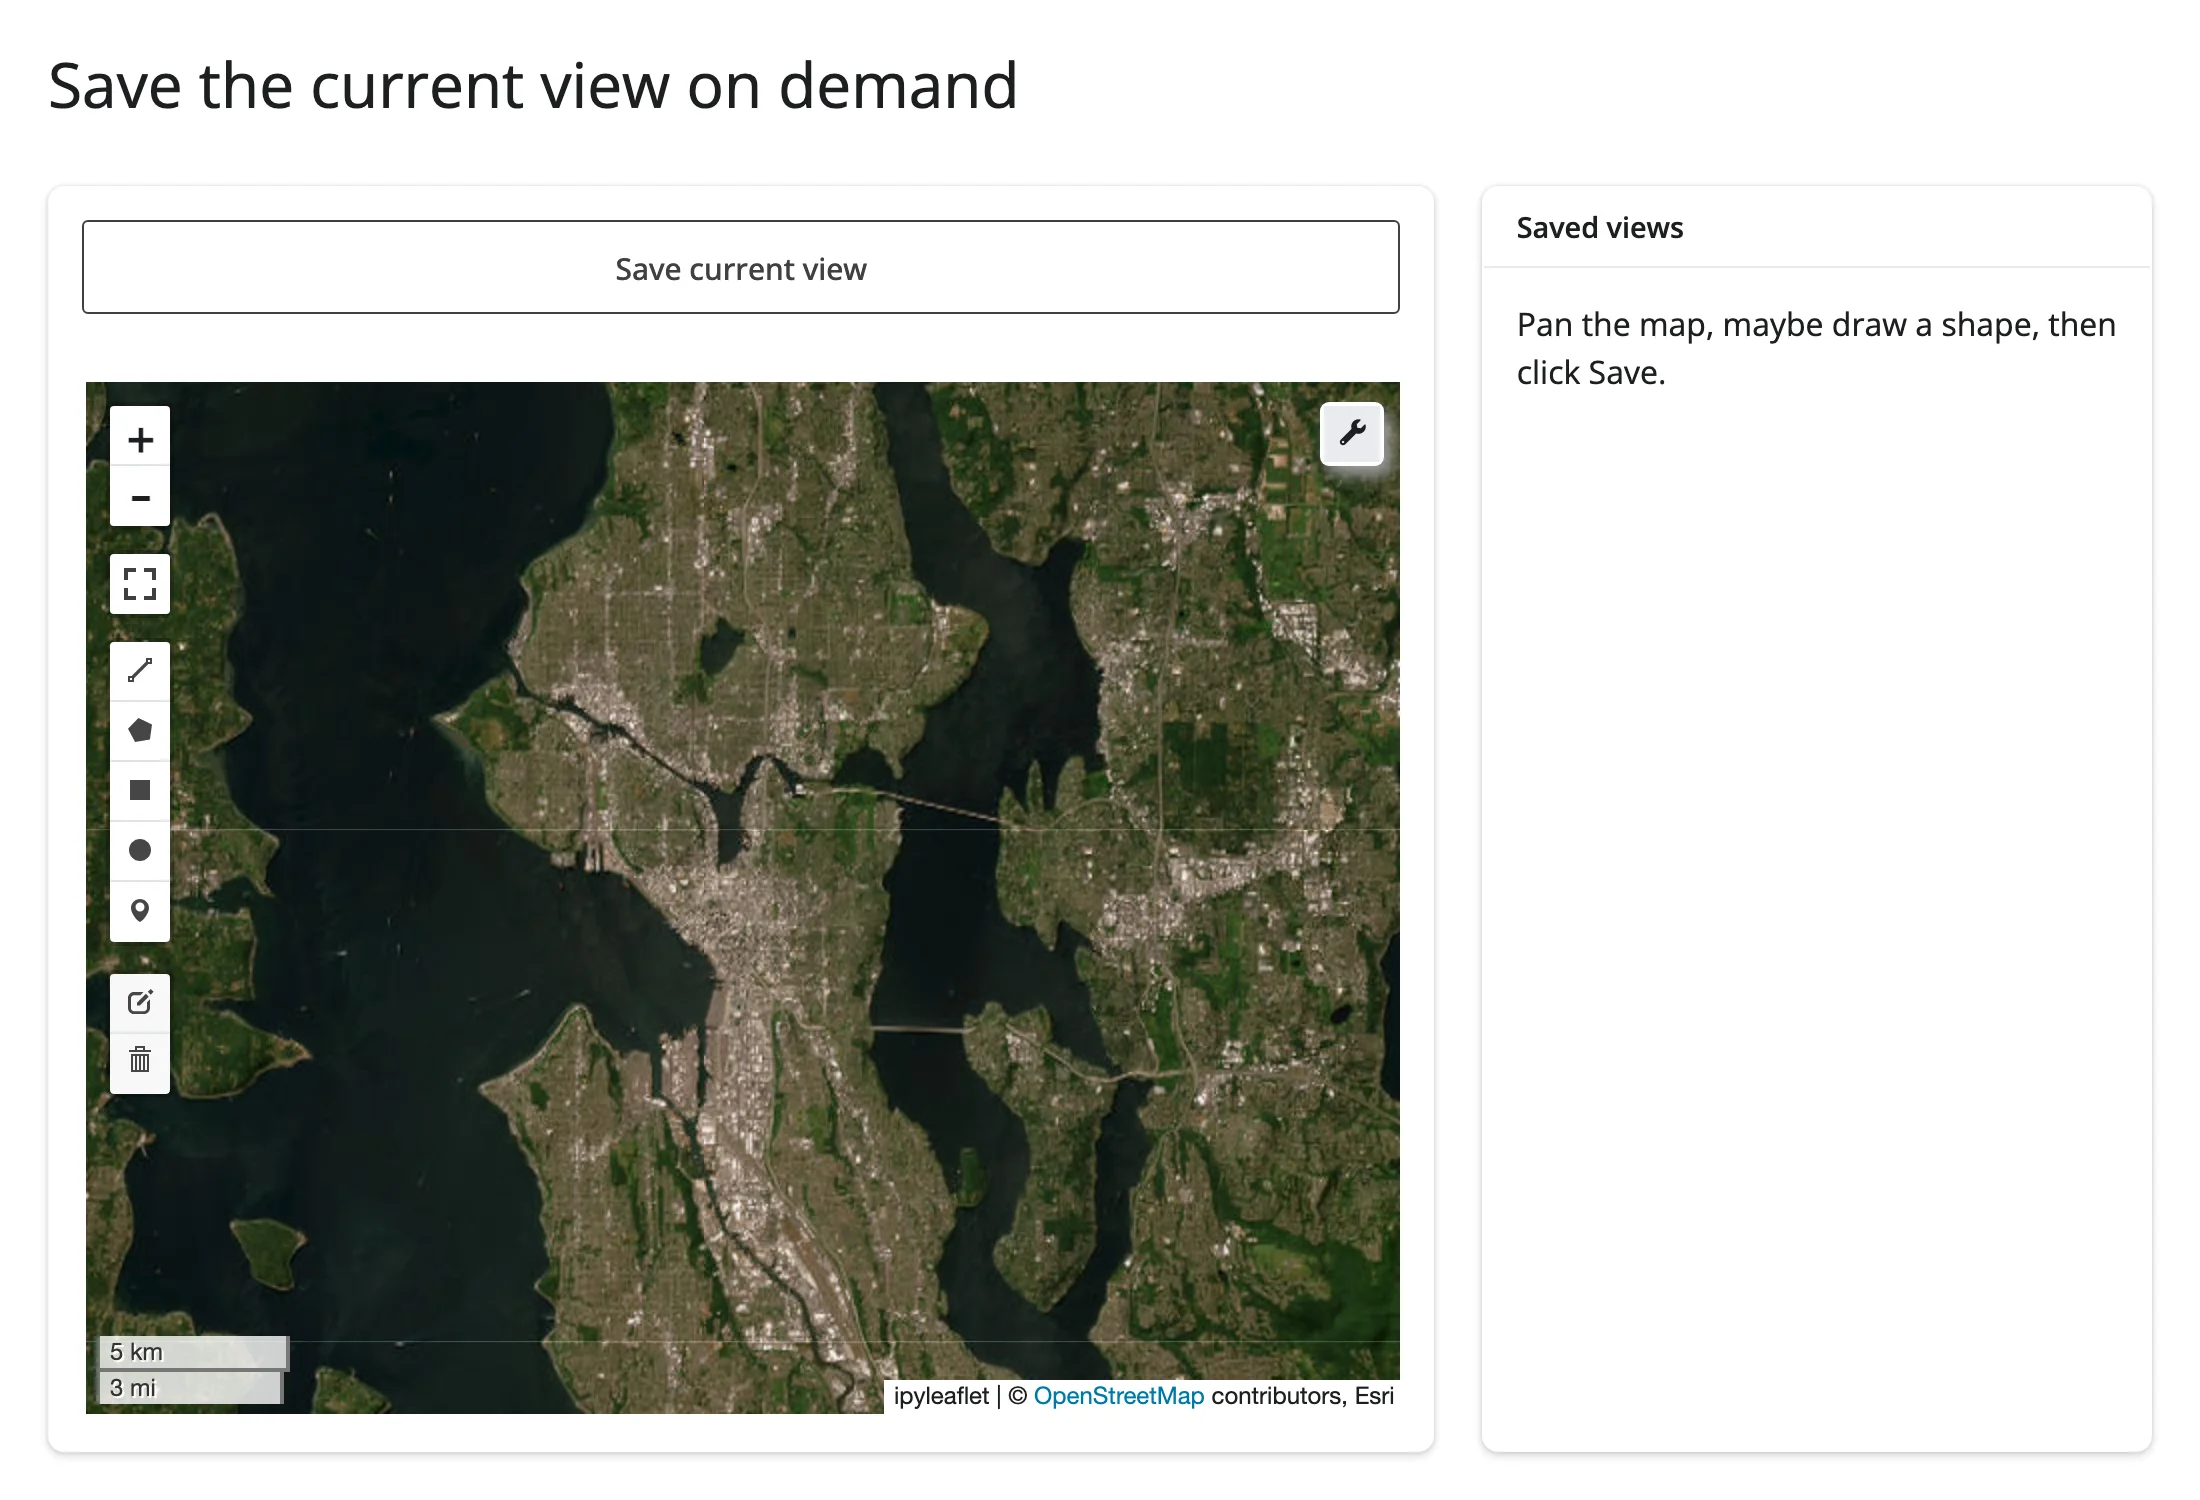
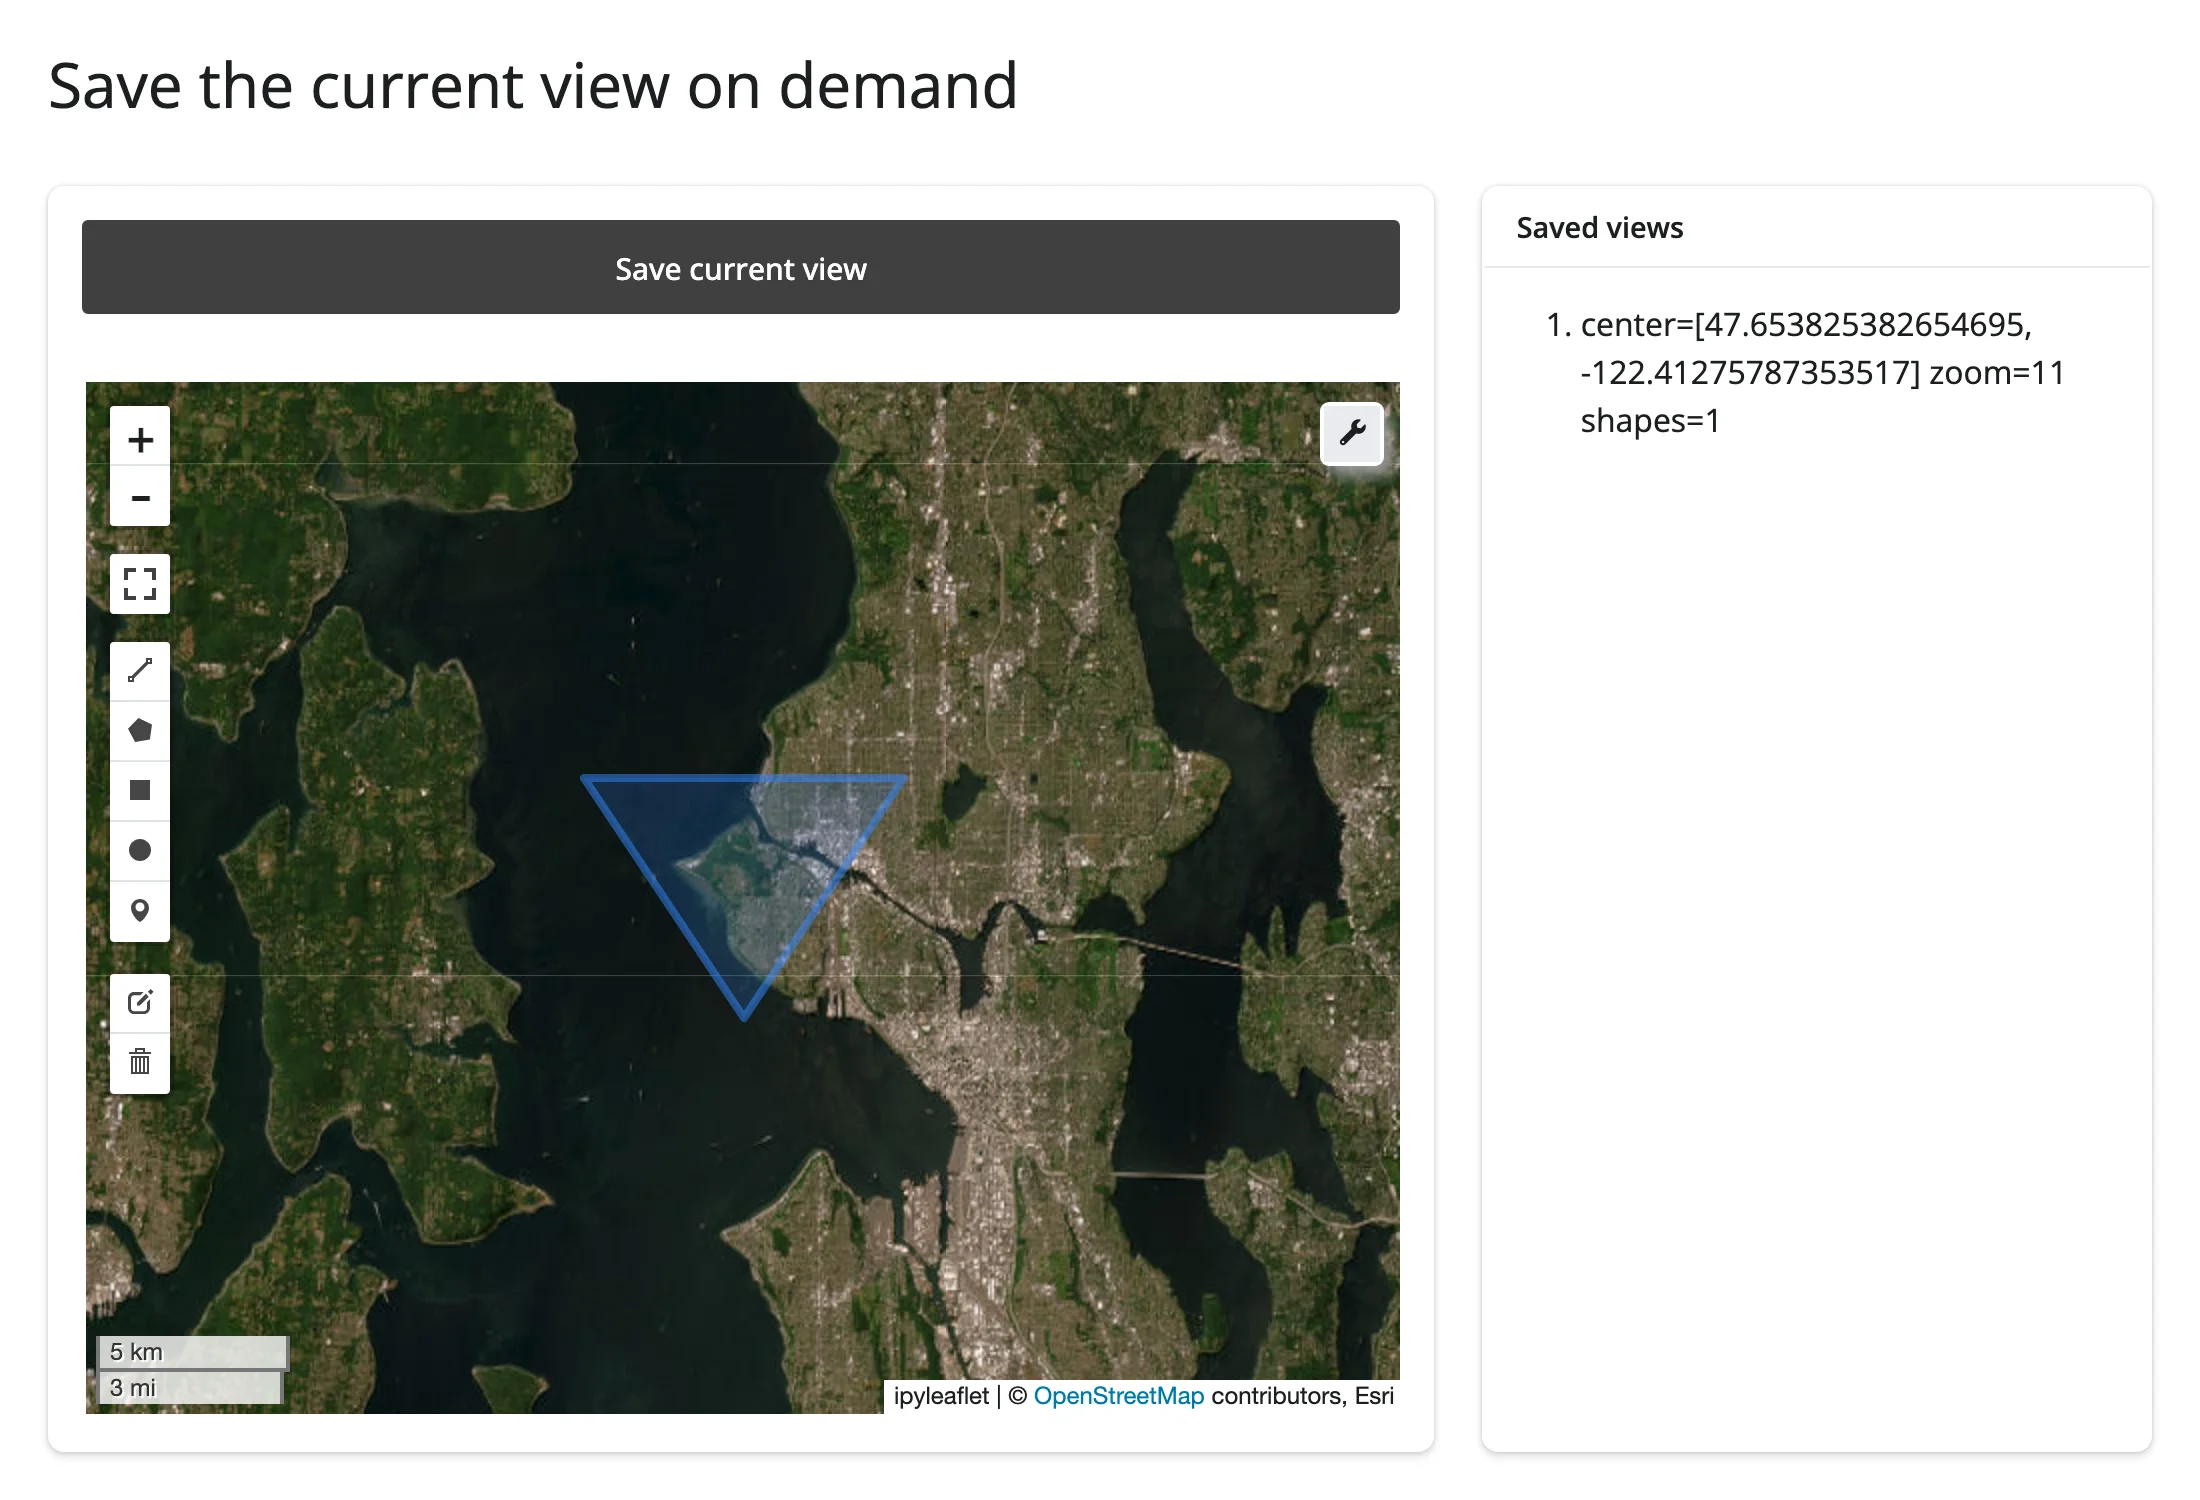
Verified: pan the map, draw a triangle with the default toolbar’s polygon tool, click Save once – the saved entry has the panned-to center, the current zoom, and shapes=1, with nothing else in the app subscribed to center()/zoom()/drawn_features().
Beyond the accessors: reactive_read() on other backends
The accessors above only exist on the ipyleaflet backend. On leafmap.maplibregl.Map, read view_state (center/zoom/bounds/bearing/pitch) and clicked ({"lng": ..., "lat": ...}) with map.read(...) instead – and calling an accessor method there raises a TypeError that says so. map.read("view_state") is preferred over reactive_read(map.widget, "view_state") here: map.widget is this output’s own rendered widget, so read() applies the renderer’s rate-limit kwargs the same way and needs no import of reactive_read:
import leafmap.maplibregl as lmgl
from shiny import req
from shiny.express import render, ui
from shinywidgets import render_leafmap

ui.page_opts(title="leafmap's maplibre backend", fillable=True)

with ui.layout_columns(col_widths=(9, 3)):

    @render_leafmap
    def map():
        return lmgl.Map(center=(-122.42, 37.77), zoom=11, style="positron")

    with ui.card():
        ui.card_header("map.read(), not accessors")

        @render.code
        def view_state():
            # This backend isn't an ipyleaflet.Map, so map.zoom()/map.bounds()/etc.
            # raise TypeError; read maplibre's own traits with map.read()
            vs = map.read("view_state")
            req(vs)  # {} until the browser's first moveend/zoomend
            c = vs["center"]
            return (
                f"center: ({c['lng']:.3f}, {c['lat']:.3f})\n"
                f"zoom:   {vs['zoom']:.1f}\n"
                f"bearing/pitch: {vs['bearing']:.0f}, {vs['pitch']:.0f}"
            )

        @render.code
        def accessor_error():
            try:
                map.zoom()
            except TypeError as e:
                return f"map.zoom() raises:\n{e}"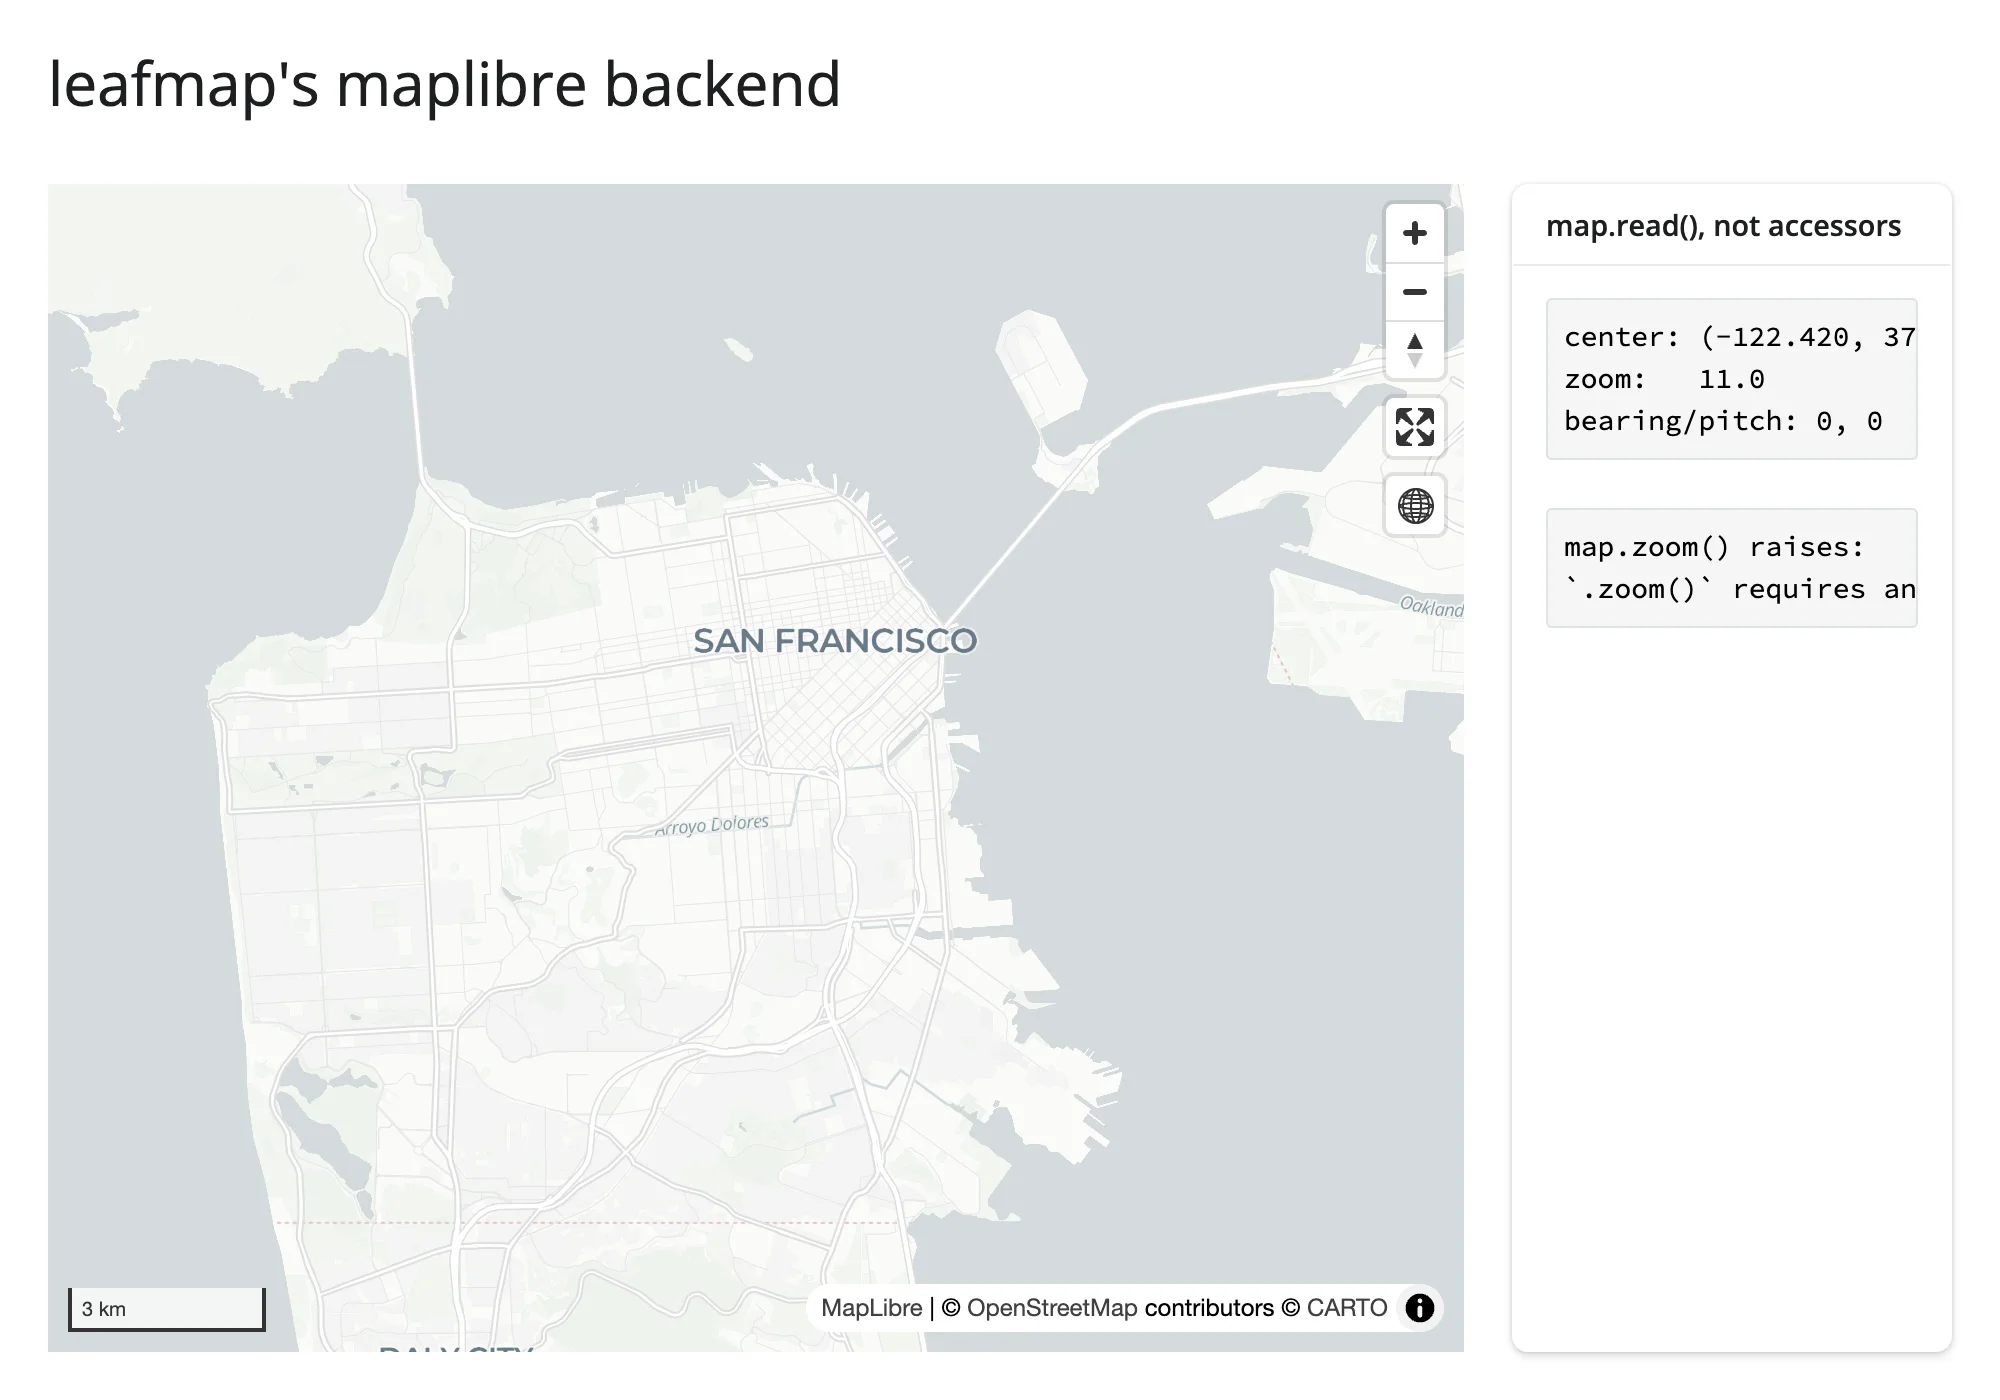
On the kepler.gl backend (leafmap.kepler.Map), read map.read("config") – but note leafmap nests kepler’s own config one level down (config["config"]["mapState"], not config["mapState"]). The plotly backend (leafmap.plotlymap.Map) is already a go.FigureWidget; read its state the way ../plotly/guide.md describes (e.g., layout.mapbox.center).
Rate limiting
None of the five ipyleaflet-backend accessors need rate_policy/rate_delay – each fires once per completed gesture, not continuously during one. You would reach for them on a reactive_read() of a trait that streams many updates per gesture instead (a dragged marker’s location, for example); see ../ipyleaflet/guide.md for that pattern, which carries over unchanged to leafmap’s ipyleaflet backend.
Updating the widget from Python
Setting traits on the live .widget – rather than re-running the render function – keeps the map’s current view, any shapes the user has drawn, and every other layer exactly as they were; a re-render builds a brand-new JS map and resets all of that. Reach for in-place updates whenever an input should tweak the existing map rather than replace it:
import leafmap
from shiny import reactive, req
from shiny.express import input, ui
from shinywidgets import render_leafmap

CITIES = {
    "Seattle": (47.6062, -122.3321),
    "Portland": (45.5152, -122.6784),
    "Vancouver": (49.2827, -123.1207),
}

ui.page_opts(title="Updating leafmap in place", fillable=True)

with ui.sidebar():
    ui.input_select("city", "Fly to", list(CITIES))
    ui.input_slider("opacity", "Basemap opacity", 0, 1, value=1, step=0.1)


@render_leafmap
def map():
    m = leafmap.Map(center=(47.6, -122.33), zoom=9)
    m.add_basemap("Esri.WorldImagery", show=True)
    return m


# Re-rendering here would rebuild the whole map (new JS widget, reset zoom and
# any user edits); setting traits on the live .widget instead keeps the
# camera, drawn shapes, and everything else the user already has on screen
@reactive.effect
def _fly_to():
    m = map.widget
    req(m)
    lat, lng = CITIES[input.city()]
    m.center = (lat, lng)
    m.zoom = 11


@reactive.effect
def _set_opacity():
    m = map.widget
    req(m)
    m.layers[-1].opacity = input.opacity()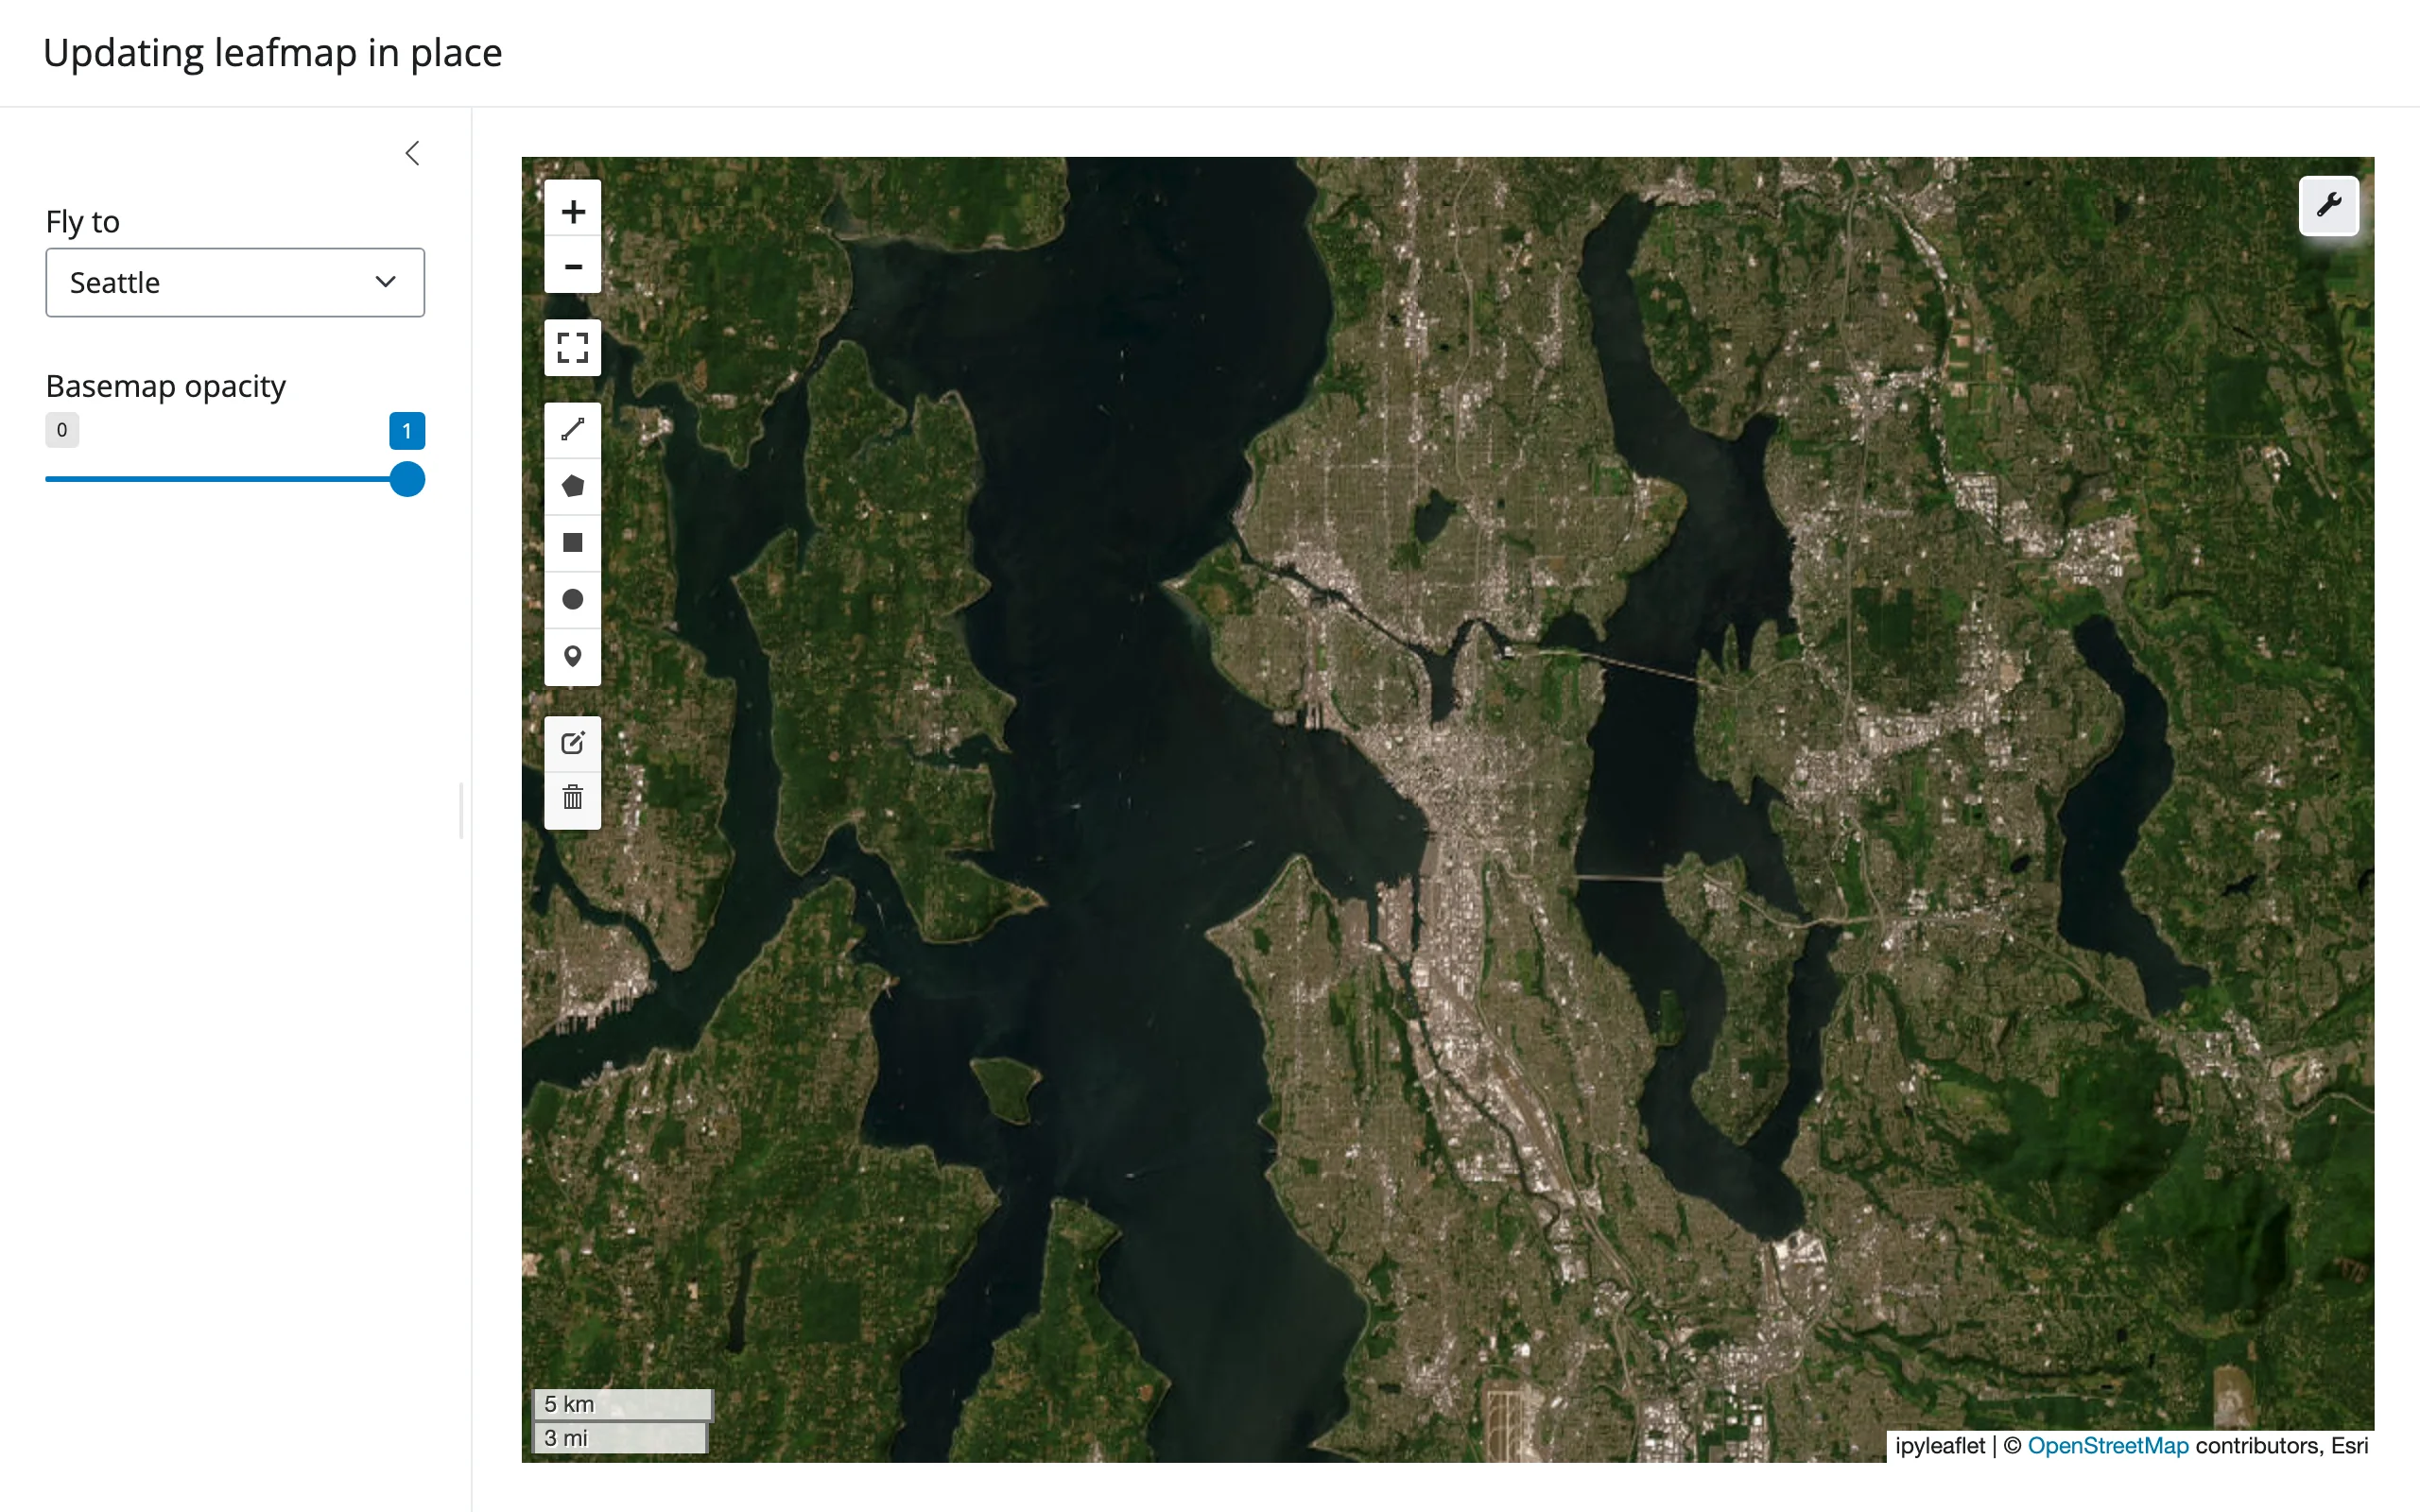
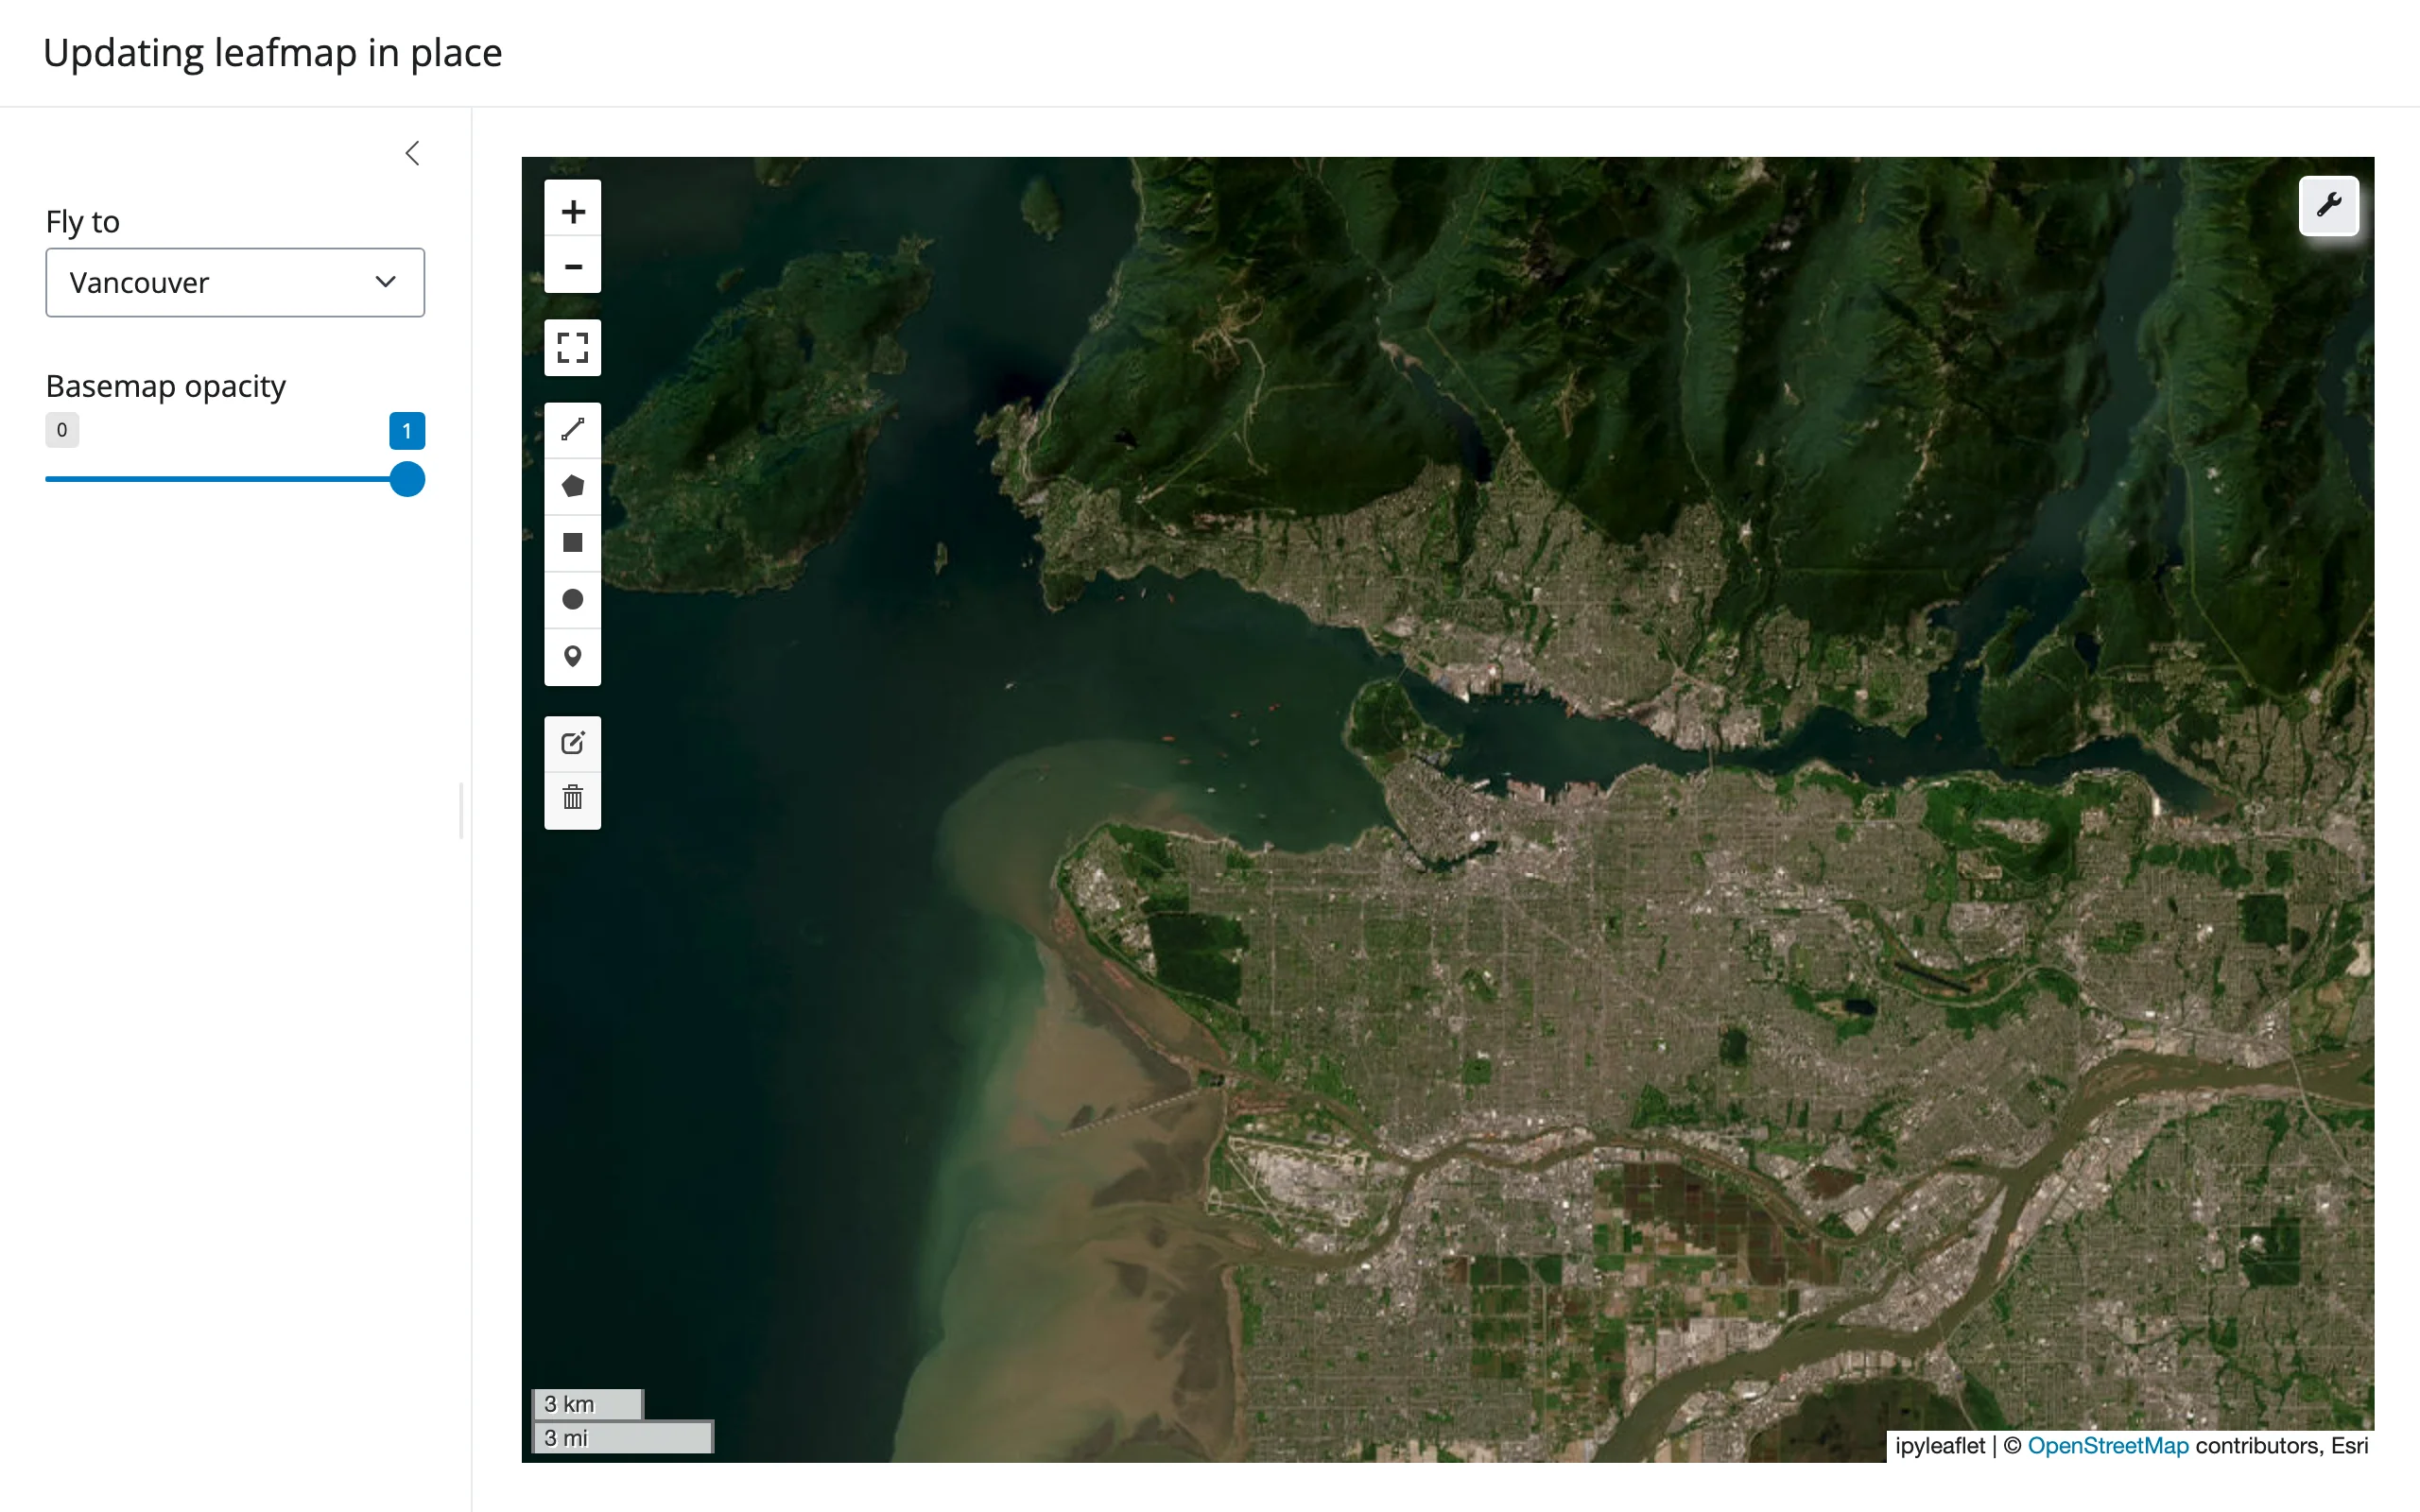
Selecting a different city flies the same map there – the draw toolbar, any drawn shapes, and layers are all untouched, unlike a re-render which would hand the browser a fresh widget.
Coordinating multiple views
Three complete patterns from the examples above, in one place:
- Map viewport → chart of what’s visible.
bounds()drives apx.barof the most populous cities currently on screen (07_bounds_viewport_chart.py). Generalizes to any spatial join against the current bounding box – filter a table, recompute a summary stat, refresh a list. - Click → detail card.
clicked()plus a nearest-neighbor lookup renders a small detail panel for whatever’s nearest the click (09_clicked_detail.py). Swap the nearest-point lookup for a spatial.sjoin()against polygons to get “click a region, see its attributes.” - Draw an AOI → clip and summarize.
drawn_features()feeds arioxarrayclip and zonal stats, shown as text and a histogram (10_drawn_features_zonal.py). The AOI workbench gallery app extends this to multiple AOIs and multiple raster bands.
All three follow the same shape: read an accessor in a @reactive.calc or a second @render.*/@render_plotly function (never inside the map’s own render function), and let Shiny’s dependency graph do the rest.
Large data
leafmap’s large-data story depends entirely on which backend Map() builds, since leafmap itself adds no rendering of its own on top. The default ipyleaflet backend inherits ipyleaflet’s limits – no large-data mode beyond marker clustering, full data sent to the browser otherwise. Switching to leafmap.maplibregl.Map gets MapLibre’s vector tiles and deck.gl layers, the GPU-in-browser approach – see maplibre. For rasters, add_raster()/add_cog_layer() (shown above) serve only the tiles the viewport actually requests via localtileserver, the “only send what’s visible” approach – see localtileserver for how that’s verified. See the Large data & performance article for the general picture.
Layout and sizing
leafmap’s 600px default height, on whichever backend sets it (Layout.height for ipyleaflet, height for maplibre, layout.height for plotly), is treated as unset: the map fills its card by default, in both a fillable=True page and inside a non-filling one. An explicit height – leafmap.Map(height=400), Layout(height="300px"), or render_leafmap(height="220px") – is respected instead.
import leafmap
from shiny.express import ui
from shinywidgets import render_leafmap

ui.page_opts(title="leafmap layout and sizing", fillable=True)

with ui.layout_columns(col_widths=(6, 6)):
    with ui.card(full_screen=True):
        ui.card_header("Default: fills the card")

        @render_leafmap
        def fills():
            # leafmap.Map() defaults to a 600px Layout.height; render_leafmap
            # treats that default as unset and fills the card instead
            return leafmap.Map(center=(47.6, -122.33), zoom=10)

    with ui.card():
        ui.card_header('render_leafmap(height="220px")')

        @render_leafmap(height="220px")
        def fixed():
            return leafmap.Map(center=(47.6, -122.33), zoom=10)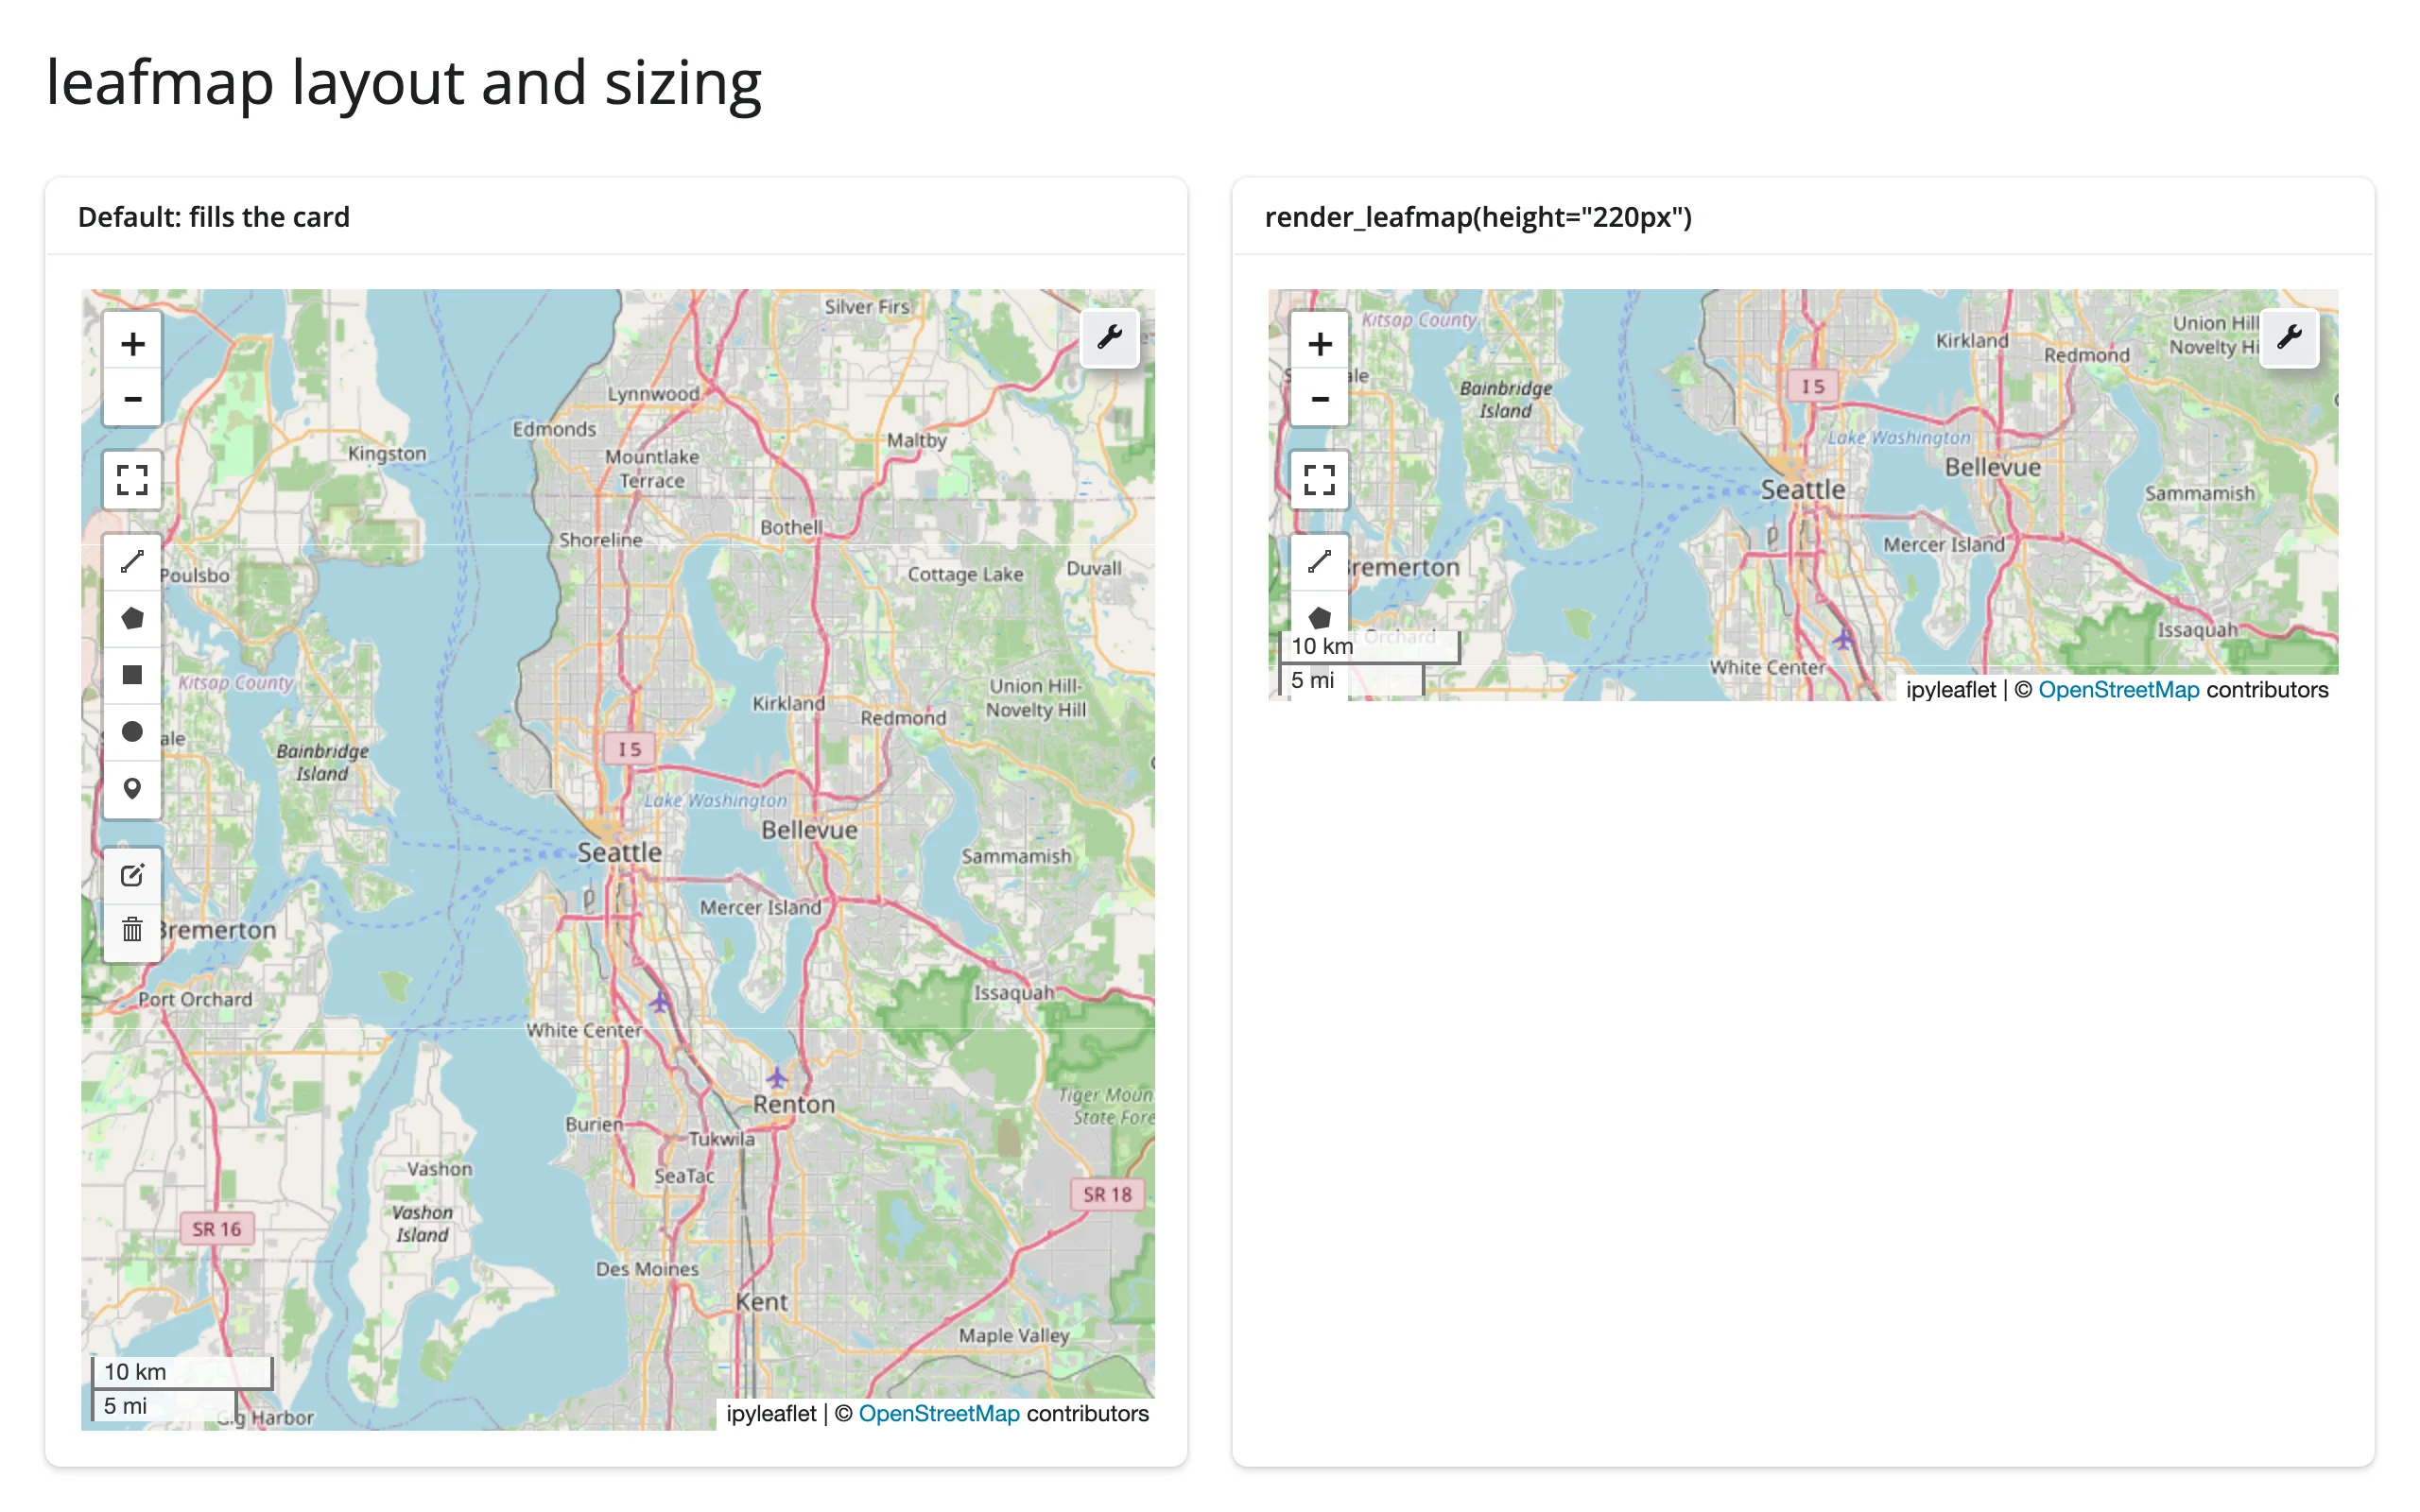
A short explicit height clips leafmap’s own draw toolbar if it’s shorter than the toolbar’s full button stack (visible on the right map above, which only shows a few tools) – a tradeoff of a very small fixed height, not a bug. This fill/explicit-height behavior is identical across all four widget backends and to ../ipyleaflet/guide.md’s own layout section, since the same _LAYOUT_DEFAULTS logic runs for leafmap’s output before the backend’s own handler.
Gotchas and limitations
Verified on current main (leafmap 0.64.4, ipyleaflet 0.20.0, maplibre 0.3.6, shiny 1.9.0):
add_raster(source)wants astr, not apathlib.Path. Passing aPathraisesValueError: The source must either be a string or TileClientfrom inside localtileserver’s layer builder.str(path)fixes it. Upstream (leafmap/localtileserver), not a shinywidgets issue.add_raster(indexes=...)wants a list, even though its type hint saysOptional[int]. Passing a bare int (as the signature suggests) raisesTypeError: 'int' object is not iterable– the implementation doesfor i in indexes. Passindexes=[1], notindexes=1. Upstream (leafmap) type-hint bug.add_data()/choropleth classification needsmapclassifyinstalled separately – it’s not pulled in byshinywidgets[leafmap]or leafmap’s base install, and the error if it’s missing (ImportError: mapclassify is required for this function) only appears at render time, not import time.- Stacking two “fill” outputs (e.g. a
@render.data_frameand a@render_plotly/@render_leafmap) in oneui.card()without giving one an explicit height can leave the second permanently invisible (its output div staysvisibility: hidden, waiting for a size measurement that never resolves to nonzero). This is a general Shiny/bslib fillable-layout interaction, not specific to leafmap – give the non-growing element (render.DataGrid(..., height="200px"), for example) a fixed height so the other one has room to fill. See the AOI workbench gallery app for a worked fix. - The plotly backend’s old incompatibility with plotly ≥6 is resolved. An earlier evaluation found
leafmap.plotlymap.Map()failing to construct under plotly ≥6 (add_scattermapbox/layout.mapboxhaving been removed). Verified fixed on leafmap 0.63.1 with plotly 6.9.0 (within theshinywidgets[leafmap]extra’splotly>=5.12,<7pin) – it constructs and renders normally. - Not independently re-verified this round: an earlier evaluation found that the kepler.gl and maplibre backends can’t share one page (
luma.gl - multiple VERSIONs detected, from keplergl 0.3.7’s older bundled deck.gl/luma.gl vs. maplibre’s newer one), leaving the kepler map blank. If you need both widget families on one page, test this combination before relying on it; the leafmap-specific backends in this guide (ipyleaflet, maplibre) don’t conflict with each other. drawn_features()needs aDrawControl– always true for leafmap’s default map (it adds one), but not for a plainipyleaflet.Mapyou’ve stripped controls from; the accessor raises a clearTypeErrorin that case.
Gallery candidates
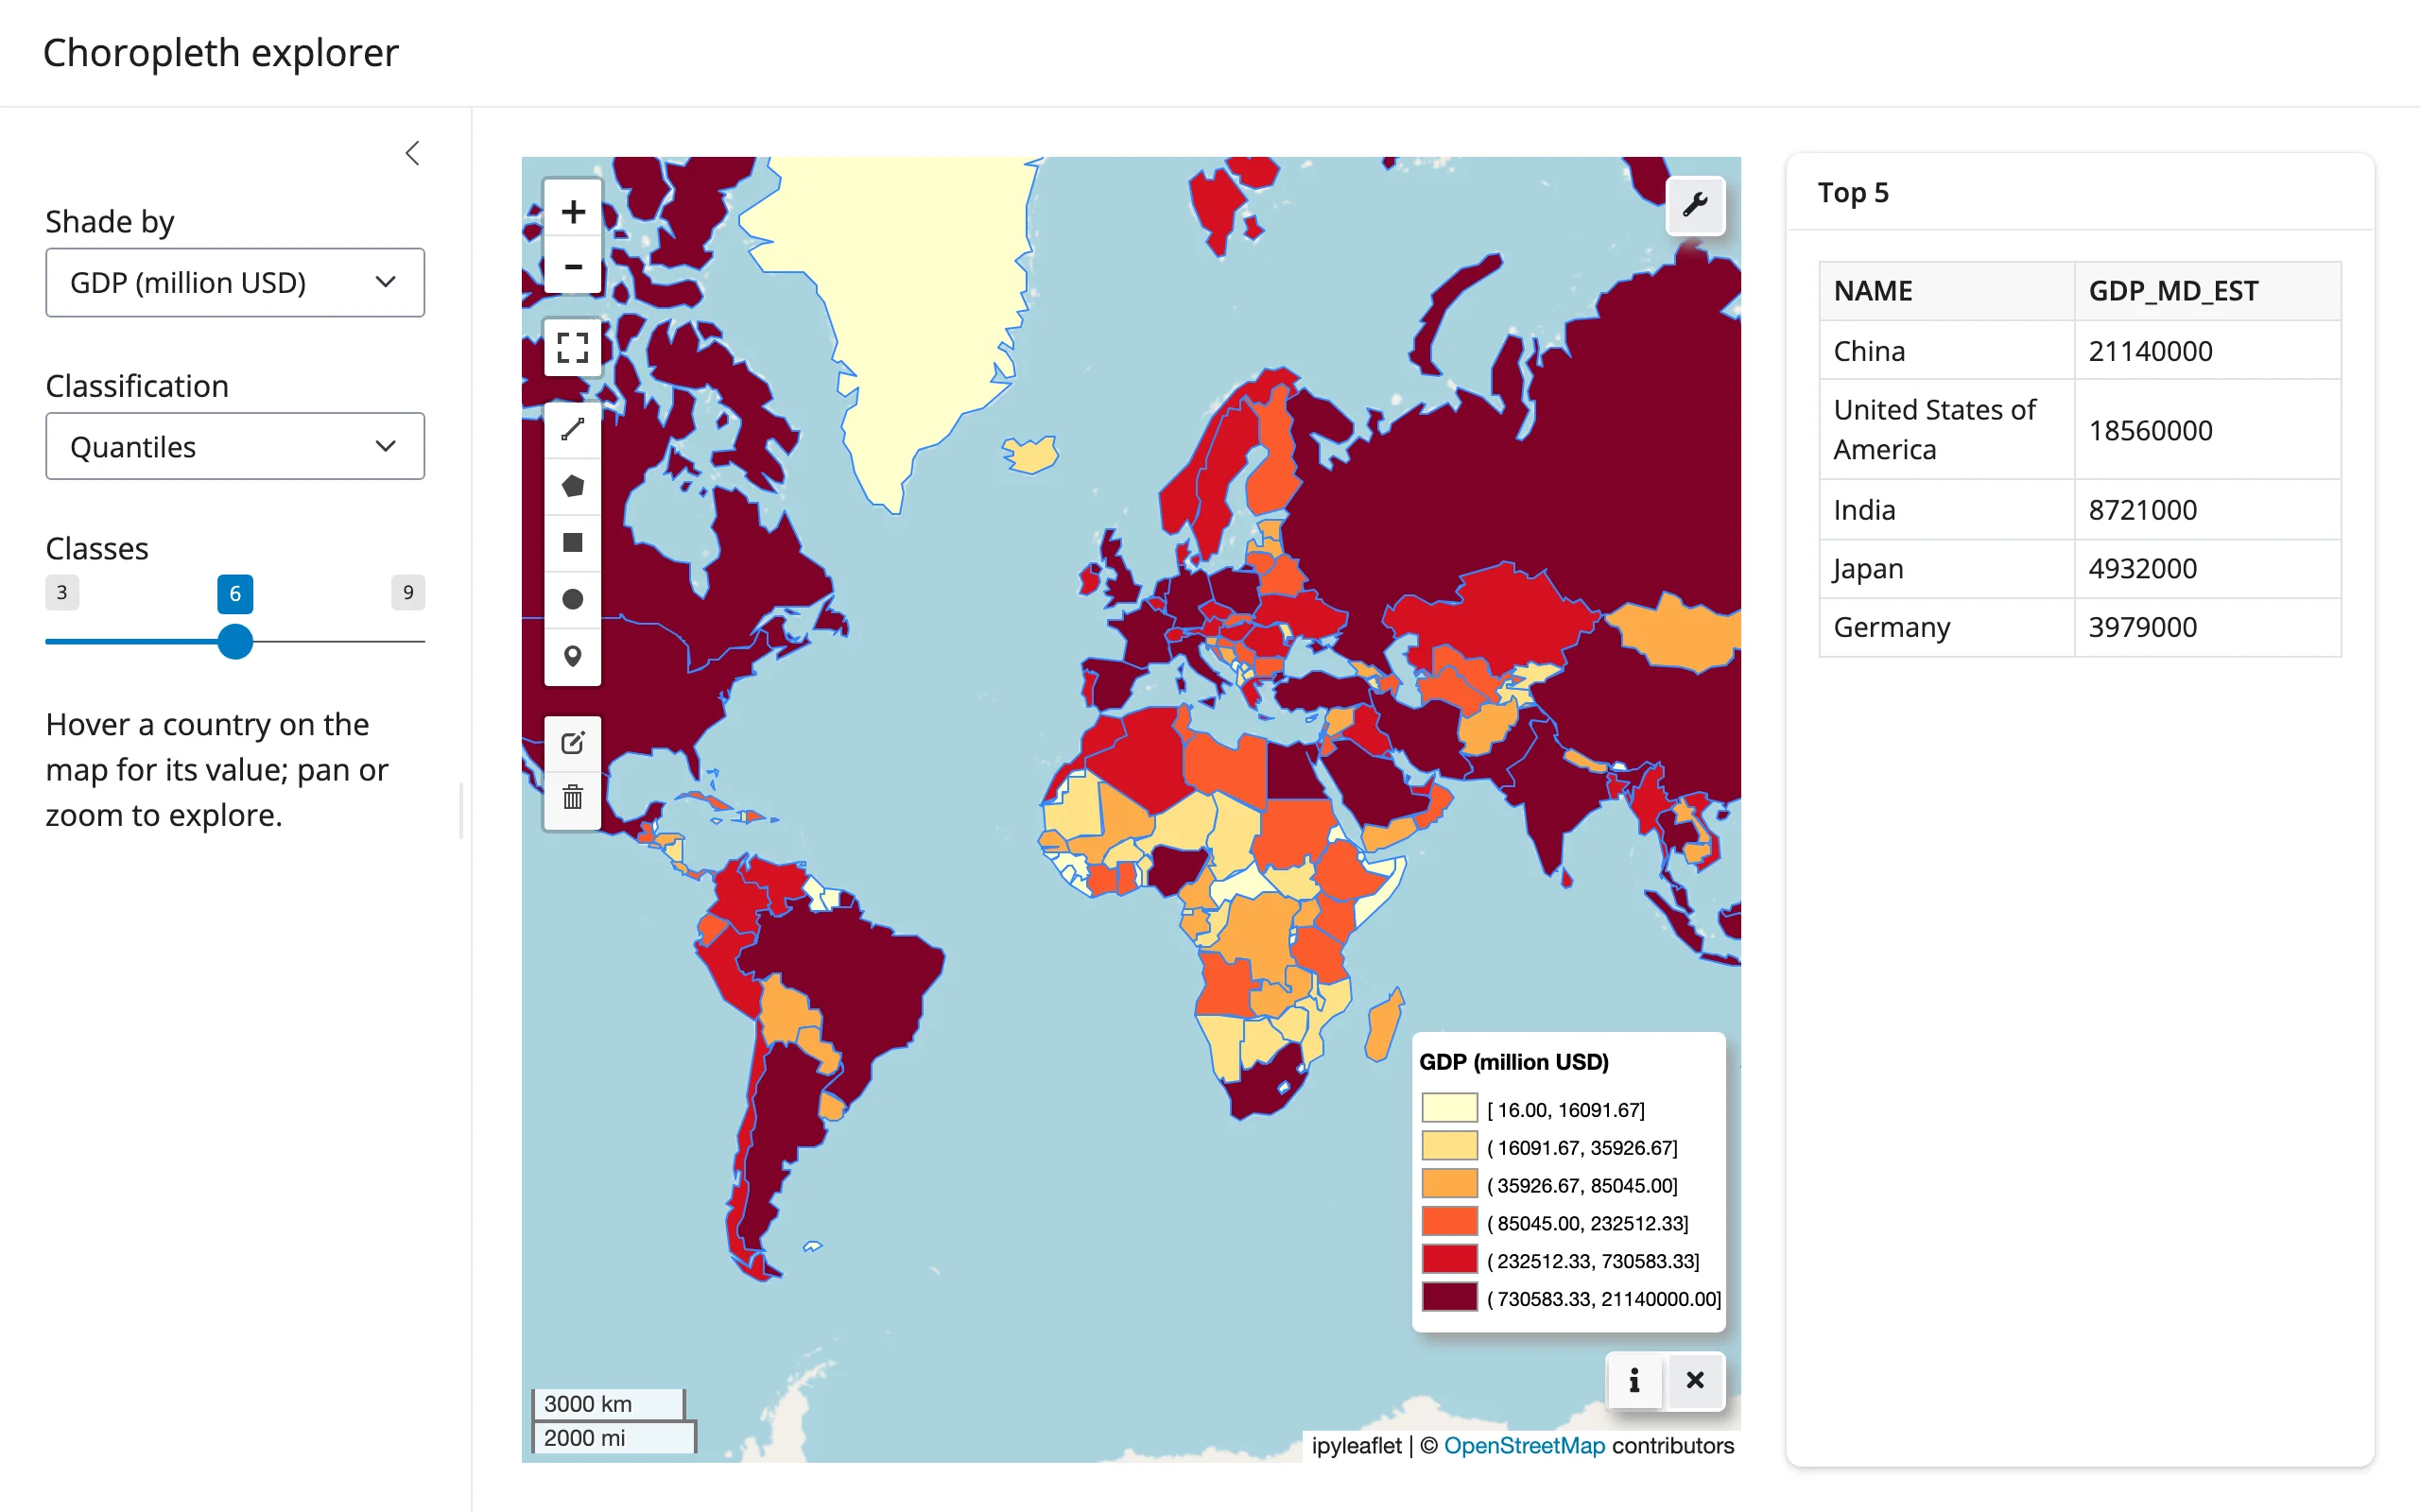
Template: choropleth explorer
A clean starting point: pick a column and classification scheme, see the map and a top-5 table update together.
Showcase: AOI workbench
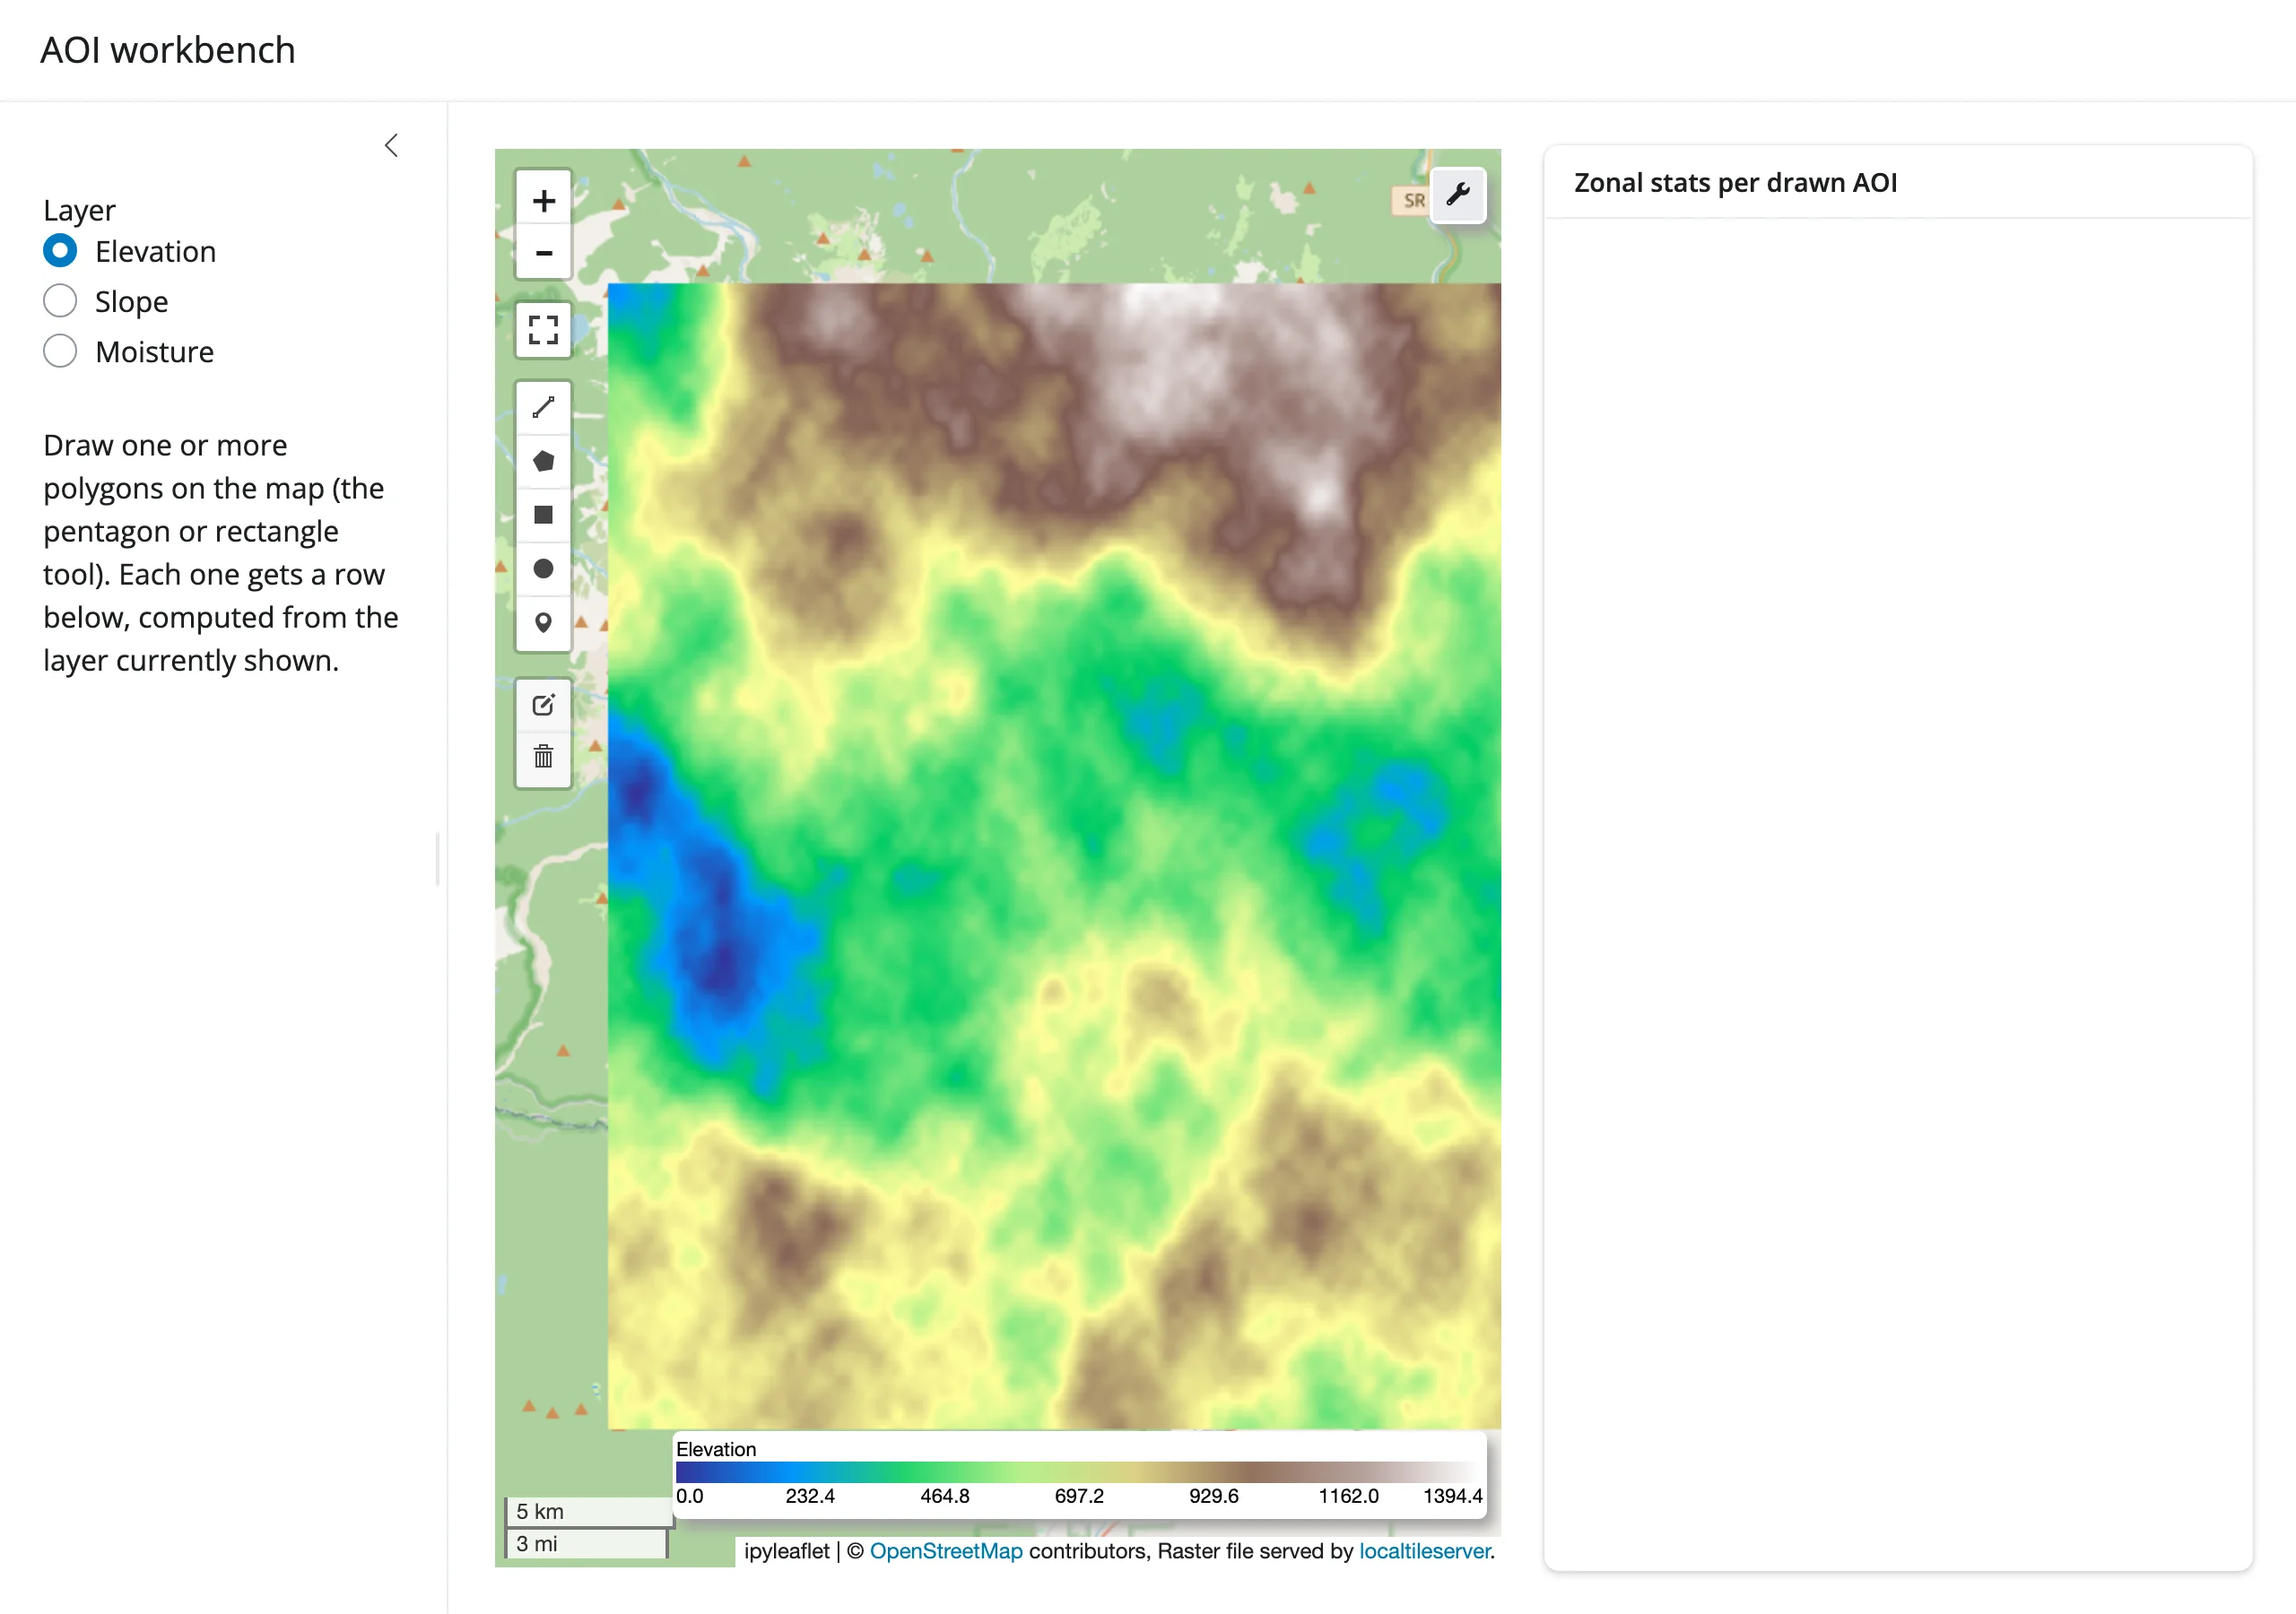
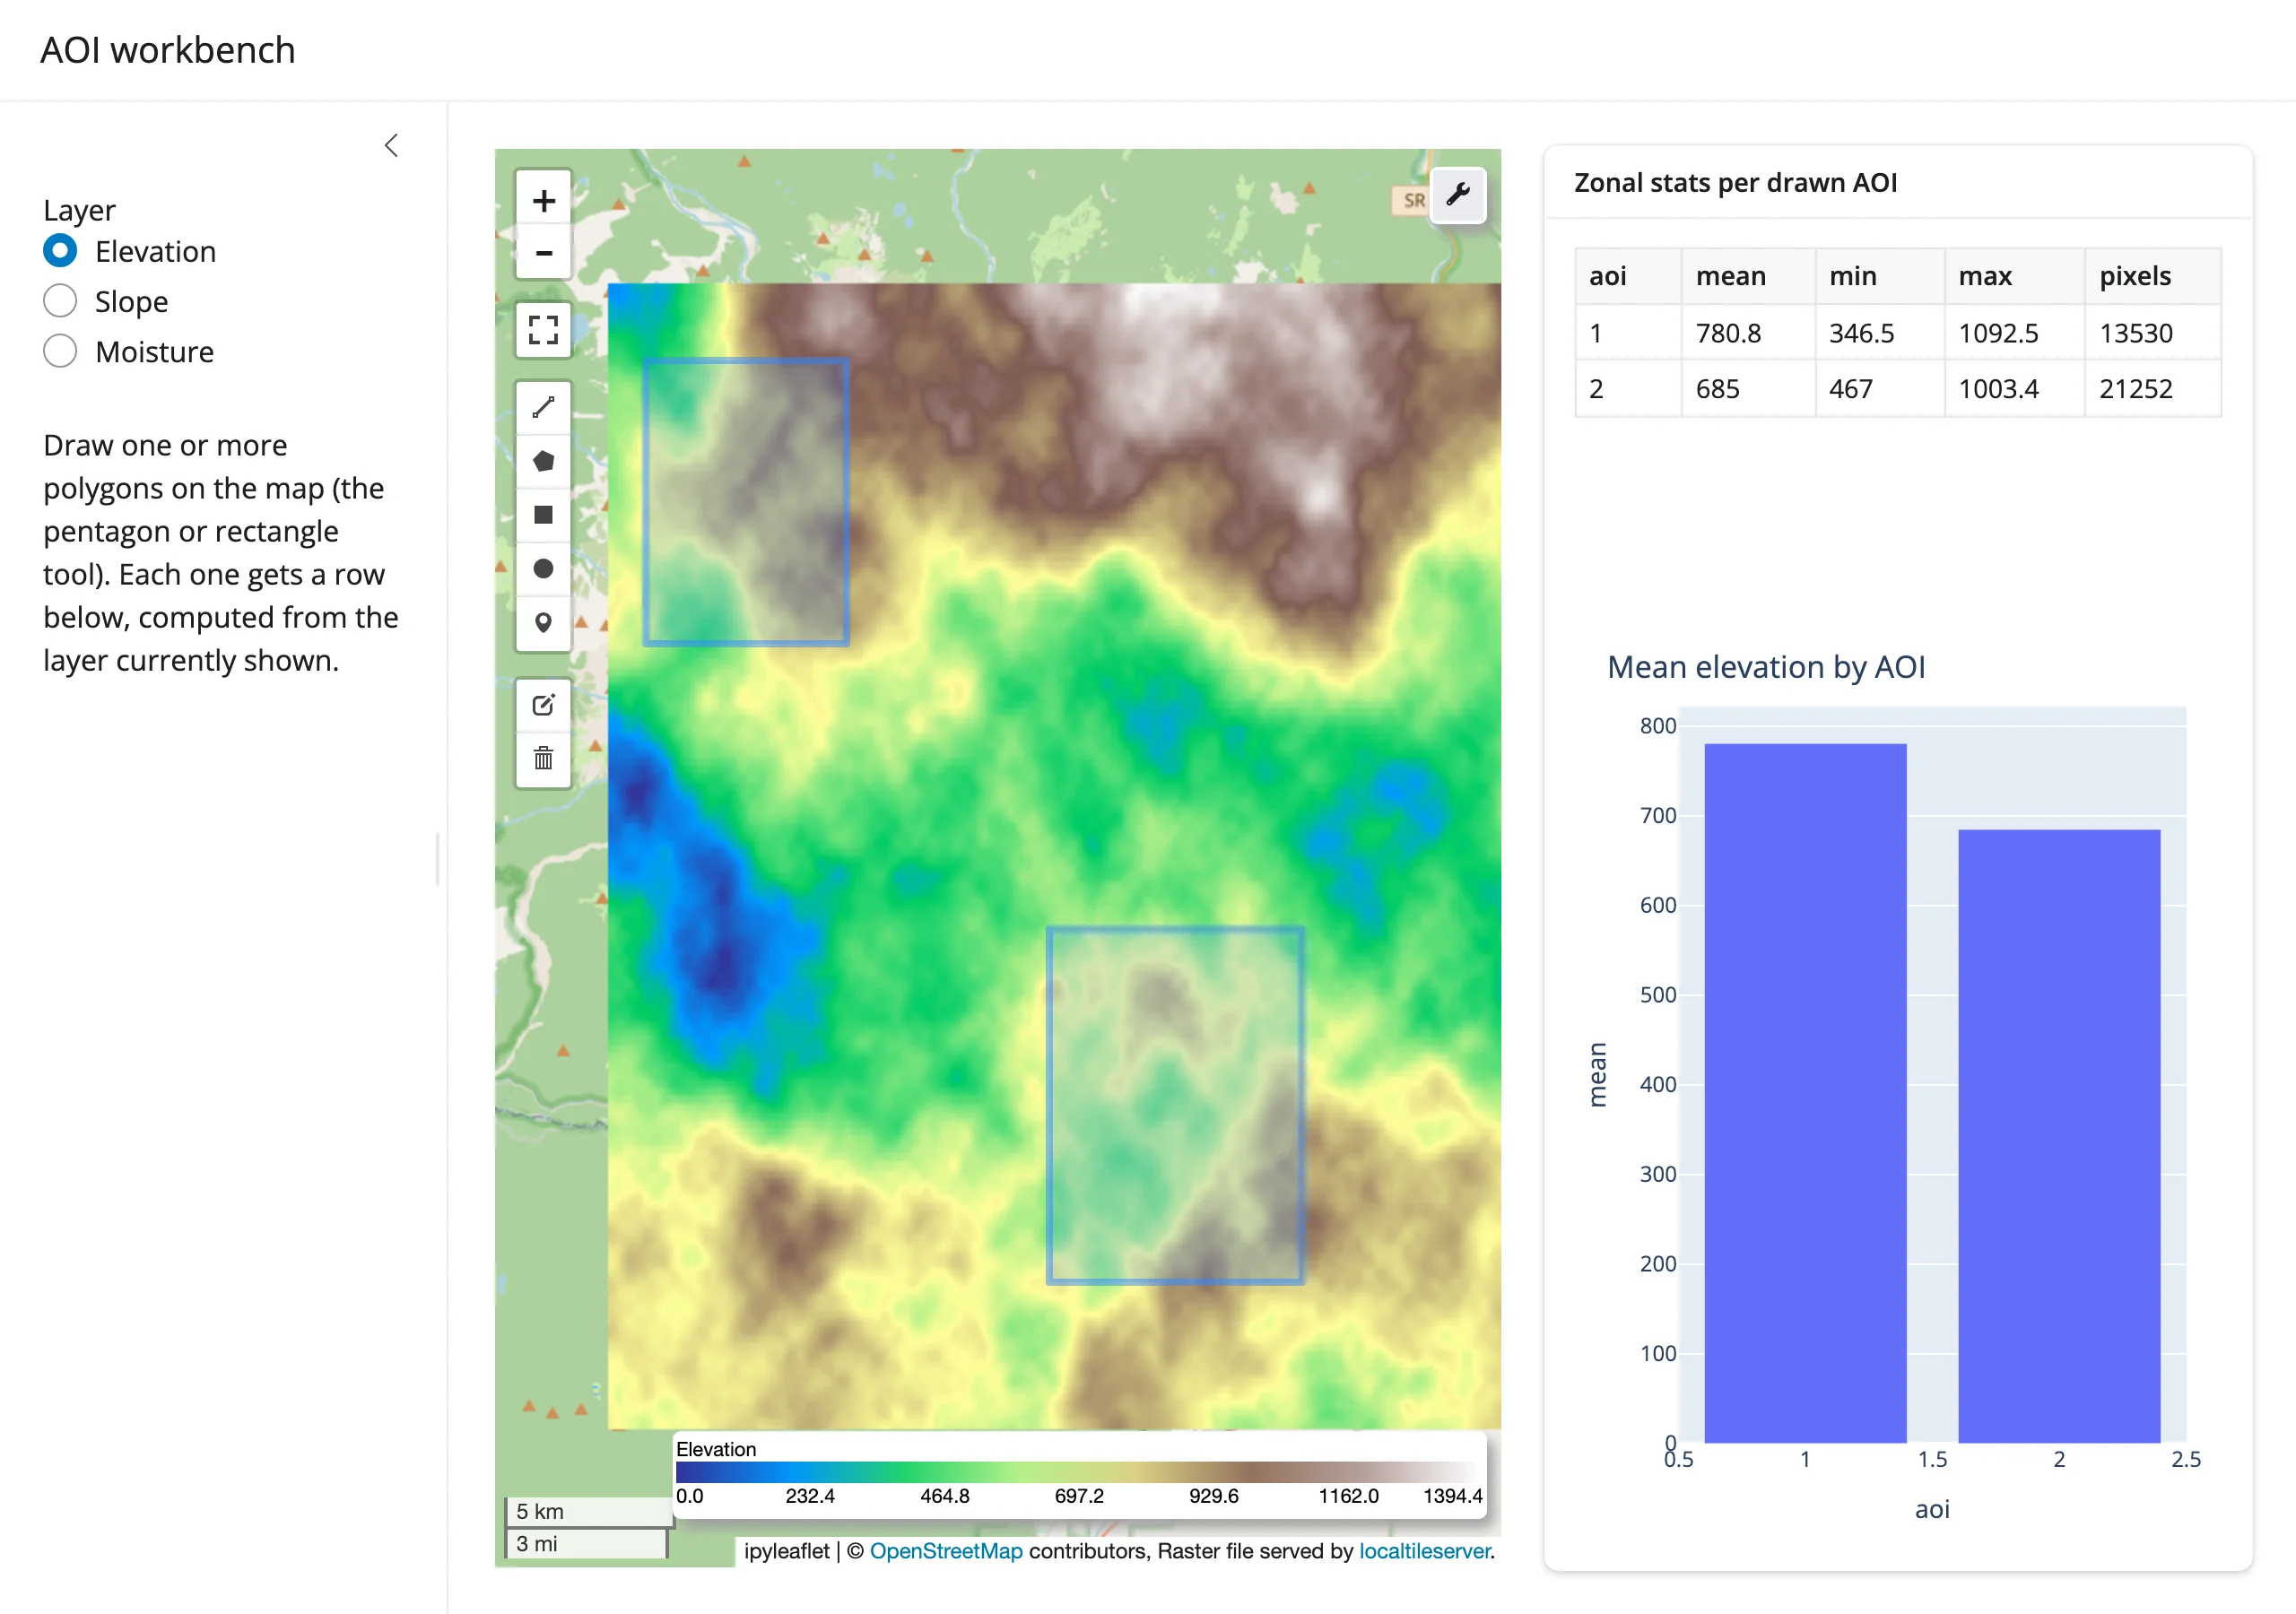
Draw multiple areas of interest over a switchable multi-band raster (elevation/slope/moisture) and compare zonal statistics across them live, with a colorbar legend and a per-AOI bar chart – the GIS-analyst loop from drawn_features() extended to multiple AOIs and bands.
Learn more
- leafmap documentation and its example notebooks
- leafmap API reference (per-backend method docs)
../ipyleaflet/guide.md– the default backend’s own API and accessors, in depth../maplibre/guide.md– vector tiles, globe projection, and deck.gl layers vialeafmap.maplibregl.Map.add_deck_layers()../localtileserver/guide.md– how local raster tiles reach a deployed app../plotly/guide.md– for the plotly backend’s own accessors andreactive_read()traits