Altair
Altair is the Python API for Vega-Lite, the declarative grammar of interactive graphics built by the University of Washington Interactive Data Lab. You describe a chart as data plus encodings plus marks, and Vega-Lite compiles it to a complete interactive visualization, including its own grammar for selections: brushes, clicks, legend picks, and parameter-bound widgets that live inside the chart.
@render_altair accepts either a plain alt.Chart (or any composed LayerChart, HConcatChart, VConcatChart, FacetChart, or RepeatChart) or an altair.JupyterChart you built yourself, and takes care of the parts that are awkward on your own: charts without an explicit size are set to fill their container, so they resize with cards, sidebars, and full-screen toggles; the chart renders once, even though a Shiny render function reruns on every input change the function reads.
The headline feature is two accessors: selected() and selected_rows(). Because Vega-Lite’s selections are already declared, named state (not ad hoc click events), there is no large menu of accessors to learn – one accessor reads any selection by name, and a second filters your data frame the same way Vega-Lite would, including the fiddly cases (half-open bins, timezones). What you get for free is Altair’s best trick: your chart is also an input, readable in any @render.* function, @reactive.calc, or @reactive.effect the way you’d read input.my_slider().
Pick Altair when the interaction is the product: linked brushing, legend filtering, parameter-driven styling, small-to-medium data, with minimal glue code. Pick plotly for larger WebGL scatter plots, 3D, maps, or a built-in zoom/pan/lasso toolbar. Pick bokeh if you’re already invested in its event model. Altair’s own grammar also means a lot of linking never needs Python at all – see “Coordinating multiple views” below for exactly where the line falls.
Installation
pip install 'shinywidgets[altair]'This installs altair and vl-convert-python (needed for JupyterChart.enable_offline(), below). The sample datasets used below (cars, seattle_weather) come from altair.datasets, which is bundled with altair itself – nothing else to install.
Quick start
import altair as alt
from altair.datasets import data
from shiny.express import ui

from shinywidgets import render_altair

ui.page_opts(title="Cars", fillable=True)

cars = data.cars()


@render_altair
def plot():
    return (
        alt.Chart(cars)
        .mark_circle()
        .encode(x="Horsepower:Q", y="Miles_per_Gallon:Q", color="Origin:N")
    )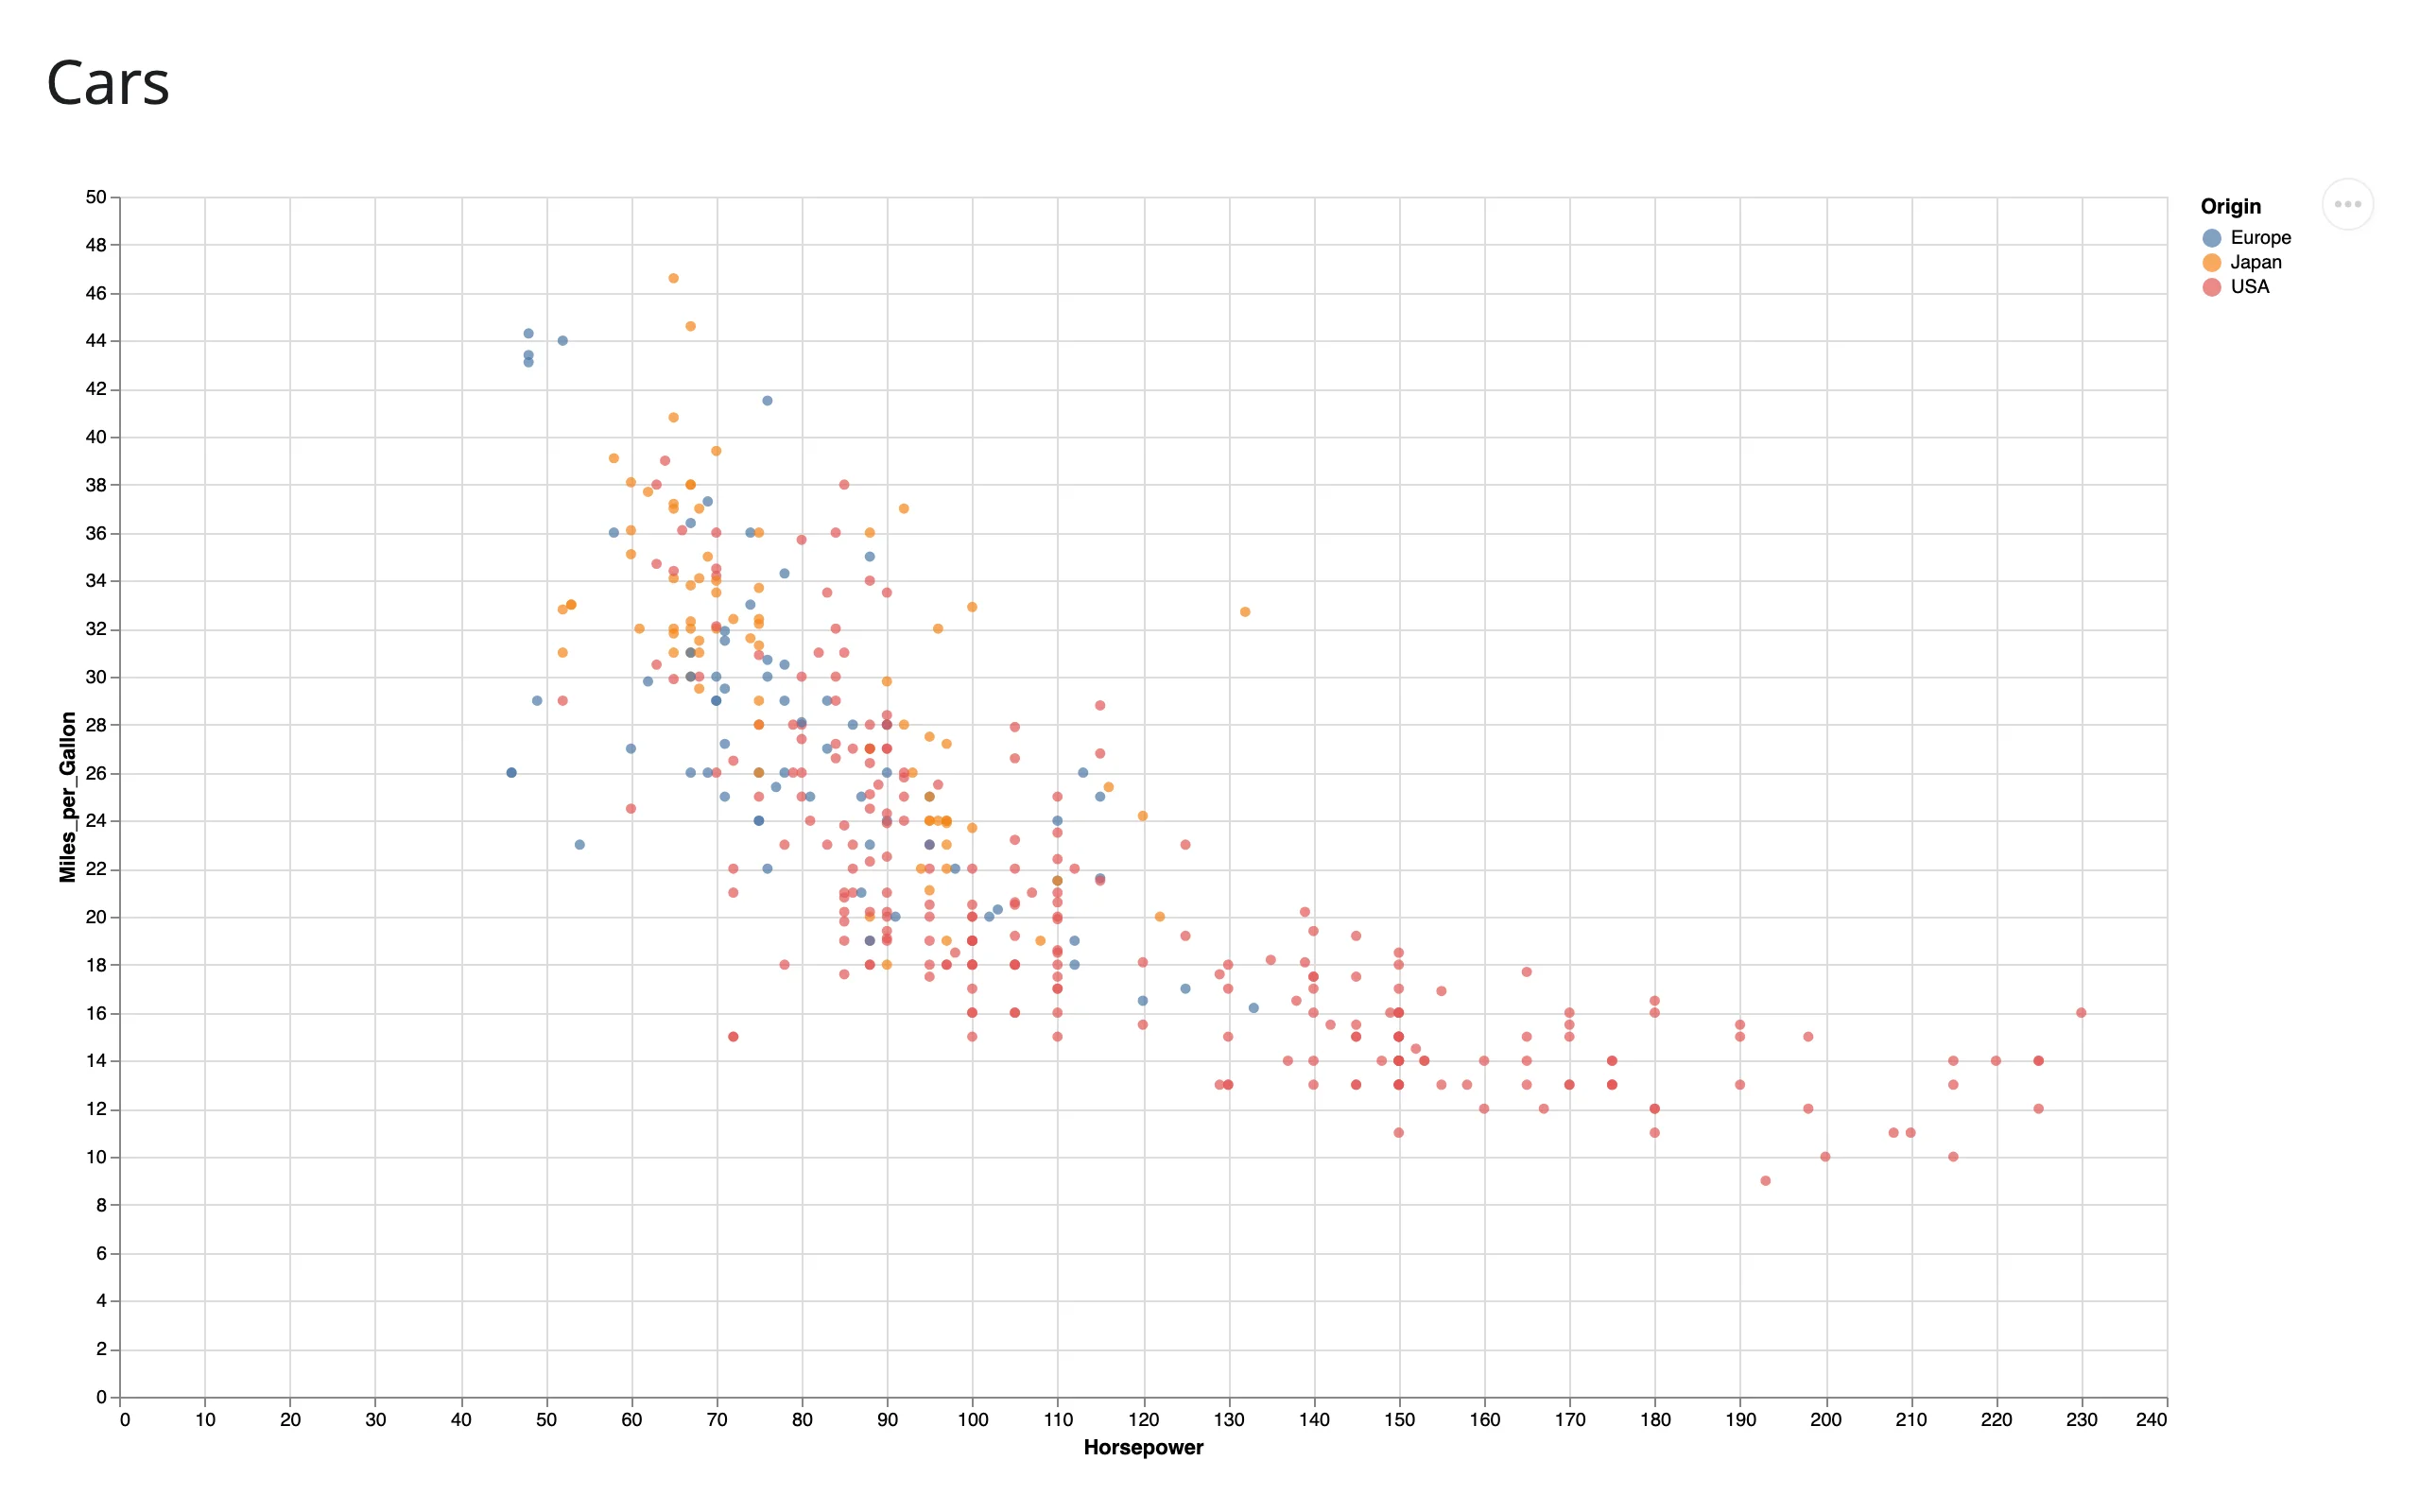
No layout kwargs, no sizing calls: the chart fills its card because the output has no explicit height.
What you can build
Altair’s encoding grammar covers most of what you’d reach for a plotting library to do. Two highlights that are easy to miss and look great in a dashboard:
Layers and small multiples. + layers two charts (e.g., points and a reference rule) on shared axes; .facet() repeats an encoding across small multiples. Both are ordinary Altair, rendered as-is by render_altair.
import altair as alt
from altair.datasets import data
from shiny.express import ui

from shinywidgets import render_altair

ui.page_opts(title="Layers and small multiples", fillable=True)

weather = data.seattle_weather()

with ui.layout_columns():
    with ui.card(full_screen=True):
        ui.card_header("Points layered with a mean rule")

        @render_altair
        def layered():
            points = (
                alt.Chart(weather)
                .mark_circle(opacity=0.4)
                .encode(x="date:T", y="temp_max:Q", color="weather:N")
            )
            mean_rule = alt.Chart(weather).mark_rule(color="black").encode(y="mean(temp_max):Q")
            return points + mean_rule

    with ui.card(full_screen=True):
        ui.card_header("Small multiples with facet()")

        @render_altair
        def faceted():
            return (
                alt.Chart(weather)
                .mark_bar()
                .encode(x="temp_max:Q", y="count()", color="weather:N")
                .properties(width=140, height=120)
                .facet("weather:N", columns=3)
            )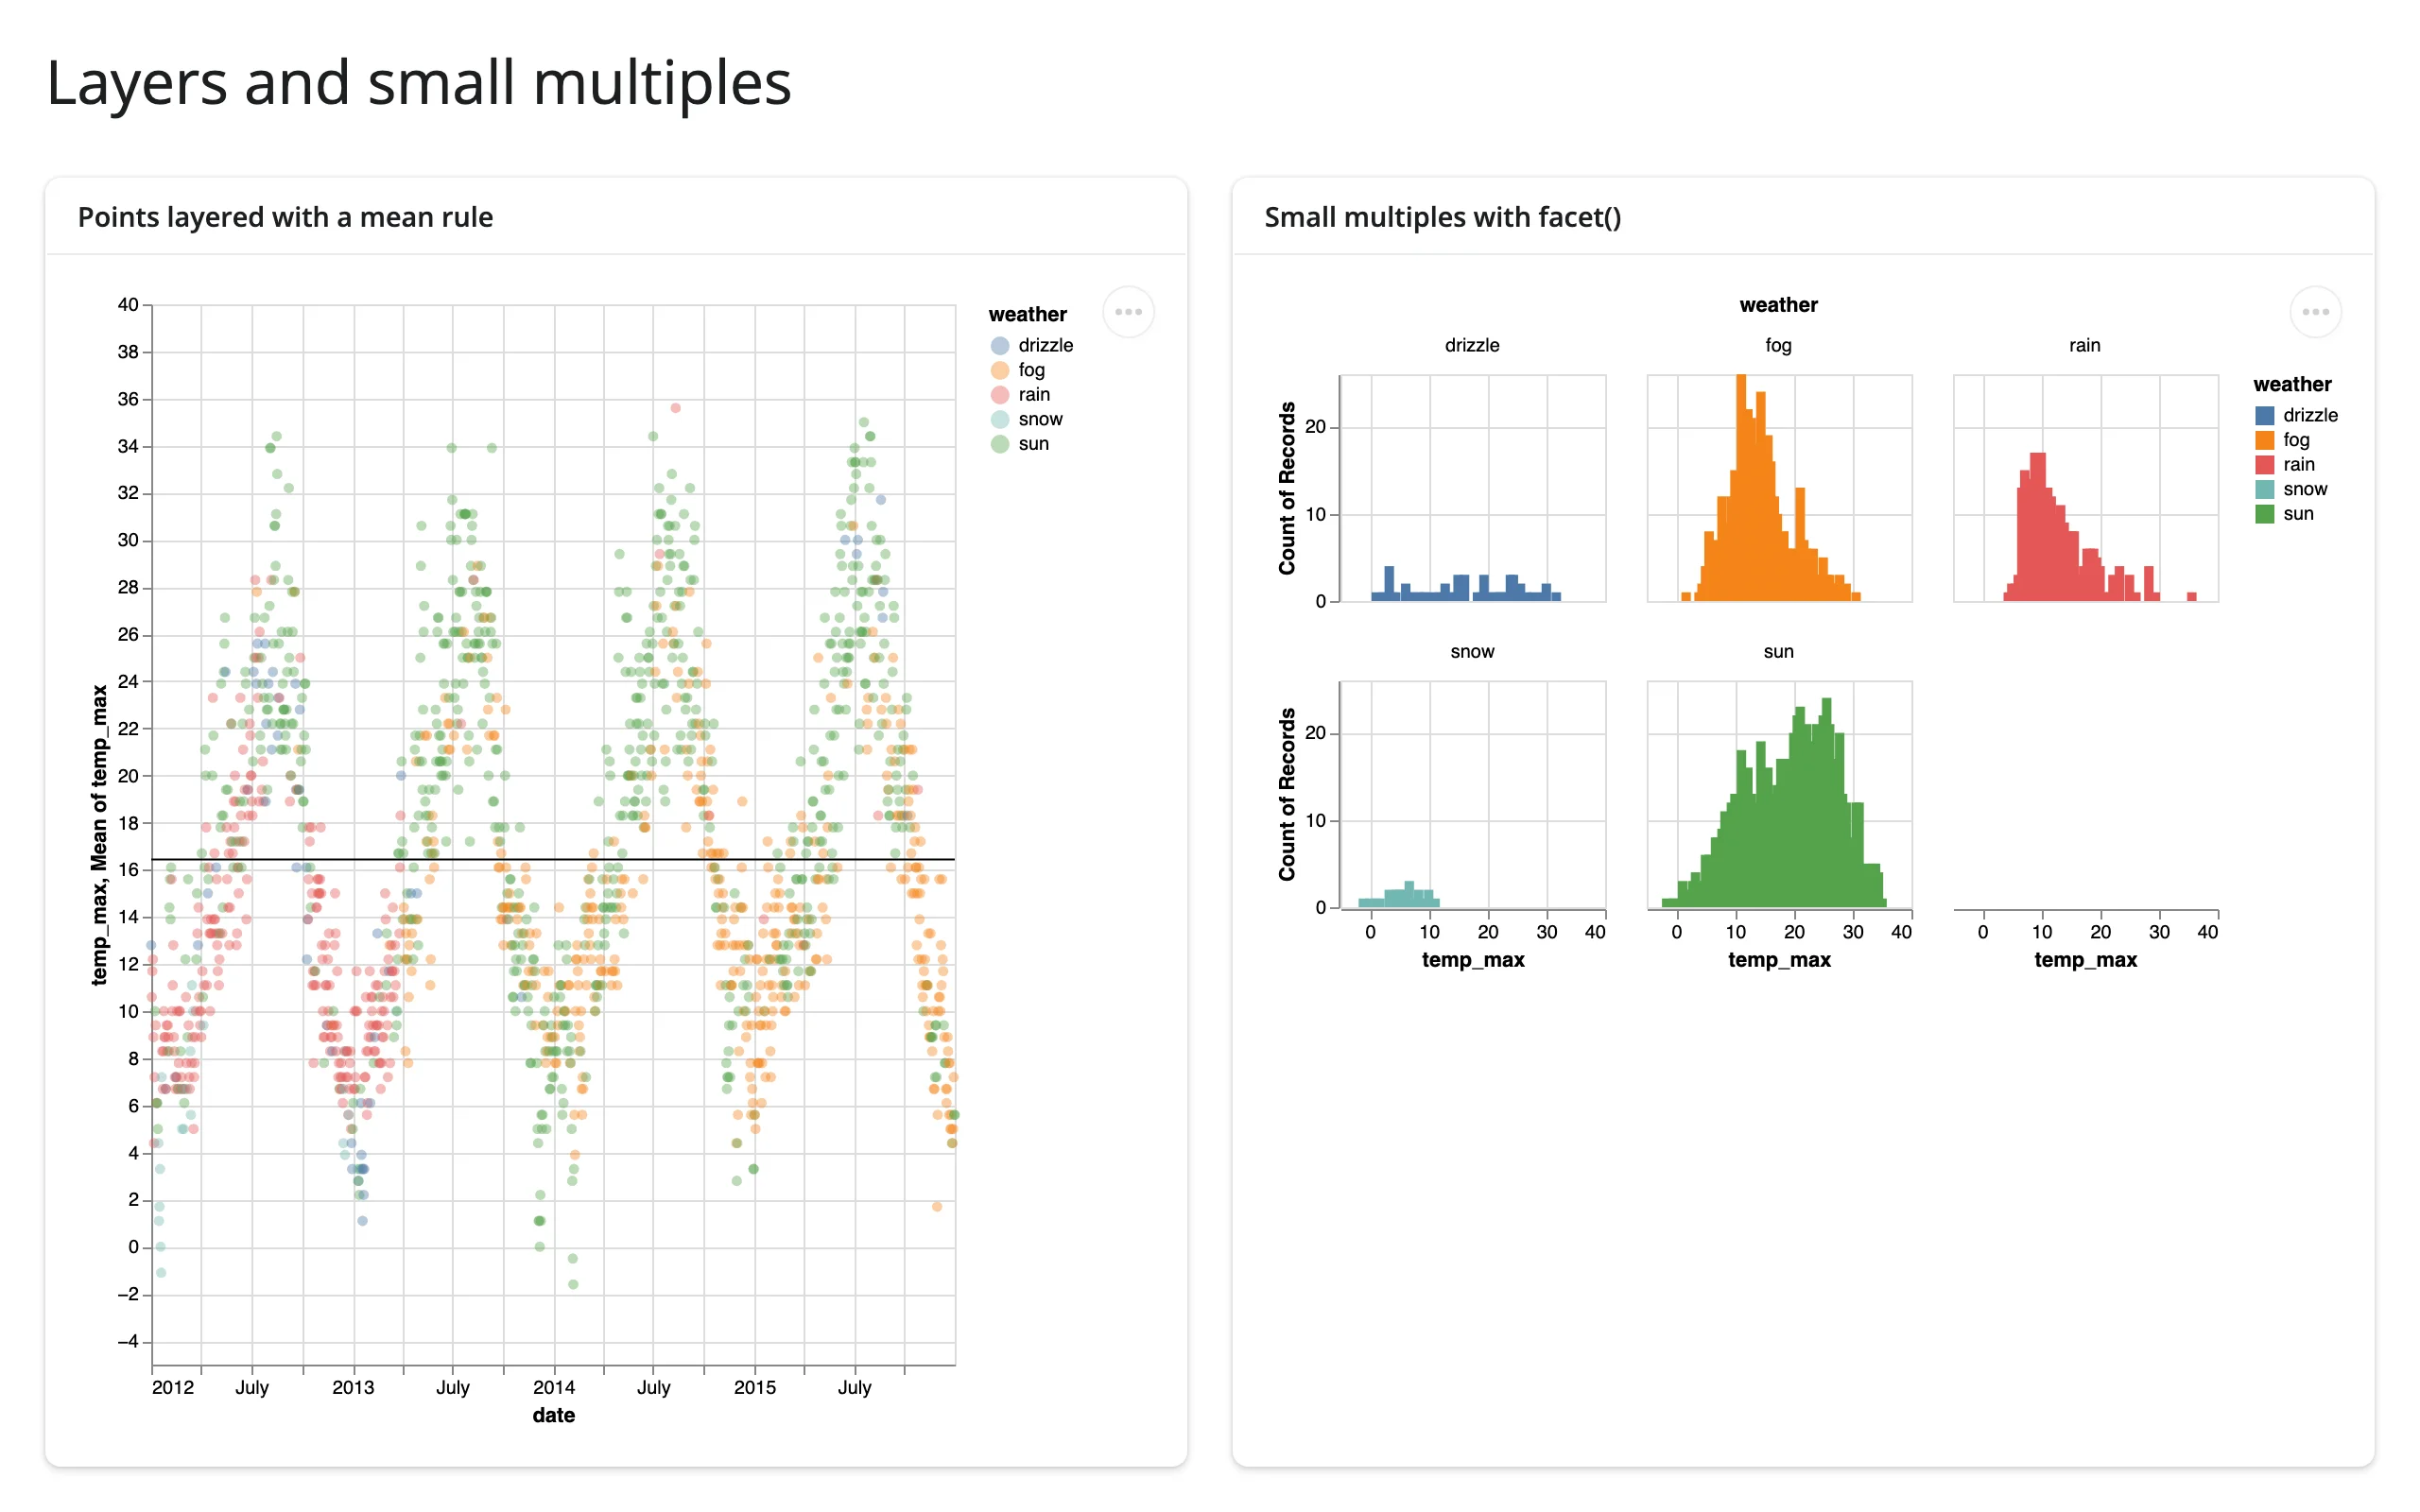
Note the facet grid keeps its own natural size rather than filling the card – more on that in “Layout and sizing”. Data: altair.datasets’ seattle_weather (four years of real NOAA daily observations for Seattle; the same dataset reappears in the gallery below).
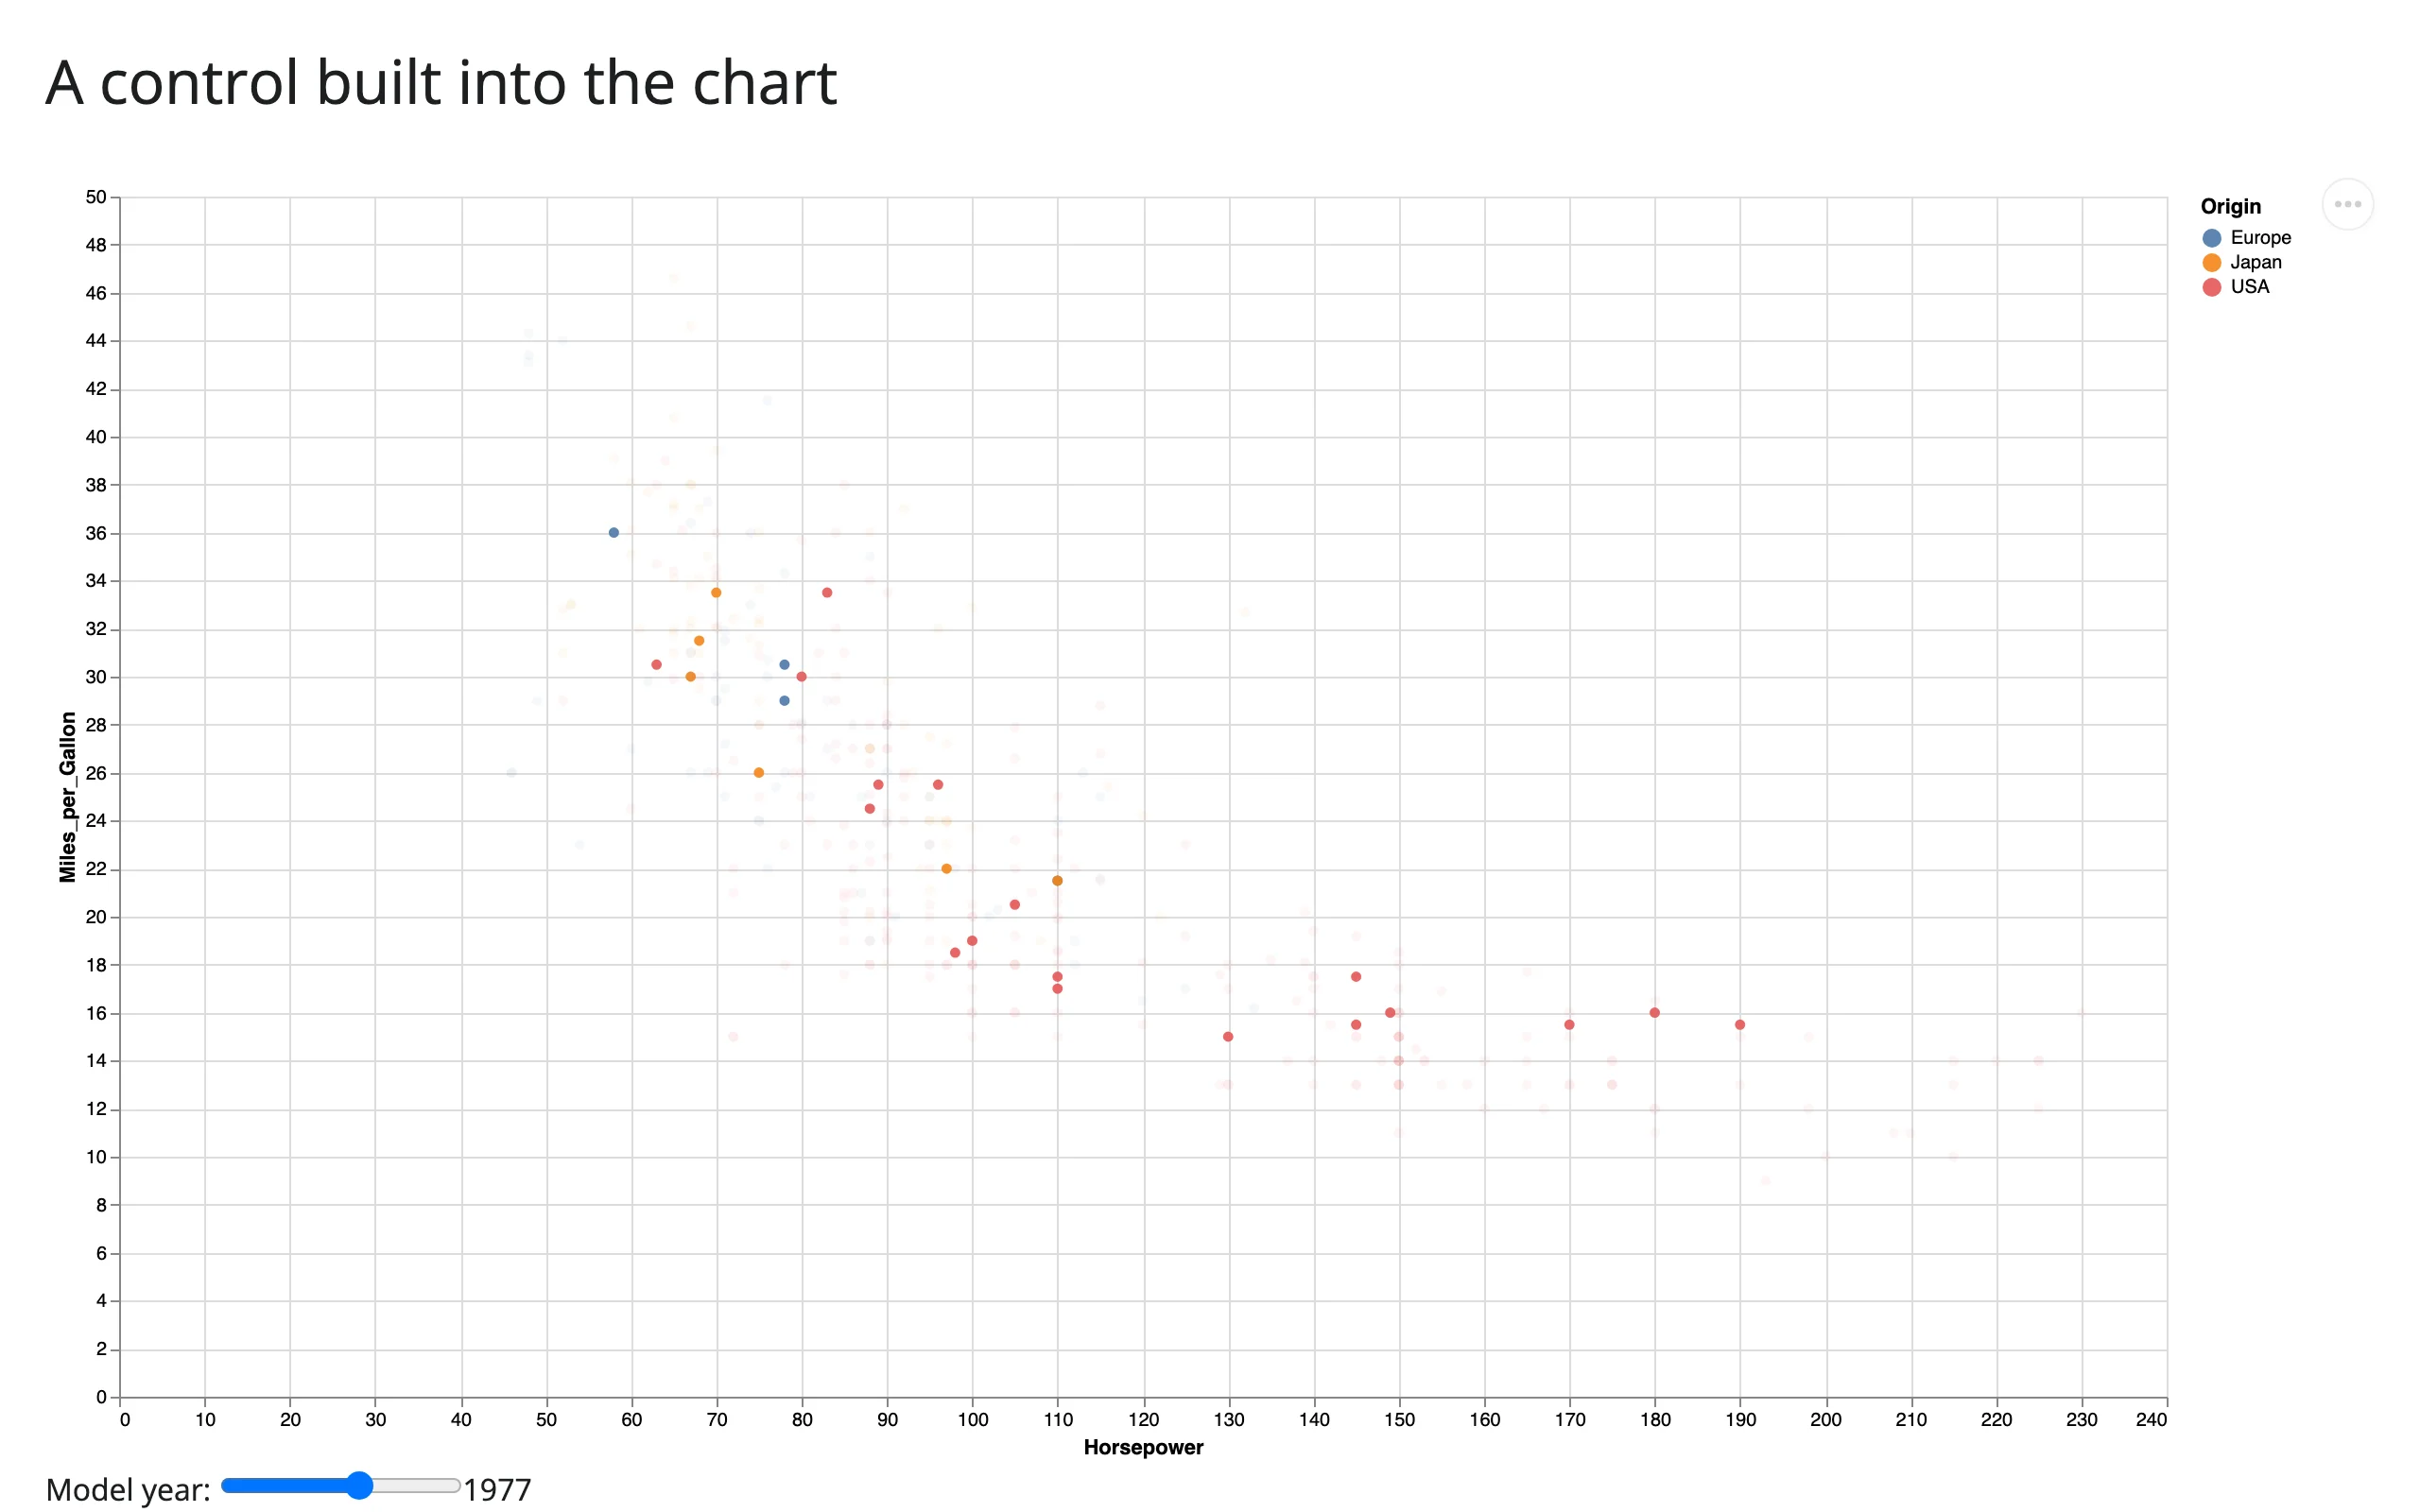
Controls built into the chart. alt.param(bind=alt.binding_range(...)) (or binding_select, binding_checkbox, binding_radio) puts an HTML control under the chart that’s wired directly into Vega-Lite’s expression language. This needs no Shiny input and no Python round trip at all.
import altair as alt
from altair.datasets import data
from shiny.express import ui

from shinywidgets import render_altair

ui.page_opts(title="A control built into the chart", fillable=True)

cars = data.cars()


@render_altair
def chart():
    year_slider = alt.binding_range(min=1970, max=1982, step=1, name="Model year: ")
    year = alt.param(name="year", value=1977, bind=year_slider)
    return (
        alt.Chart(cars)
        .mark_circle()
        .encode(
            x="Horsepower:Q",
            y="Miles_per_Gallon:Q",
            color="Origin:N",
            opacity=alt.condition("year(datum.Year) == year", alt.value(0.9), alt.value(0.05)),
        )
        .add_params(year)
    )
Before (year 1977) and after dragging the slider to 1982 – every car outside the chosen year fades, with no request to the server:
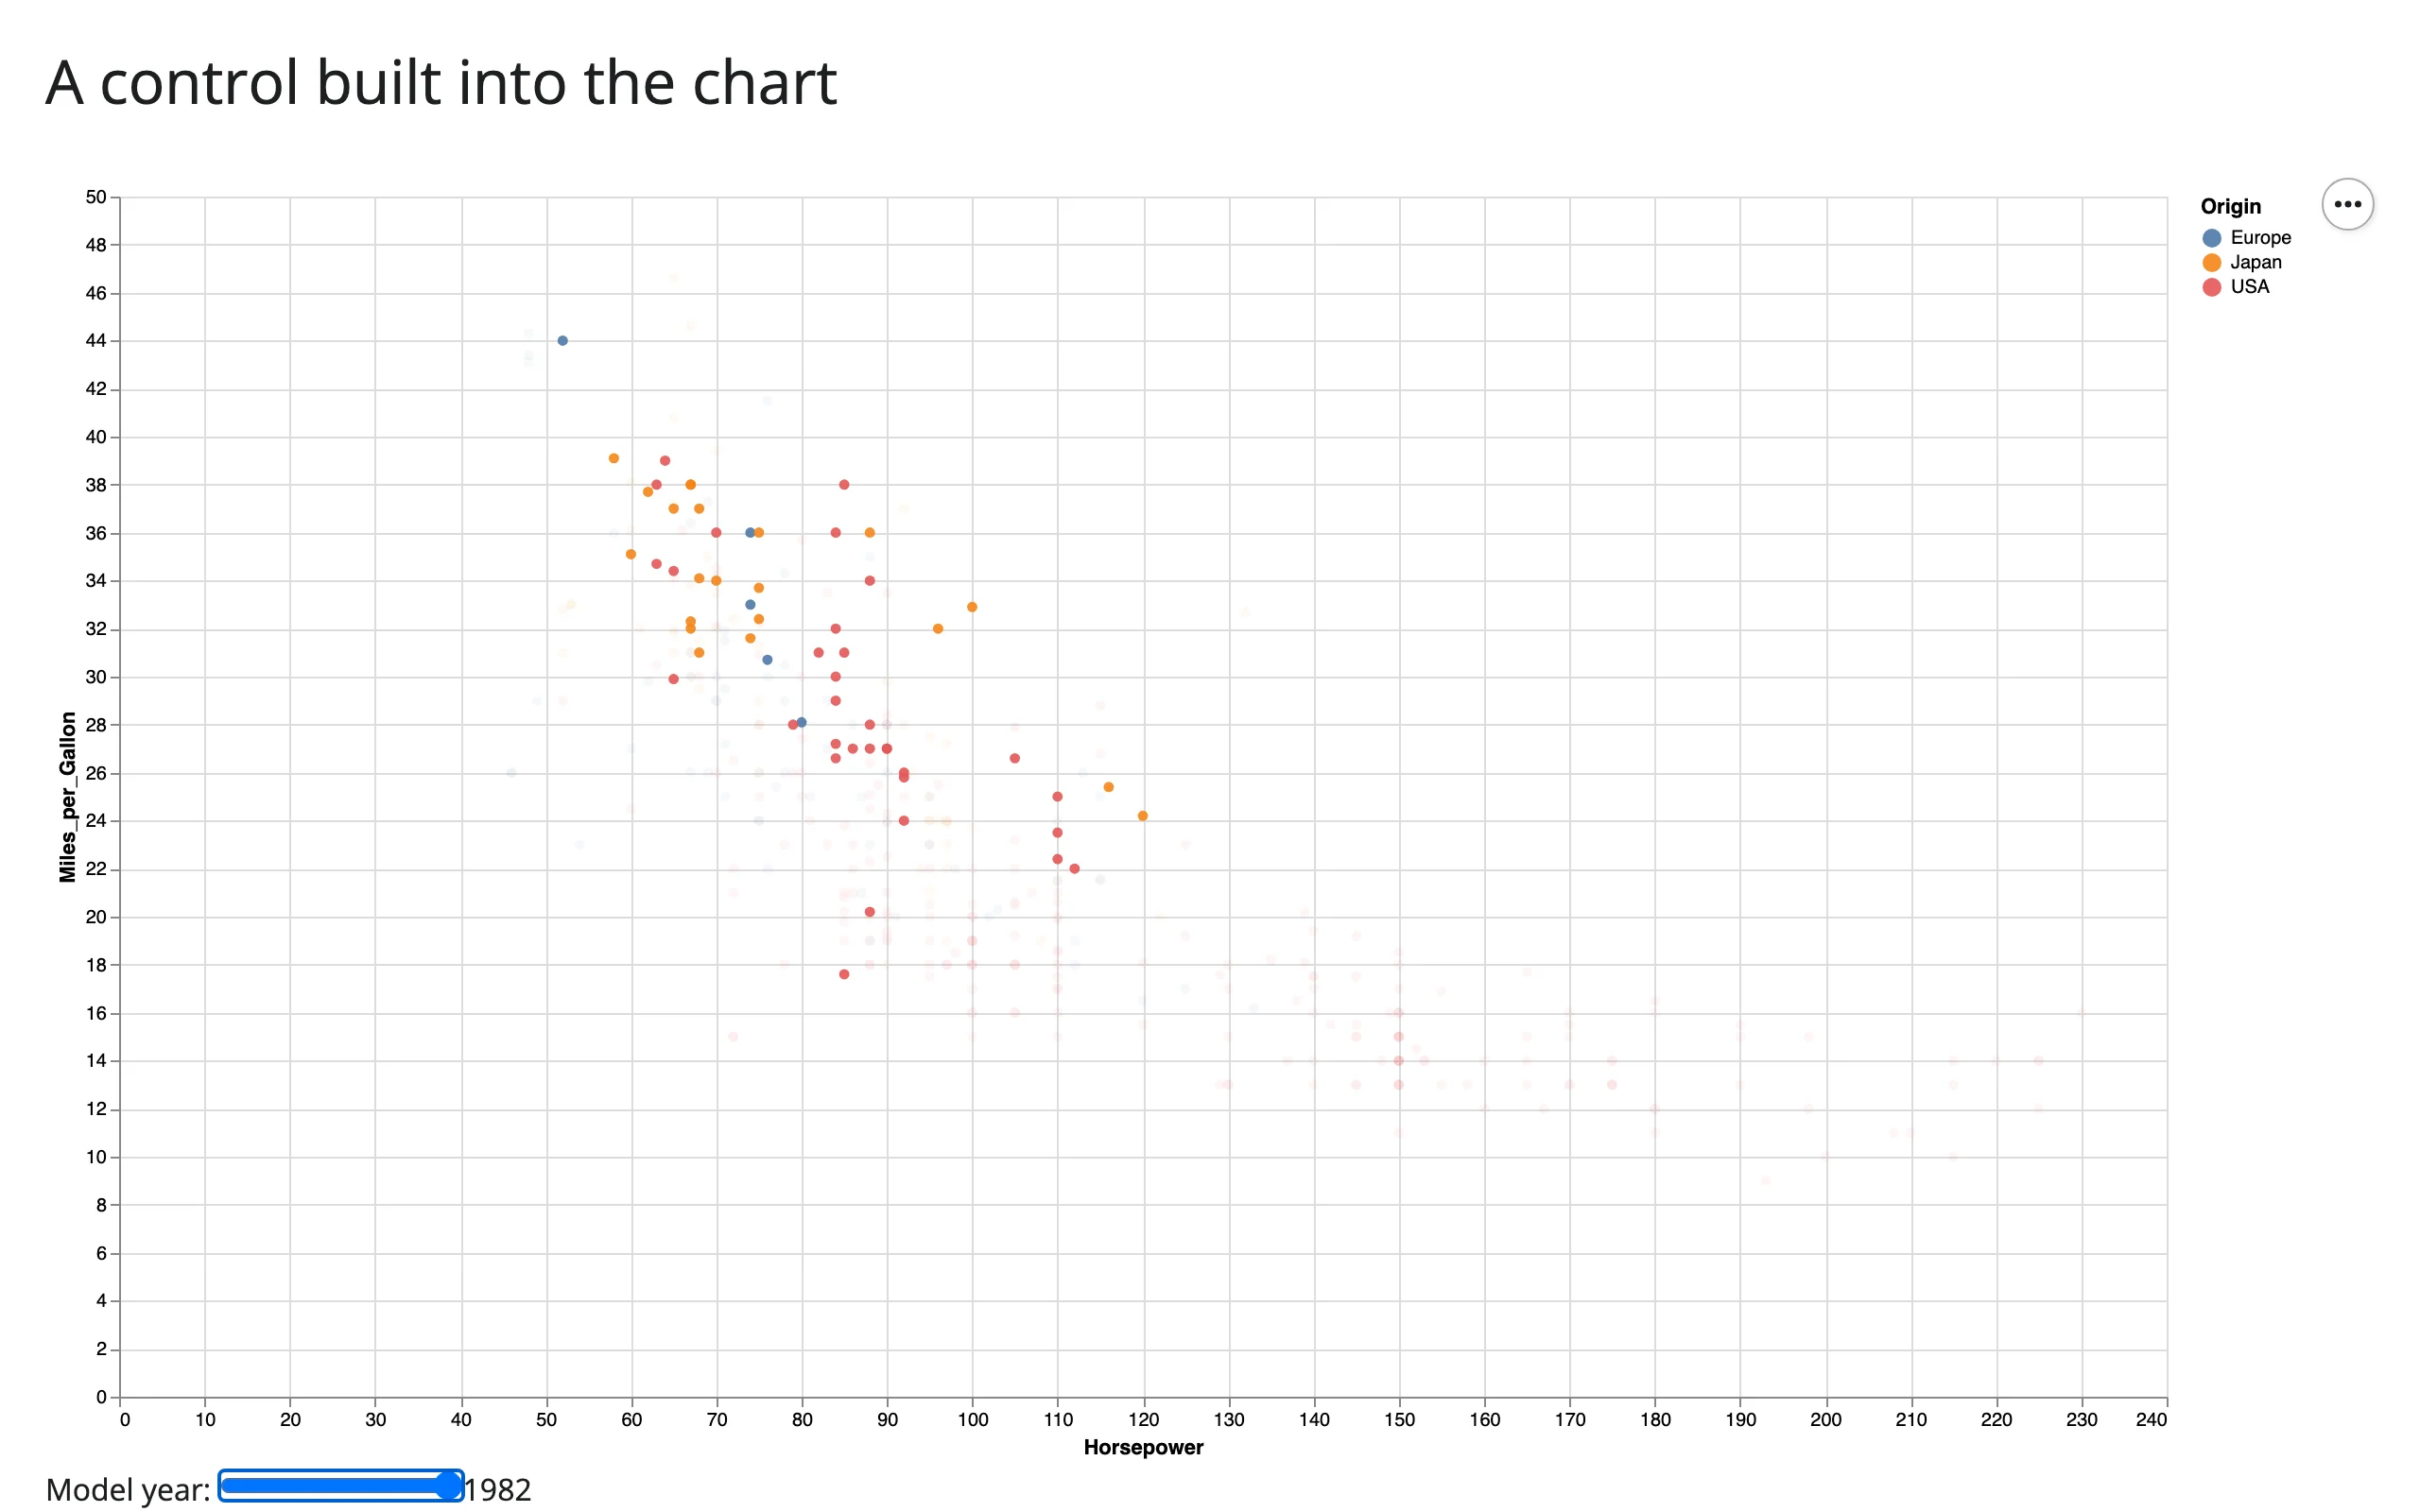
If you do want Python involved when this slider moves (to drive a computation Vega-Lite’s grammar can’t express), see “Beyond the accessors: reactive_read” below – the same param is readable from Python too.
Reacting to user interaction
A Vega-Lite selection is declared state, not a transient event: you name it when you add it to the chart (alt.selection_interval(name="brush"), alt.selection_point(name="pick")), and from then on the chart always has a current value for it, starting out empty. That’s why Altair collapses to just two accessors instead of a menu of event handlers.
Accessor reference
| Accessor | Returns | Before any interaction | Across re-render | Default rate policy |
|---|---|---|---|---|
selected(name=None) |
An IntervalSelection, PointSelection, or IndexSelection (altair.utils.selection) |
seeded: an empty selection, never None |
re-seeded – a new chart’s named selection starts empty again | debounce, 250 ms |
selected_rows(name=None, df=None) |
A frame of the matching rows, same type as df (pandas or polars) |
seeded: empty frame | re-seeded (follows selected()) |
follows selected(); no separate rate limit |
name can be omitted when the chart has exactly one selection; with more than one, you must name which one you want (see “Multiple named selections” below). Always give your selections explicit names – Altair’s auto-generated ones (param_3, …) change on every re-render, which would silently break selected("param_3") the next time your render function runs.
Unlike renderers whose accessors start at None until the user interacts, selected() attaches already seeded (an empty selection) the moment the chart renders – there’s no warm-up and no None to guard against. You don’t need req() to wait for it the way you would for most other renderers’ accessors – it’s always safe to call inside a @render.* function. What you usually want to guard instead is the emptiness of the result, e.g. if len(rows) == 0: ....
Interval (brush) selections
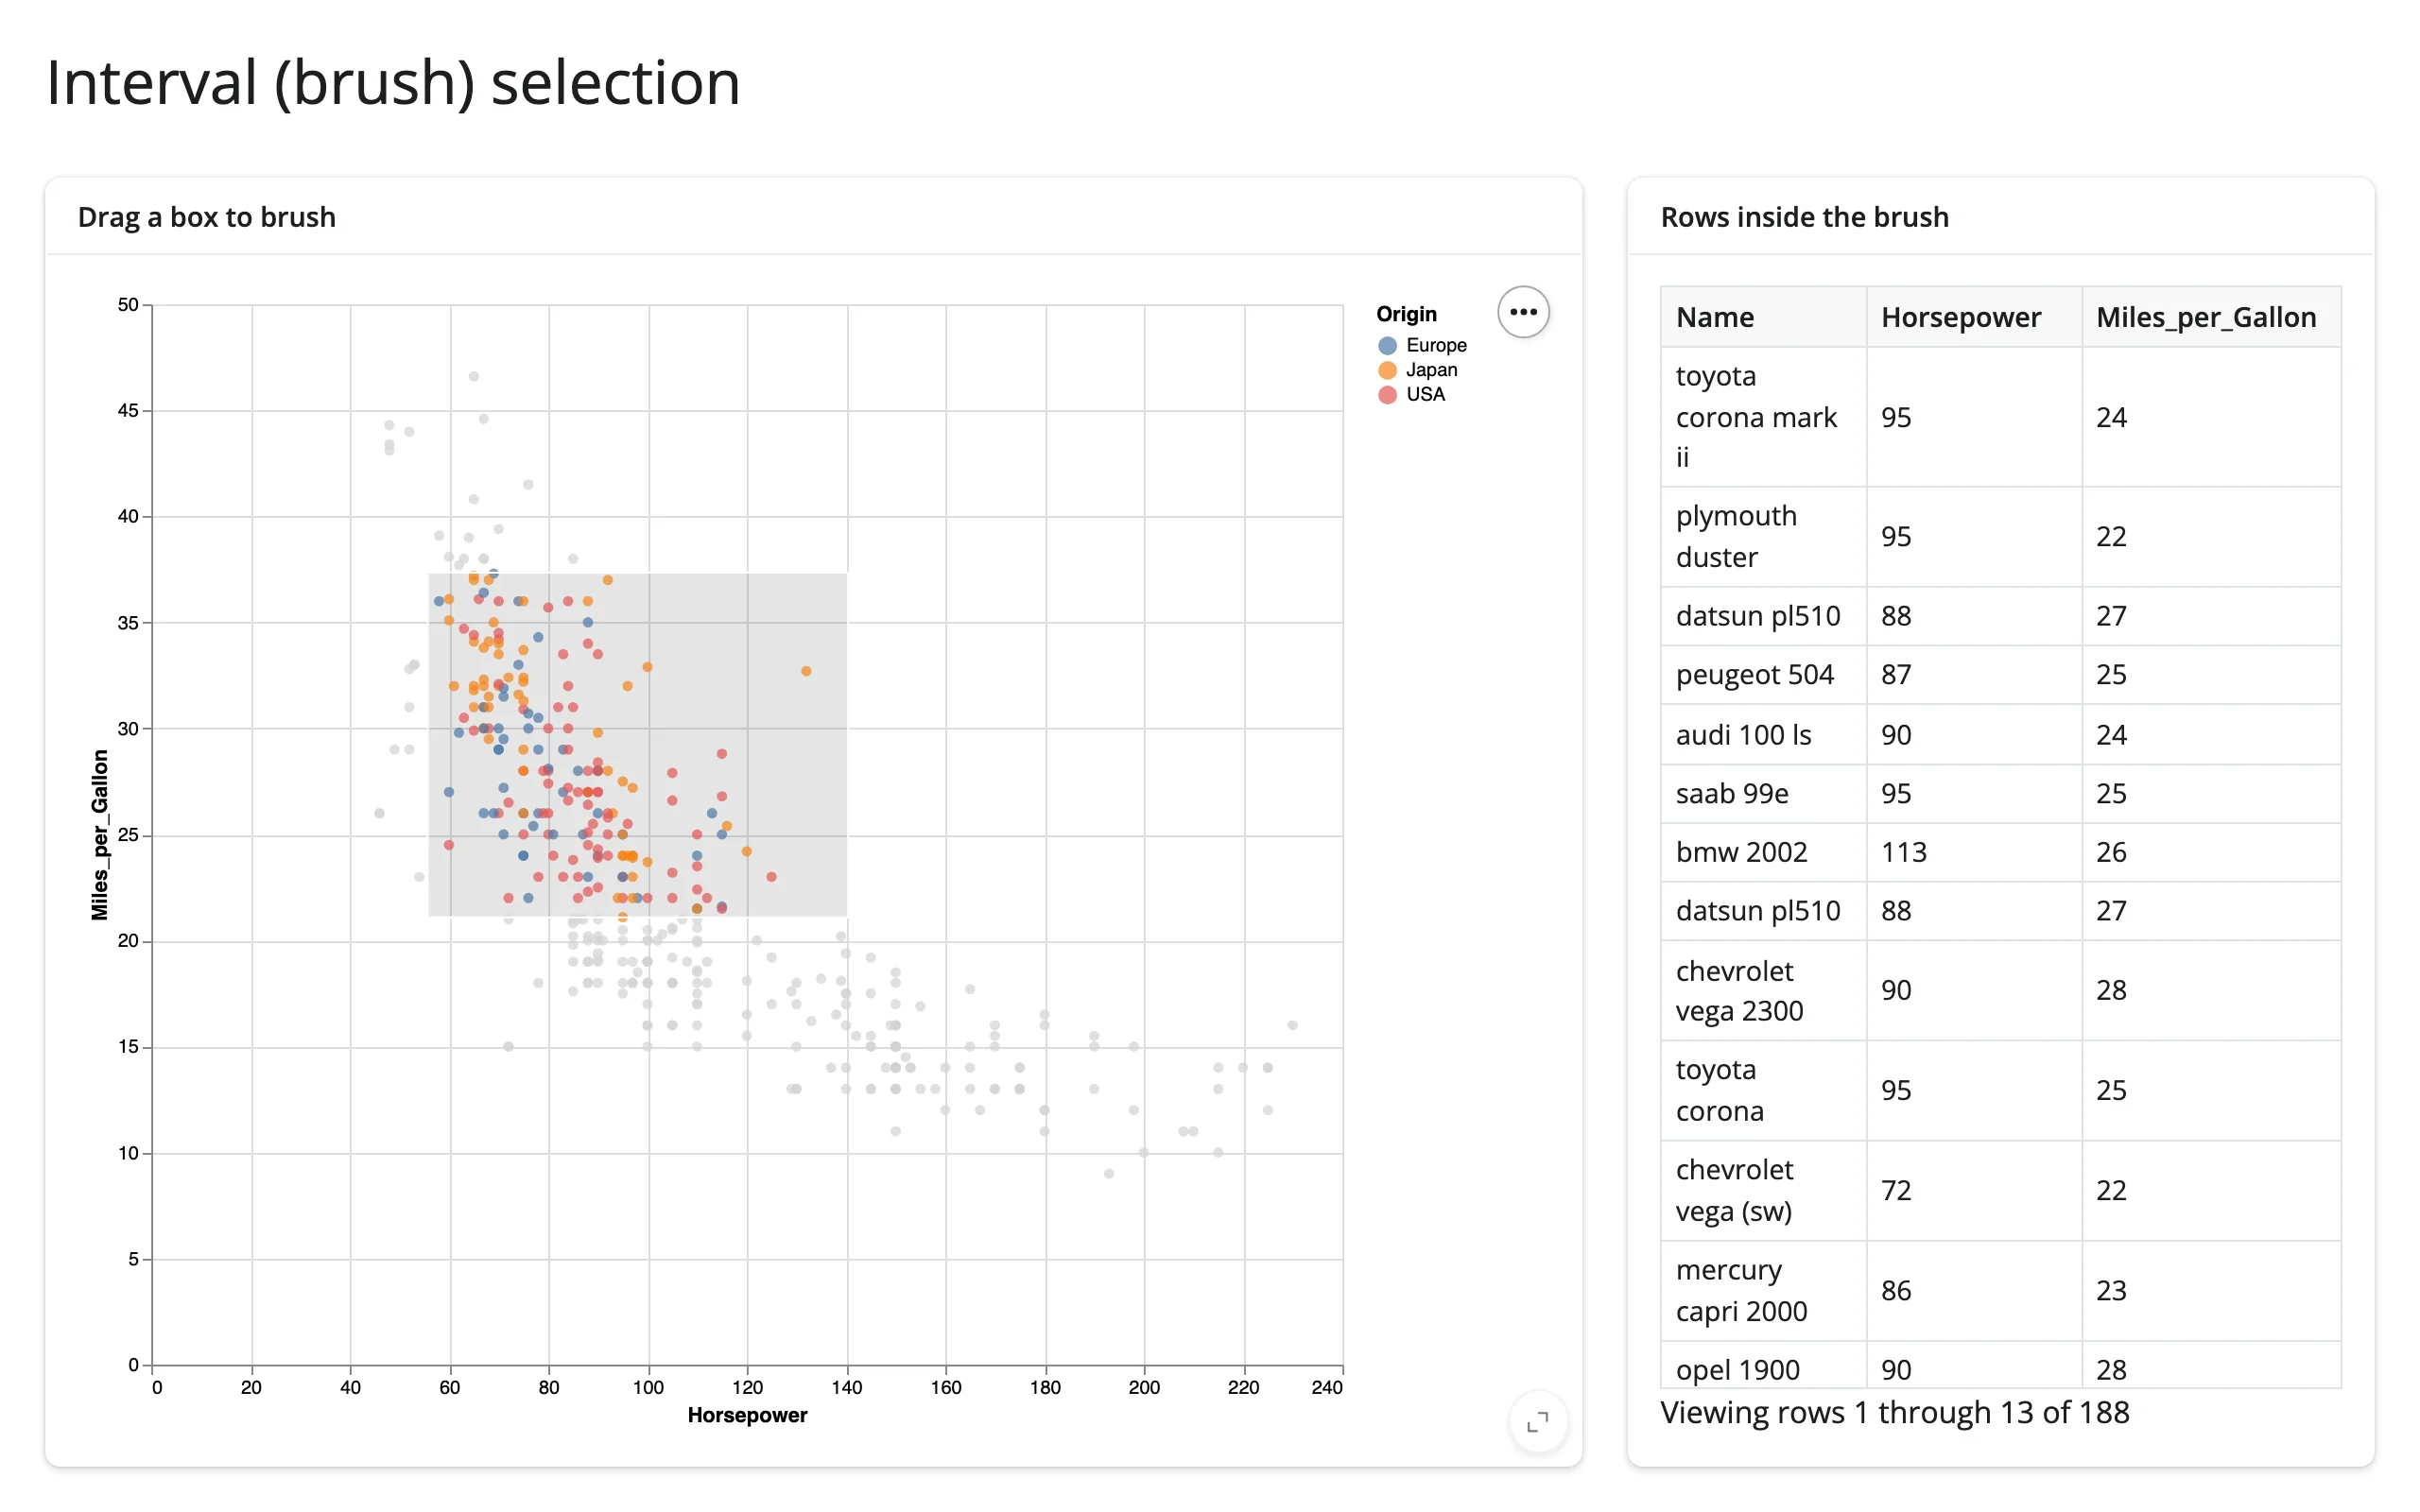
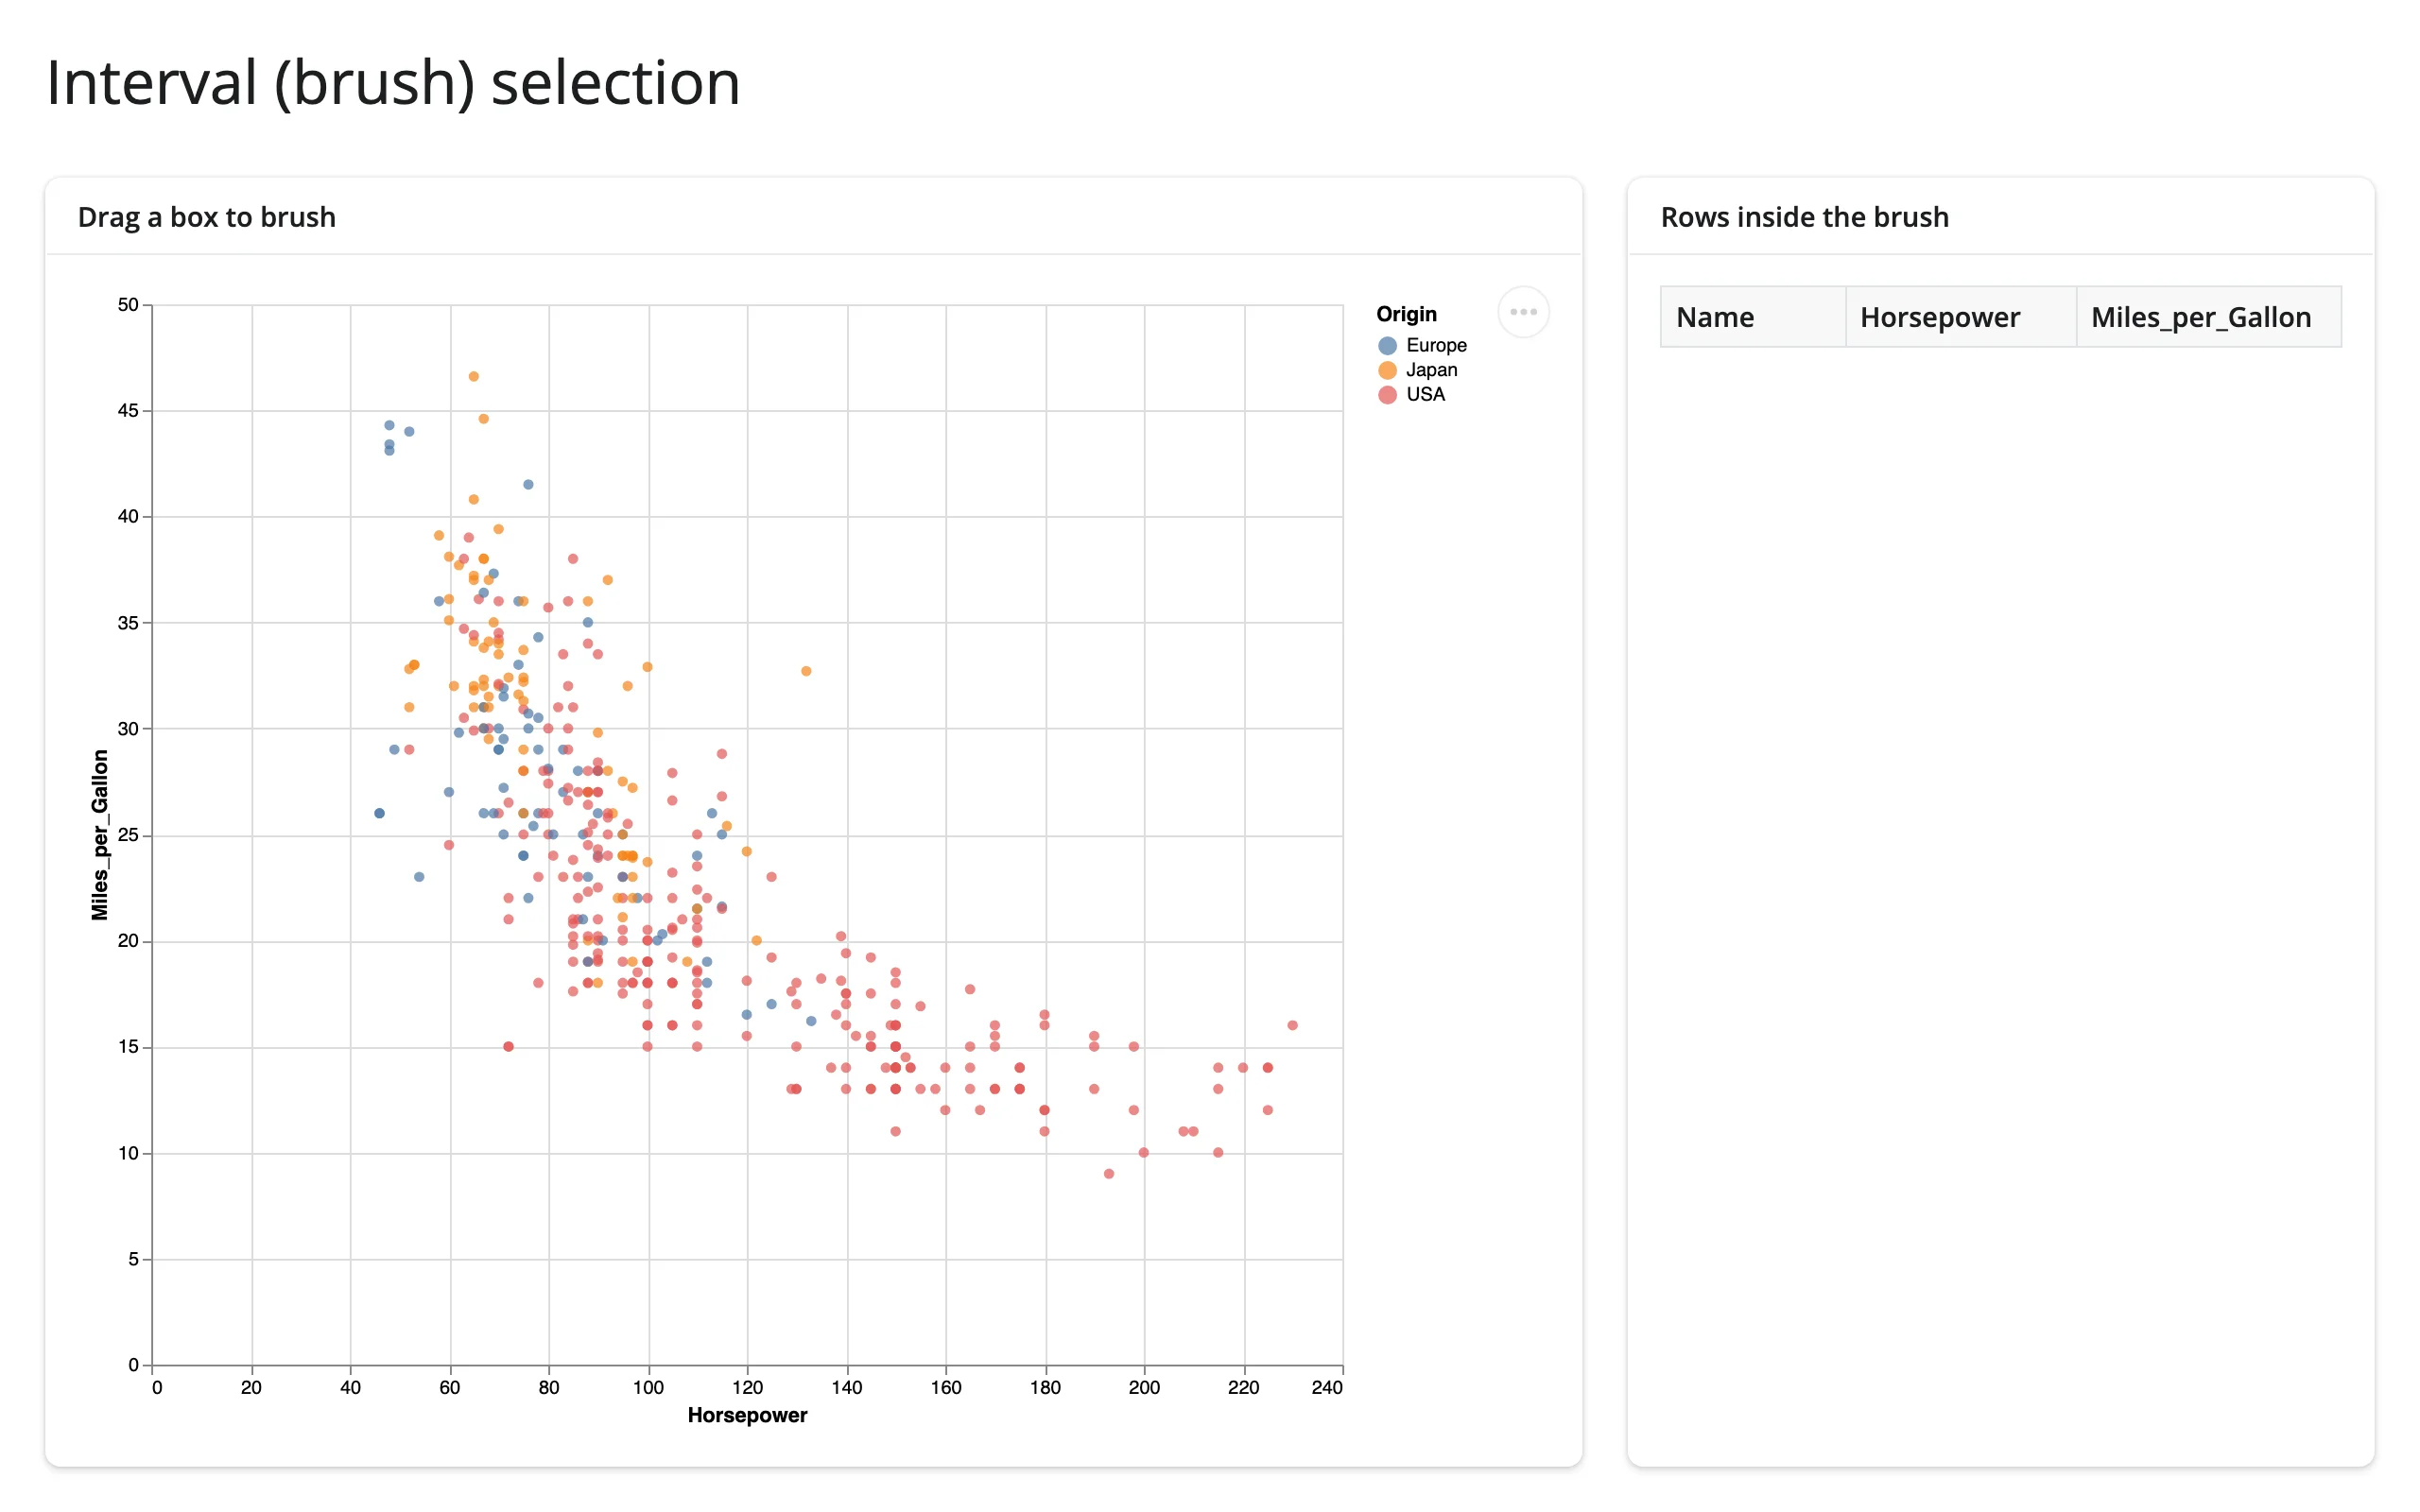
Dragging a box (or, with encodings=["x"], a 1-D range) is the most common Altair interaction. The empty selection filters to zero rows, not “everything,” so a @render.data_frame can consume selected_rows() directly without checking for None:
import altair as alt
from altair.datasets import data
from shiny.express import render, ui

from shinywidgets import render_altair

ui.page_opts(title="Interval (brush) selection", fillable=True)

cars = data.cars()

with ui.layout_columns(col_widths=[8, 4]):
    with ui.card(full_screen=True):
        ui.card_header("Drag a box to brush")

        @render_altair
        def scatter():
            brush = alt.selection_interval(name="brush")
            return (
                alt.Chart(cars)
                .mark_circle()
                .encode(
                    x="Horsepower:Q",
                    y="Miles_per_Gallon:Q",
                    color=alt.condition(brush, "Origin:N", alt.value("lightgray")),
                )
                .add_params(brush)
            )

    with ui.card(full_screen=True):
        ui.card_header("Rows inside the brush")

        @render.data_frame
        def brushed():
            return scatter.selected_rows("brush")[["Name", "Horsepower", "Miles_per_Gallon"]]
Before dragging, the table is empty (not full of every row); after dragging, it fills with exactly the brushed cars:
Point and index selections
A point selection has three distinct flavors, depending on how you construct it:
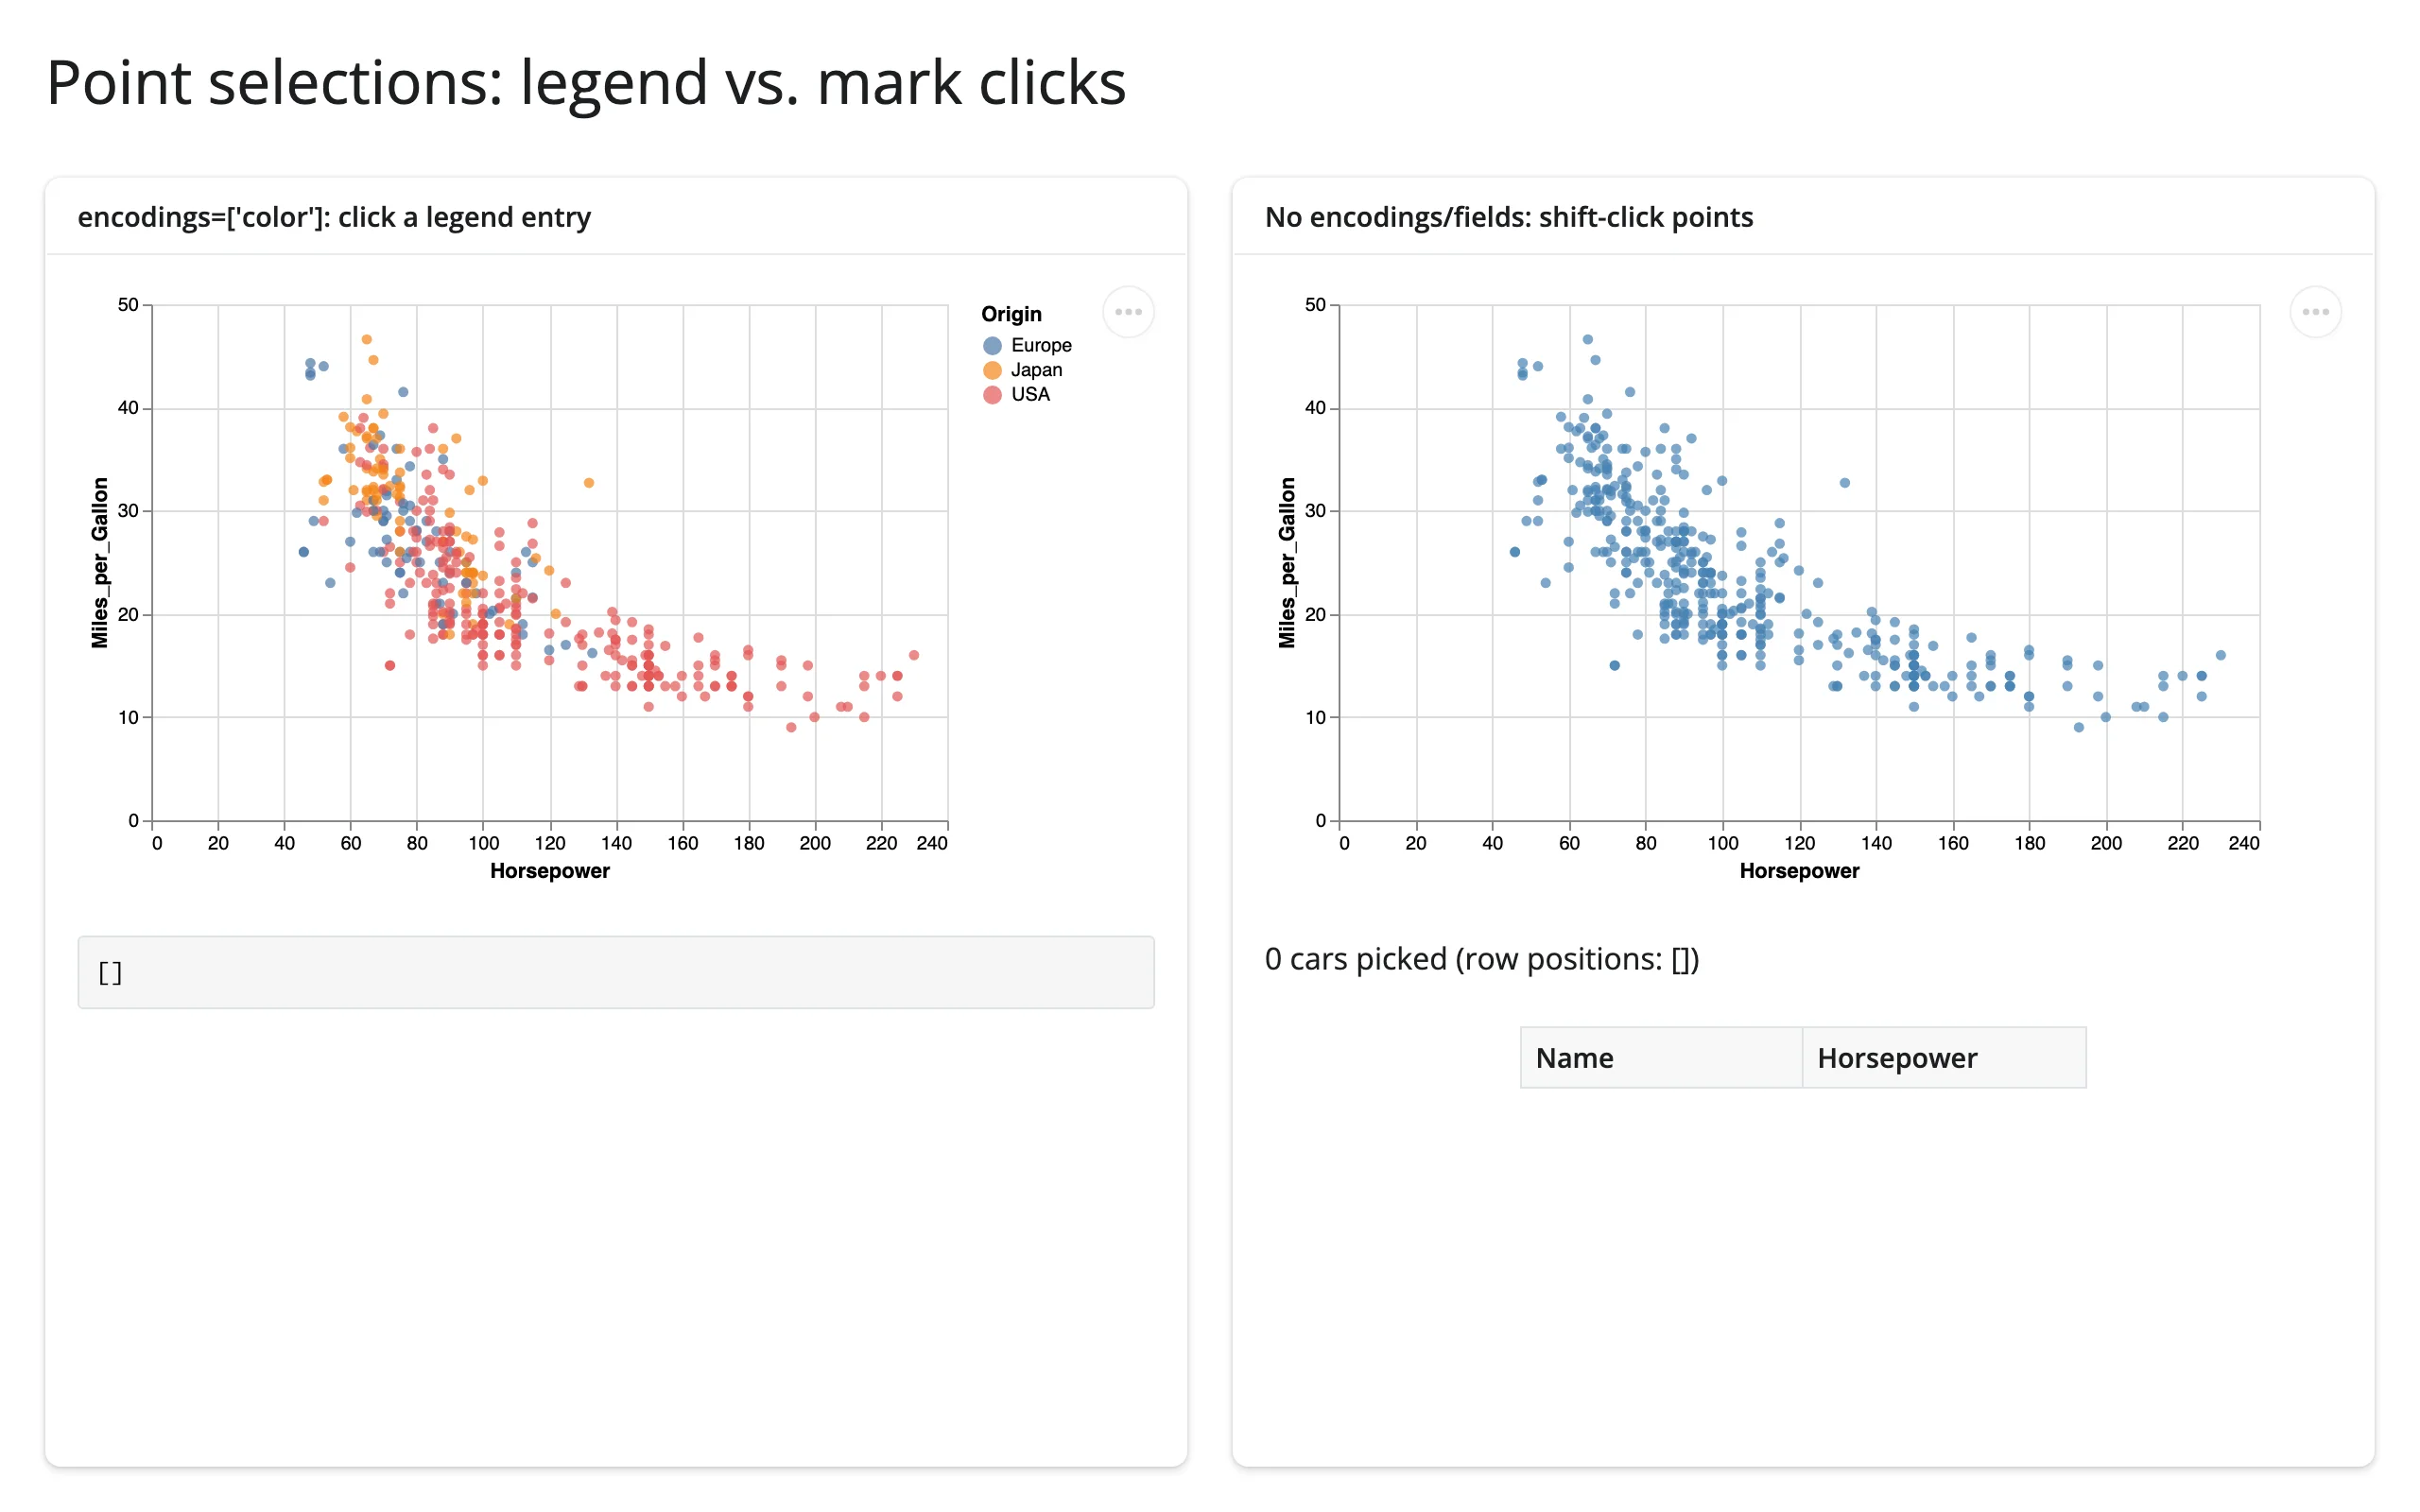
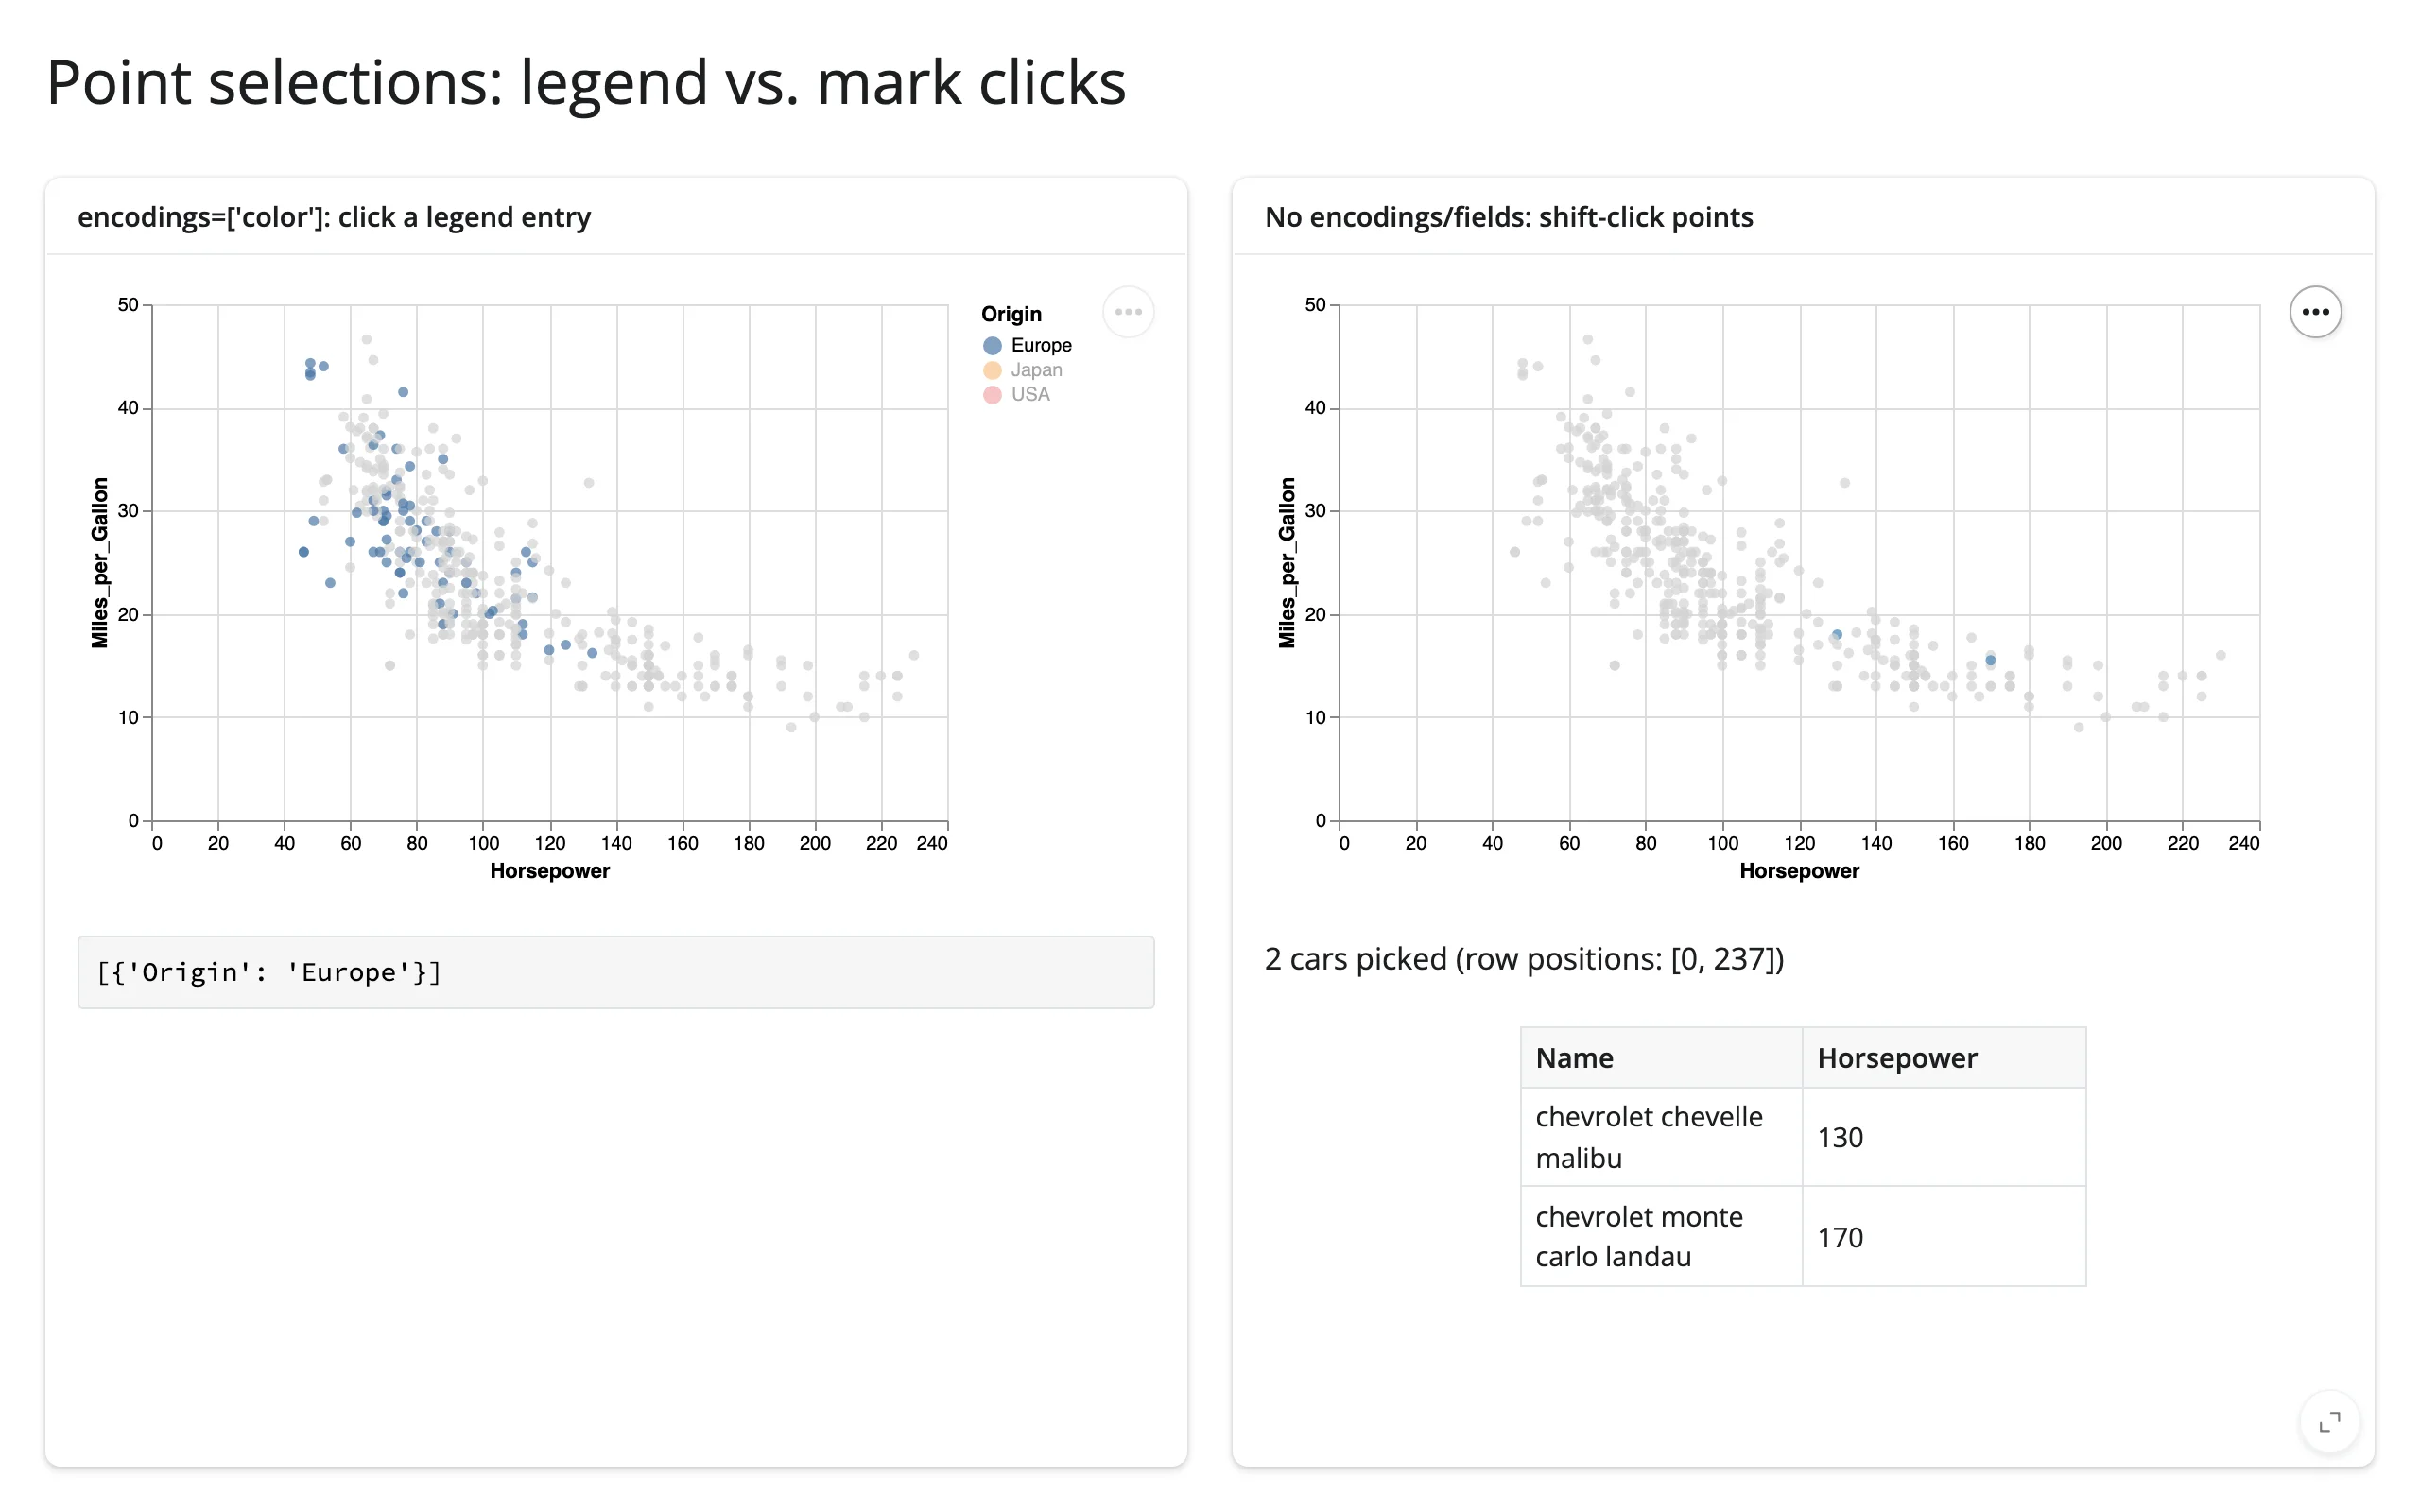
alt.selection_point(name=..., encodings=["color"], bind="legend"): clicking a legend entry picks every mark whose value on that encoding channel matches.encodings=names a channel, so it resolves to whatever field happens to be mapped there.alt.selection_point(name=..., fields=["Origin"]): the same idea, but naming the data column directly instead of a channel – useful when you want the test tied to a field regardless of which channel (if any) encodes it. Verified interchangeable withencodings=["color"]above whencoloris bound toOrigin: both report[{'Origin': 'Europe'}]from the same legend click.alt.selection_point(name=...)with neitherencodings=norfields=: clicking (or shift-clicking, for multiple) individual marks. This is anIndexSelection–.valueis a list of 0-based row positions in the underlying data, sodf.iloc[sel.value](which is exactly whatselected_rows()does for you) just works.
import altair as alt
from altair.datasets import data
from shiny.express import render, ui

from shinywidgets import render_altair

ui.page_opts(title="Point selections: legend vs. mark clicks", fillable=True)

cars = data.cars()

with ui.layout_columns():
    with ui.card(full_screen=True):
        ui.card_header("encodings=['color']: click a legend entry")

        @render_altair(height="320px")
        def by_legend():
            pick = alt.selection_point(name="origin_pick", encodings=["color"], bind="legend")
            return (
                alt.Chart(cars)
                .mark_circle()
                .encode(
                    x="Horsepower:Q",
                    y="Miles_per_Gallon:Q",
                    color=alt.condition(pick, "Origin:N", alt.value("lightgray")),
                )
                .add_params(pick)
            )

        @render.code
        def legend_value():
            return str(by_legend.selected("origin_pick").value)

    with ui.card(full_screen=True):
        ui.card_header("No encodings/fields: shift-click points")

        @render_altair(height="320px")
        def by_mark():
            pick = alt.selection_point(name="car_pick")
            return (
                alt.Chart(cars)
                .mark_circle()
                .encode(
                    x="Horsepower:Q",
                    y="Miles_per_Gallon:Q",
                    color=alt.condition(pick, alt.value("steelblue"), alt.value("lightgray")),
                )
                .add_params(pick)
            )

        @render.text
        def picked_count():
            return f"{len(by_mark.selected_rows('car_pick'))} cars picked (row positions: {by_mark.selected('car_pick').value})"

        @render.data_frame
        def picked_cars():
            return by_mark.selected_rows("car_pick")[["Name", "Horsepower"]]
Legend click on the left (reports [{'Origin': 'Europe'}]), one click plus one shift-click on the right (reports two row positions and both matching cars):
Binned and temporal fields
selected_rows() evaluates the selection the way Vega-Lite does, which matters for two field types in particular:
- Binned fields (
alt.X("Horsepower:Q", bin=alt.Bin(step=25))): clicking a bar selects a half-open range ([lo, hi)), matching Vega-Lite’s own semantics – not the closed interval you’d get from a naivedf.query("lo <= x <= hi"). - Temporal fields: Vega sends dates as UTC; a time-zone-naive column is compared in the browser’s local time zone (via the widget’s
local_tz), and a time-zone-aware column is compared in its own zone. You don’t have to do this conversion yourself.
import altair as alt
from altair.datasets import data
from shiny.express import render, ui

from shinywidgets import render_altair

ui.page_opts(title="Binned and temporal fields", fillable=True)

cars = data.cars()

with ui.layout_columns():
    with ui.card(full_screen=True):
        ui.card_header("Click a bar: binned selection")

        @render_altair
        def histogram():
            pick = alt.selection_point(name="hp_bin", encodings=["x"])
            return (
                alt.Chart(cars)
                .mark_bar()
                .encode(
                    x=alt.X("Horsepower:Q", bin=alt.Bin(step=25)),
                    y="count()",
                    color=alt.condition(pick, alt.value("steelblue"), alt.value("lightgray")),
                )
                .add_params(pick)
            )

        @render.text
        def bin_count():
            n = len(histogram.selected_rows("hp_bin"))
            return f"{n} cars in the selected 25-hp bin" if n else "Click a bar above"

    with ui.card(full_screen=True):
        ui.card_header("Drag along the axis: temporal interval")

        @render_altair
        def timeline():
            brush = alt.selection_interval(name="years", encodings=["x"])
            return (
                alt.Chart(cars)
                .mark_tick()
                .encode(x="Year:T")
                .add_params(brush)
            )

        @render.text
        def year_count():
            n = len(timeline.selected_rows("years"))
            return f"{n} cars in the selected years" if n else "Drag along the axis above"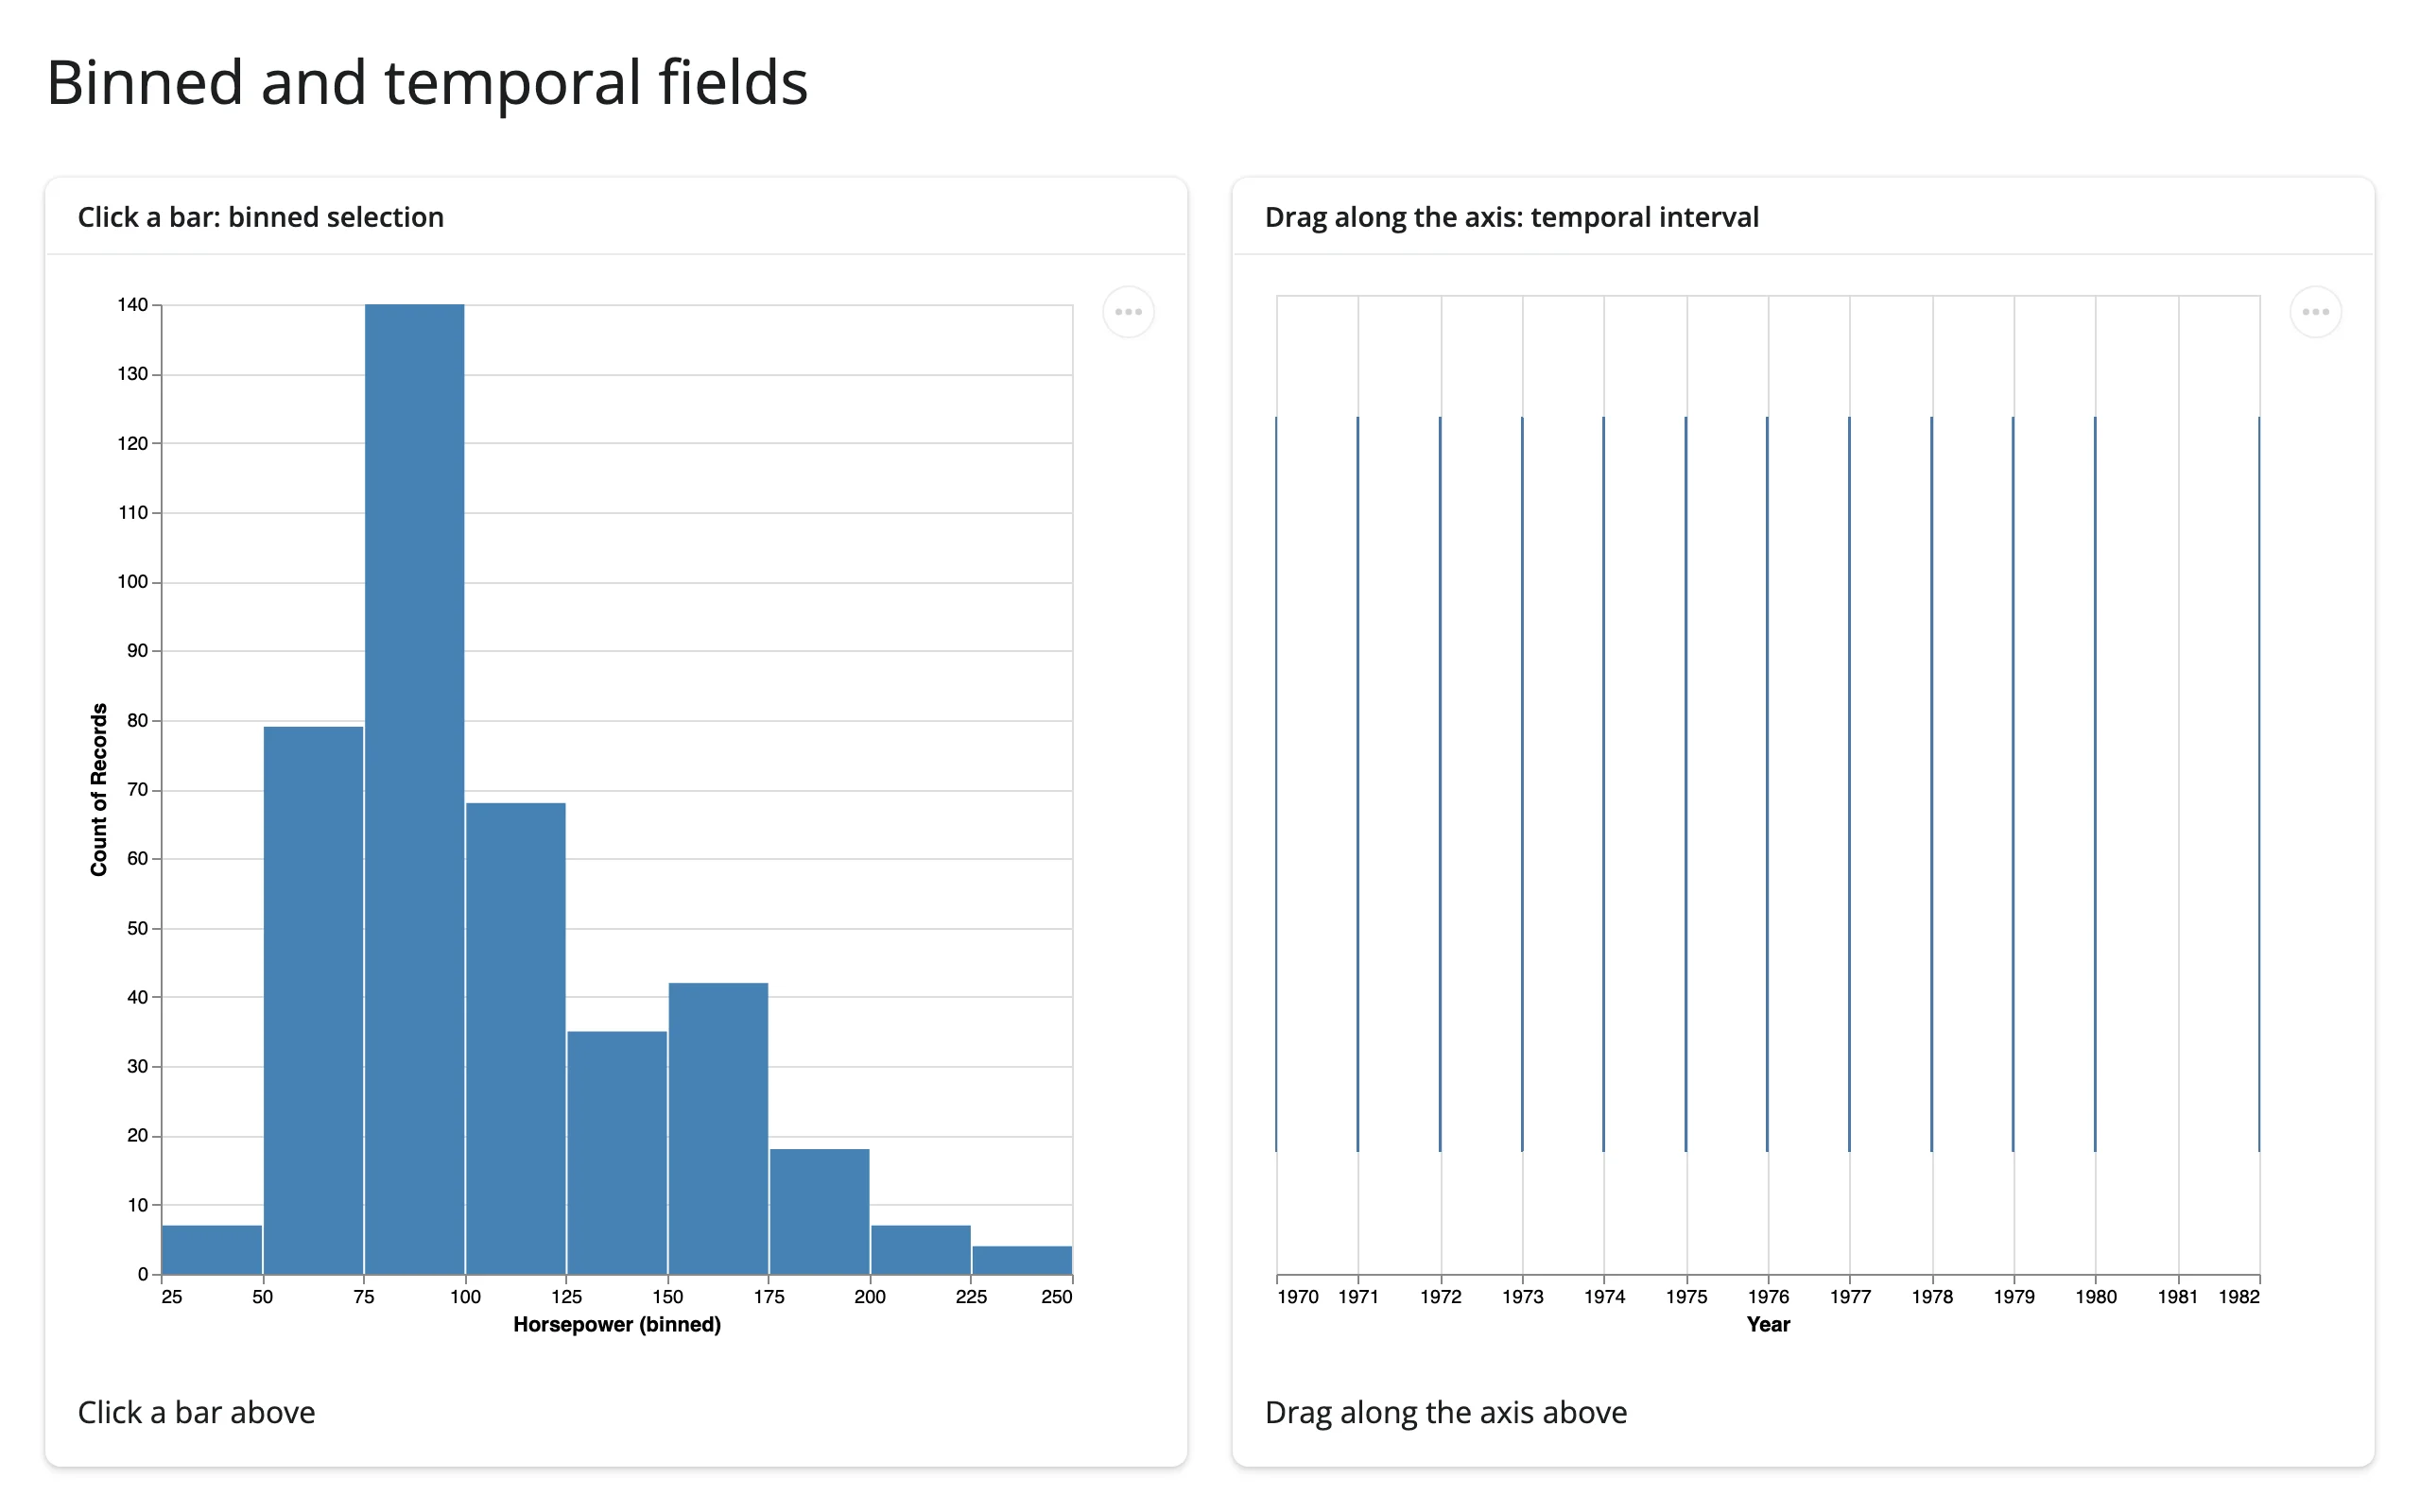
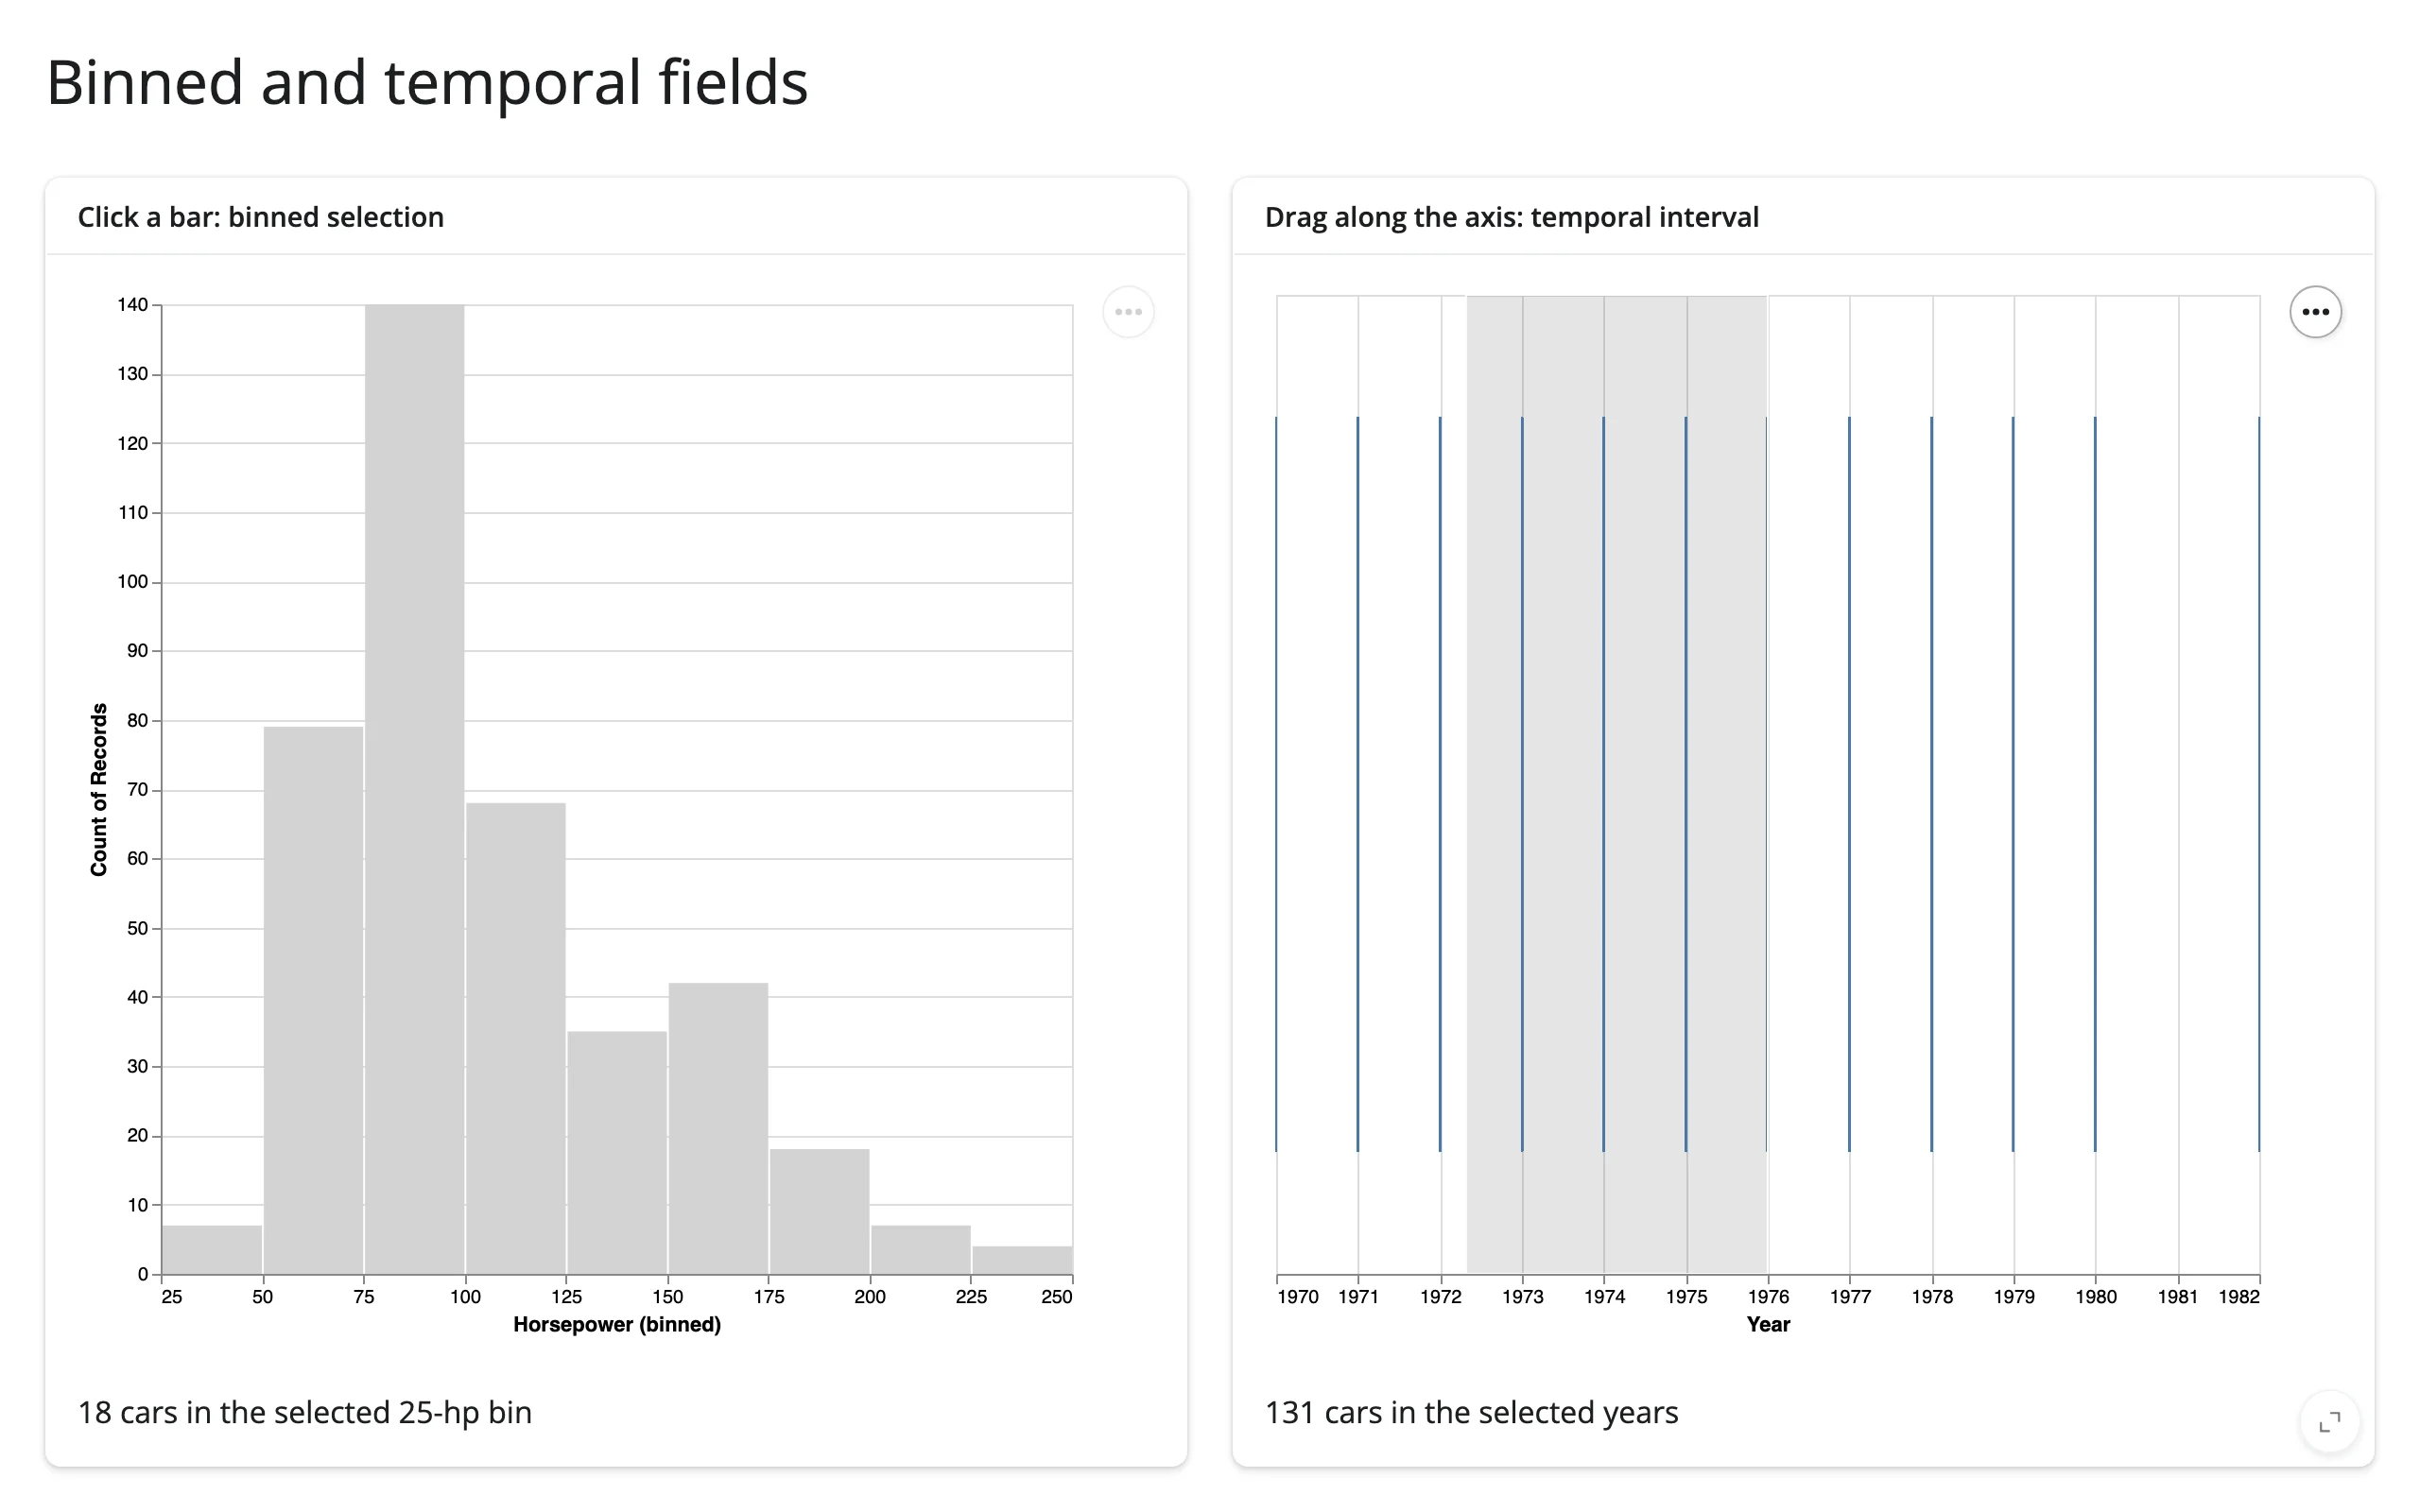
The right-hand chart’s gray brush overlay confirms the drag registered, and the count below it (131 cars across the dragged years) is computed from the correct, Vega-Lite-equivalent range test. The left-hand chart is also genuinely selected – bin_count updates correctly – even though, as covered in Gotchas below, Vega-Lite itself doesn’t visually highlight the clicked bar in this particular case.
Multiple named selections
A chart can declare more than one selection; read each by name. Two selections in the same view interact, though: in this example, dragging the brush clears the legend pick, and clicking the legend clears the brush (this is Vega-Lite’s own behavior for co-located selections, not something shinywidgets adds or could prevent).
import altair as alt
from altair.datasets import data
from shiny.express import render, ui

from shinywidgets import render_altair

ui.page_opts(title="Two named selections on one chart", fillable=True)

cars = data.cars()


@render_altair
def chart():
    brush = alt.selection_interval(name="brush", encodings=["x"])
    origin_pick = alt.selection_point(name="origin_pick", encodings=["color"], bind="legend")
    return (
        alt.Chart(cars)
        .mark_circle()
        .encode(
            x="Horsepower:Q",
            y="Miles_per_Gallon:Q",
            color=alt.condition(origin_pick, "Origin:N", alt.value("lightgray")),
            opacity=alt.condition(brush, alt.value(1.0), alt.value(0.3)),
        )
        .add_params(brush, origin_pick)
    )


with ui.layout_columns():

    @render.code
    def brush_state():
        return f"brush: {chart.selected('brush').value}"

    @render.code
    def legend_state():
        return f"origin_pick: {chart.selected('origin_pick').value}"
Legend click only (brush stays {}), then brush drag only (origin_pick resets to []):
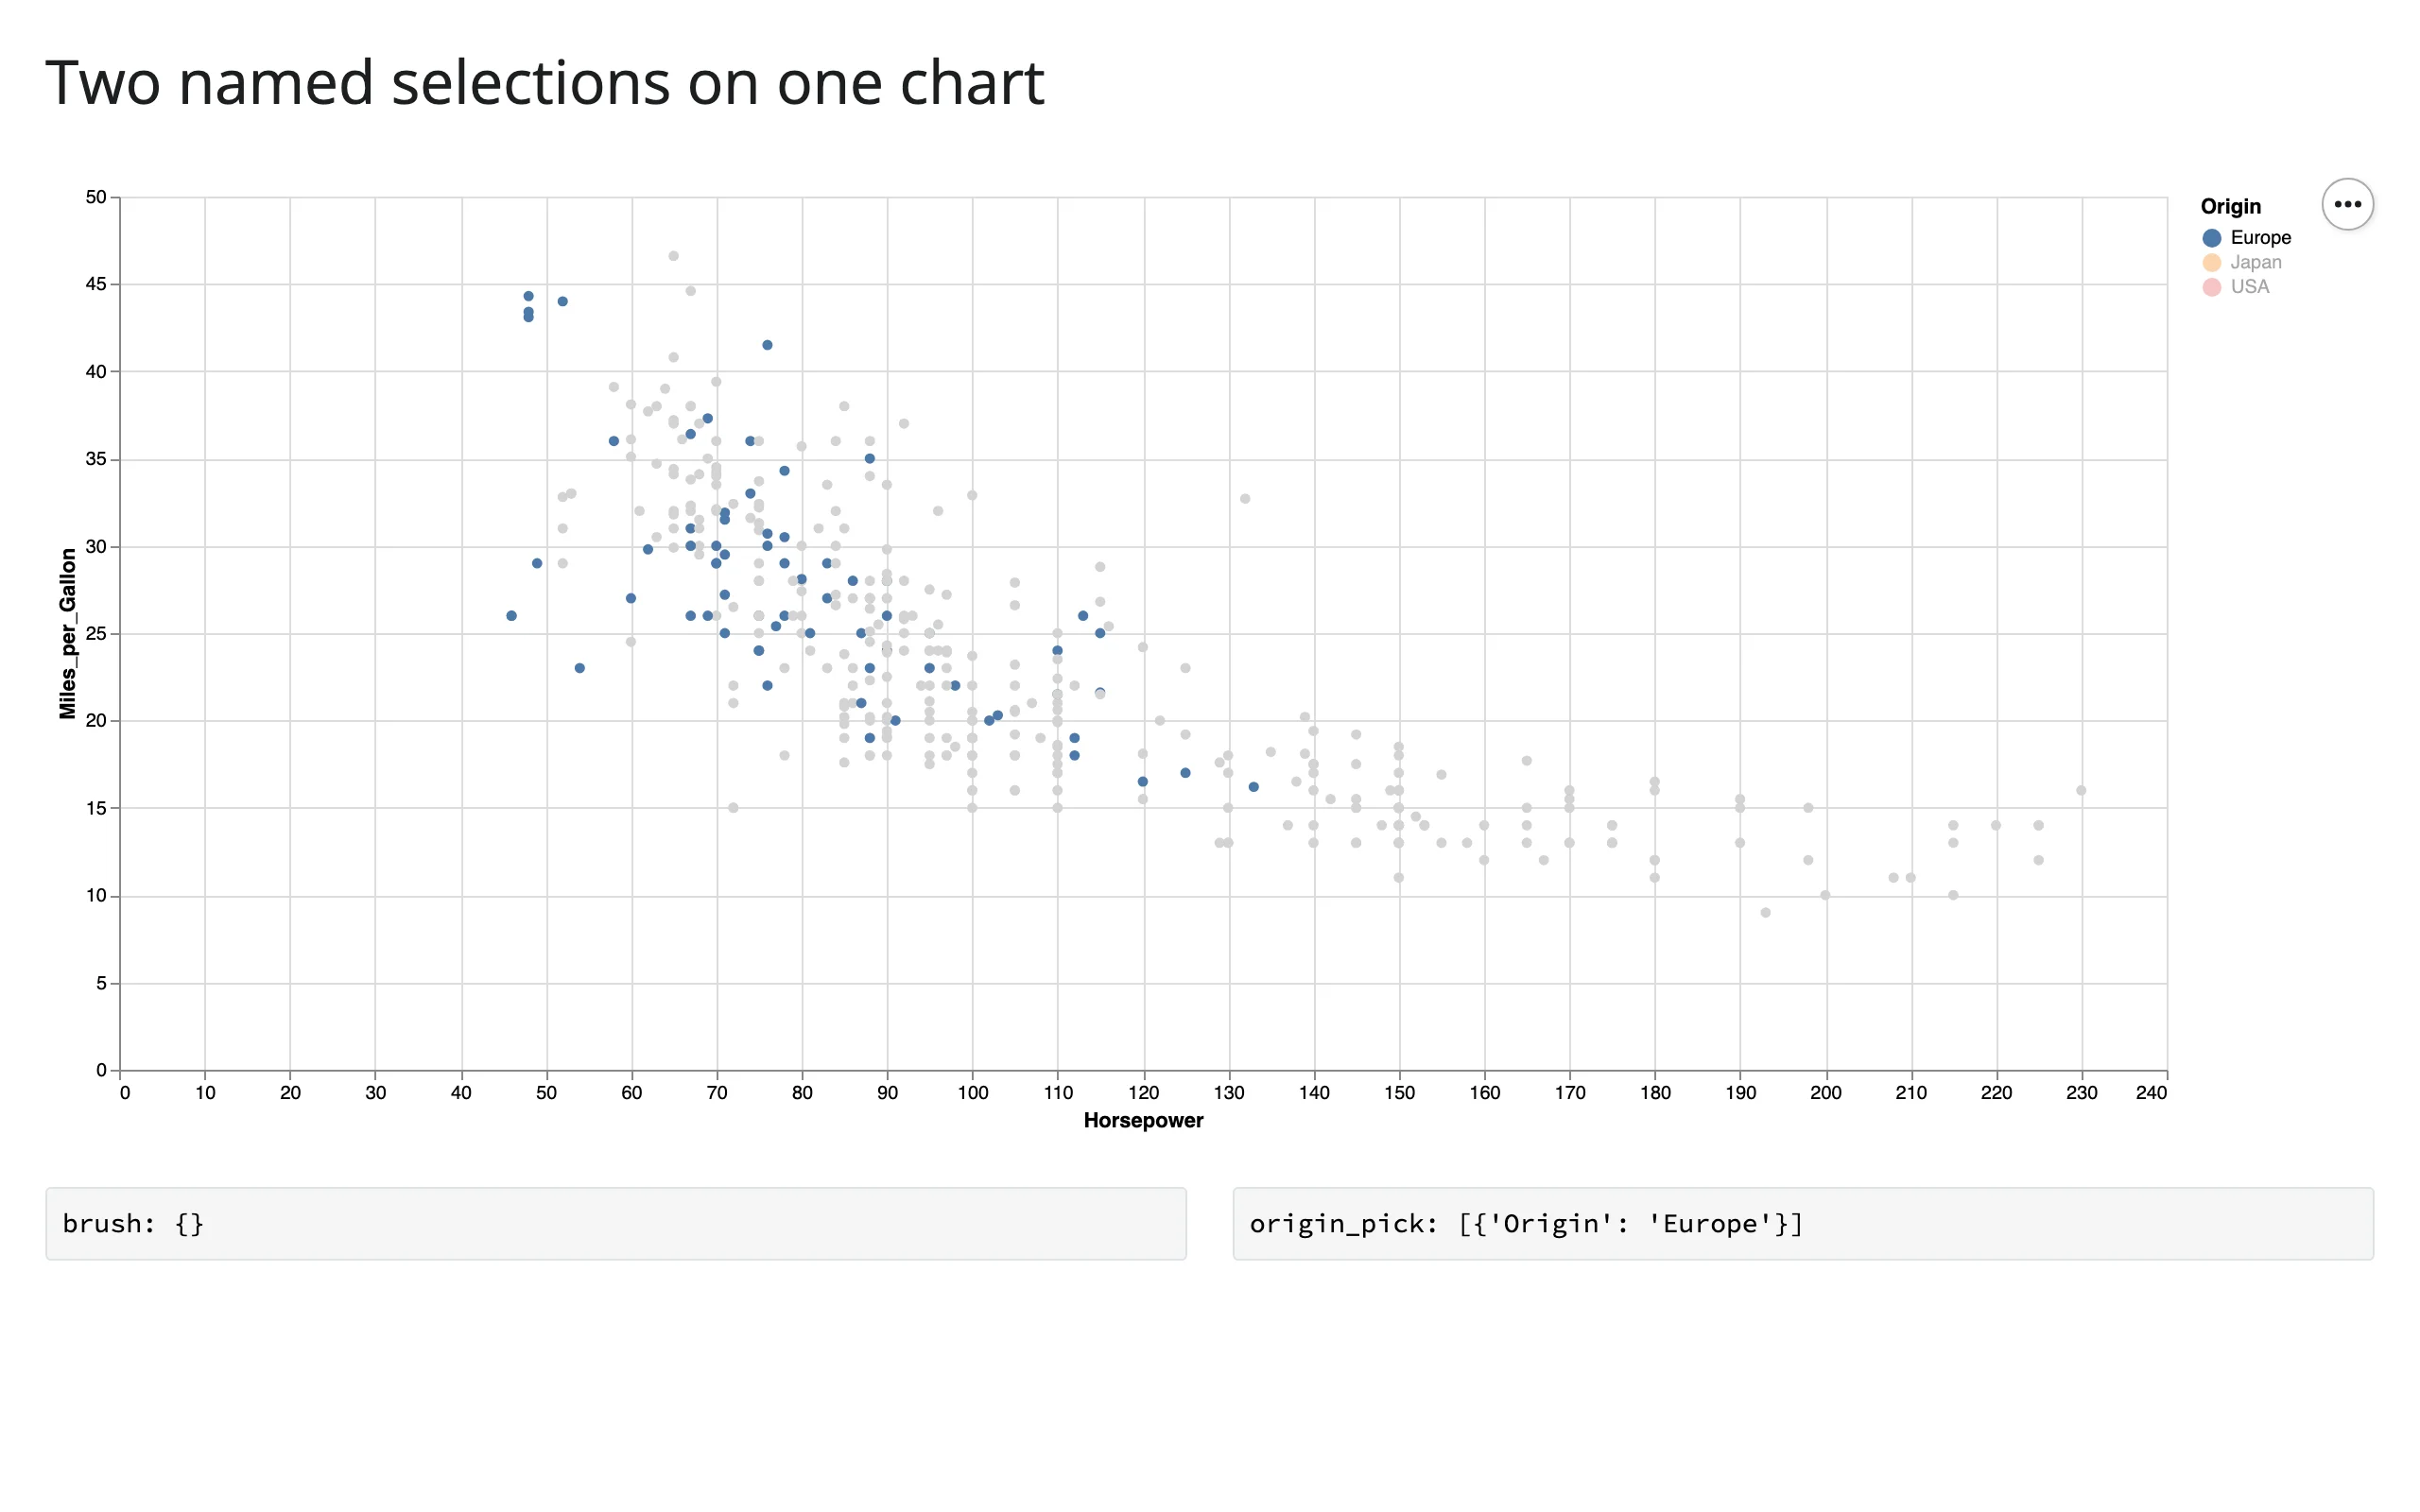
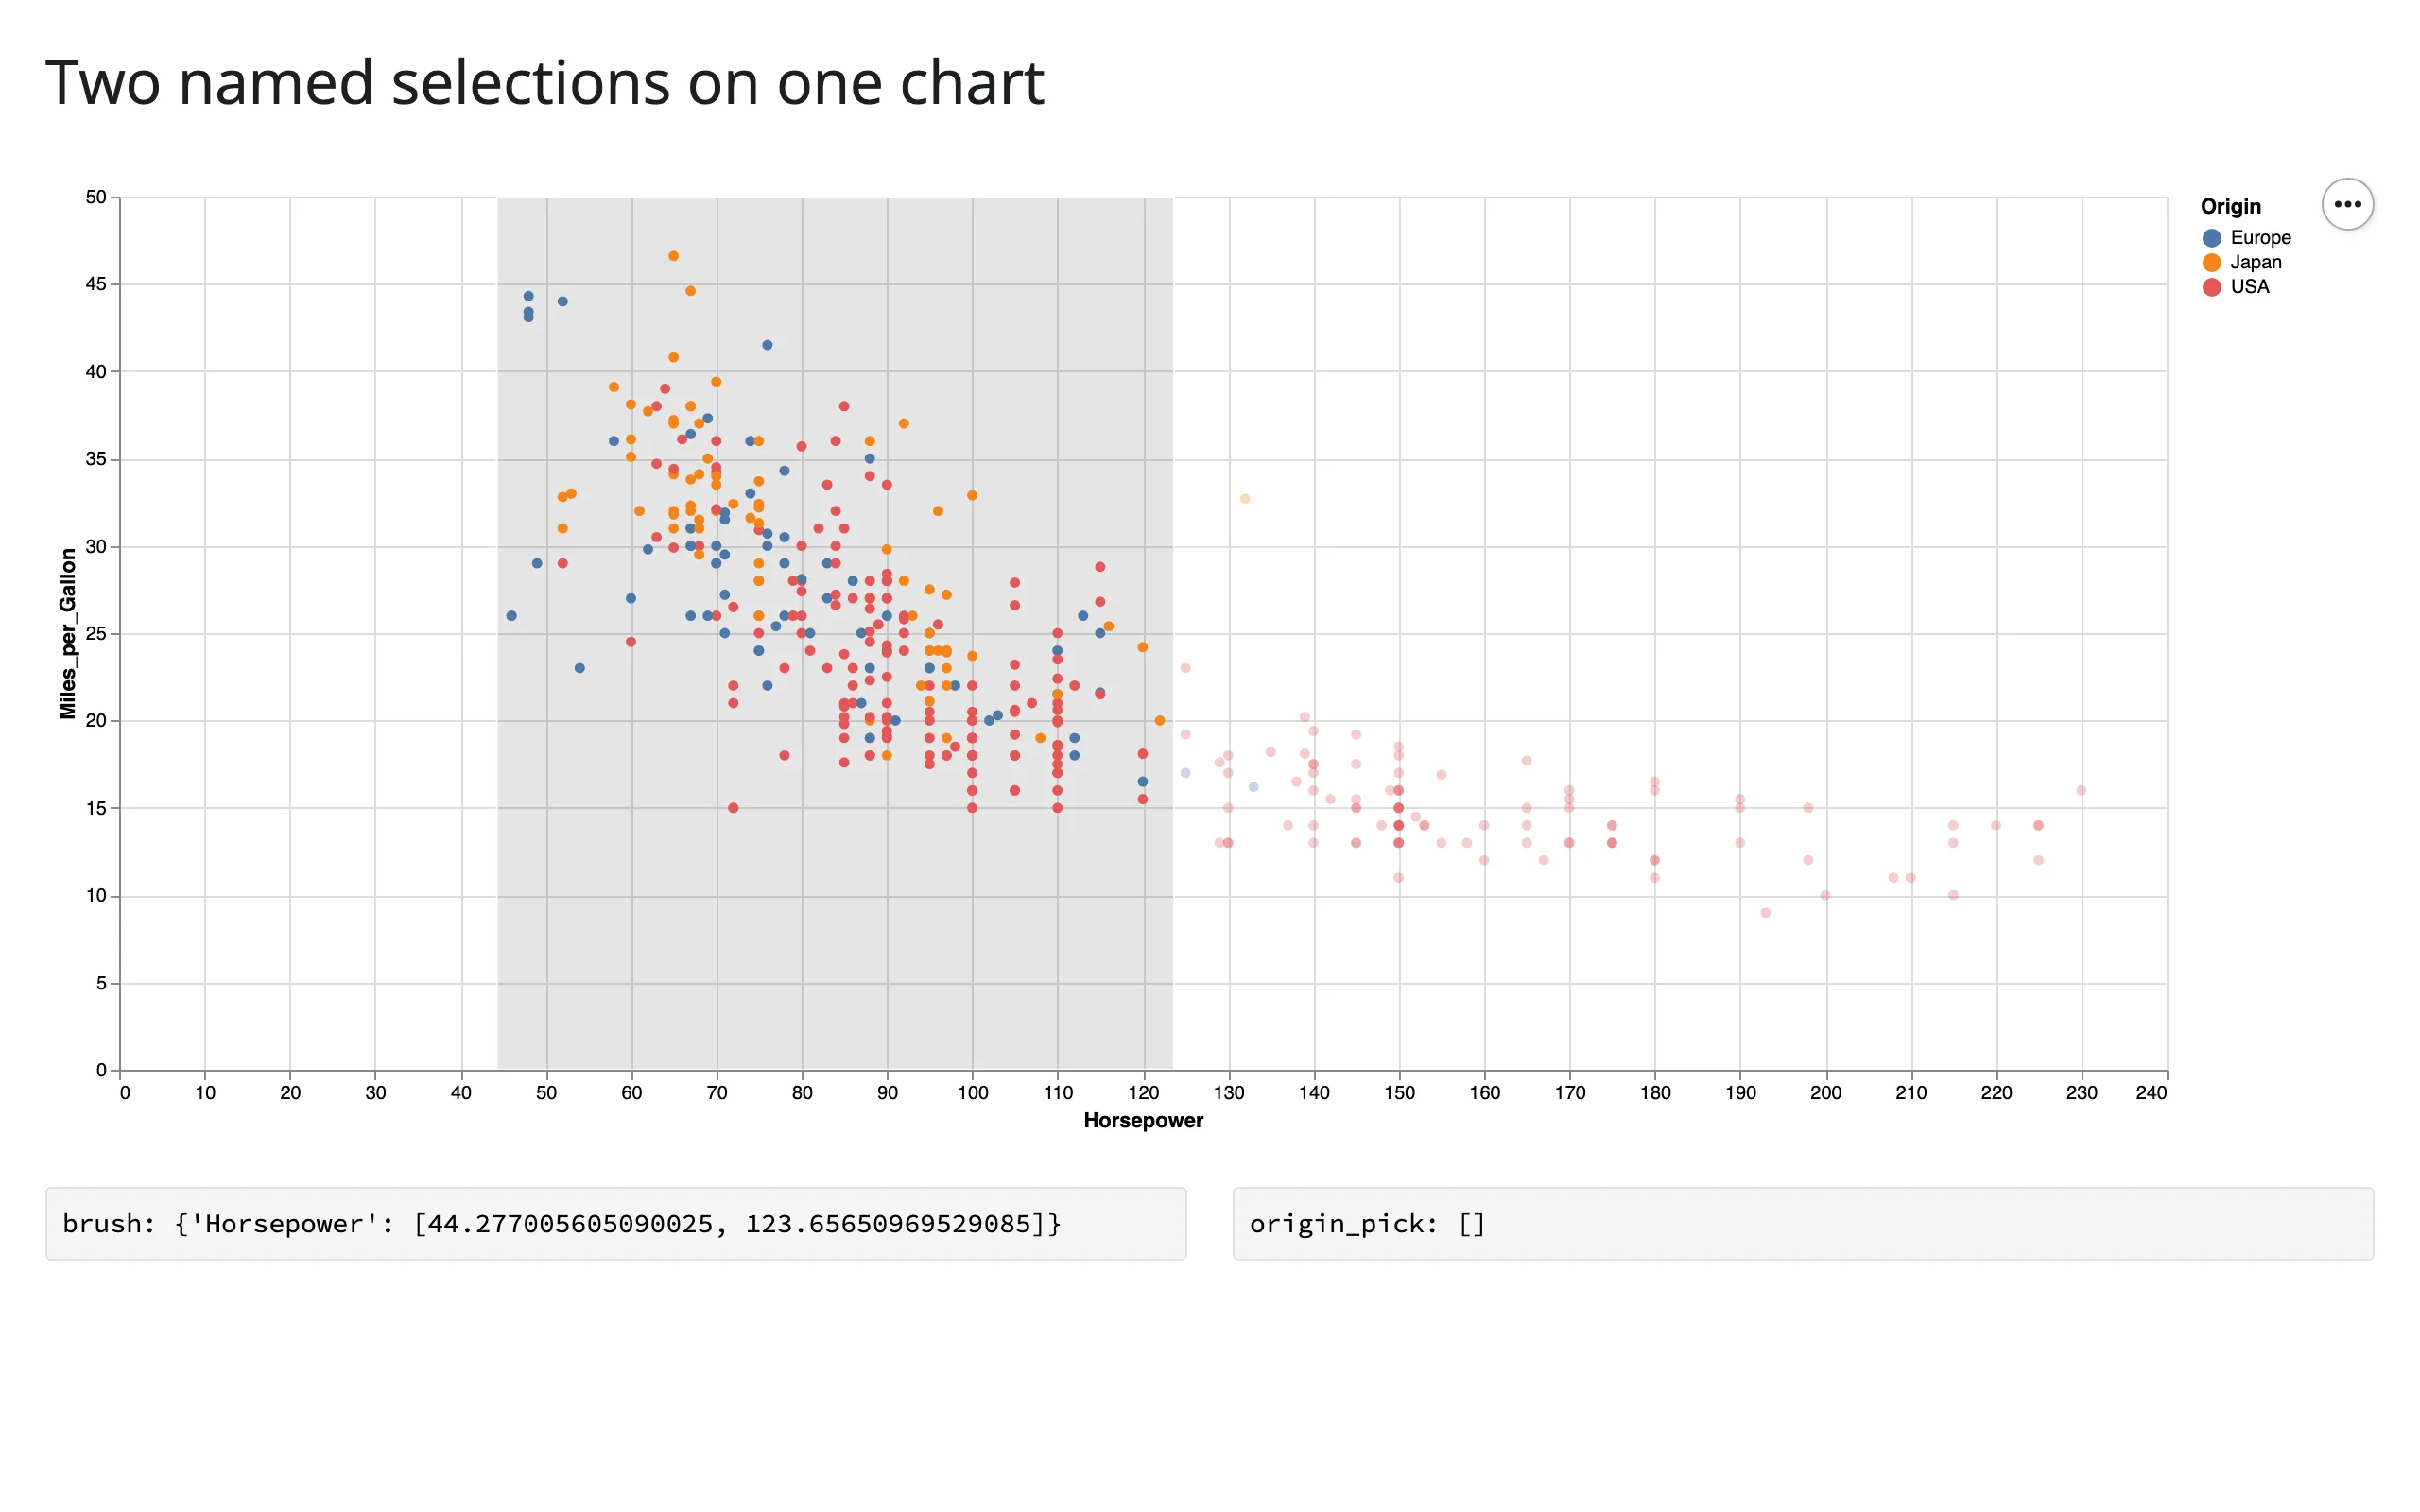
If you want two selections that don’t clear each other, put them in separate views (e.g. two chart outputs, or two layers that aren’t both direct interaction targets) rather than relying on them coexisting peacefully in one.
Polars frames
selected_rows() is built on narwhals, which Altair itself depends on, so a chart built from a polars.DataFrame filters to a polars.DataFrame, with no extra configuration.
import altair as alt
from altair.datasets import data
import polars as pl
from shiny.express import render, ui

from shinywidgets import render_altair

ui.page_opts(title="Polars data", fillable=True)

cars = pl.from_pandas(data.cars())

with ui.layout_columns(col_widths=[8, 4]):
    with ui.card(full_screen=True):
        ui.card_header("Chart built from a polars.DataFrame")

        @render_altair
        def scatter():
            brush = alt.selection_interval(name="brush")
            return (
                alt.Chart(cars)
                .mark_circle()
                .encode(
                    x="Horsepower:Q",
                    y="Miles_per_Gallon:Q",
                    color=alt.condition(brush, "Origin:N", alt.value("lightgray")),
                )
                .add_params(brush)
            )

    with ui.card(full_screen=True):
        ui.card_header("selected_rows() returns a polars.DataFrame")

        @render.code
        def kind():
            return type(scatter.selected_rows("brush")).__name__

        @render.data_frame
        def rows():
            return scatter.selected_rows("brush").select("Name", "Horsepower")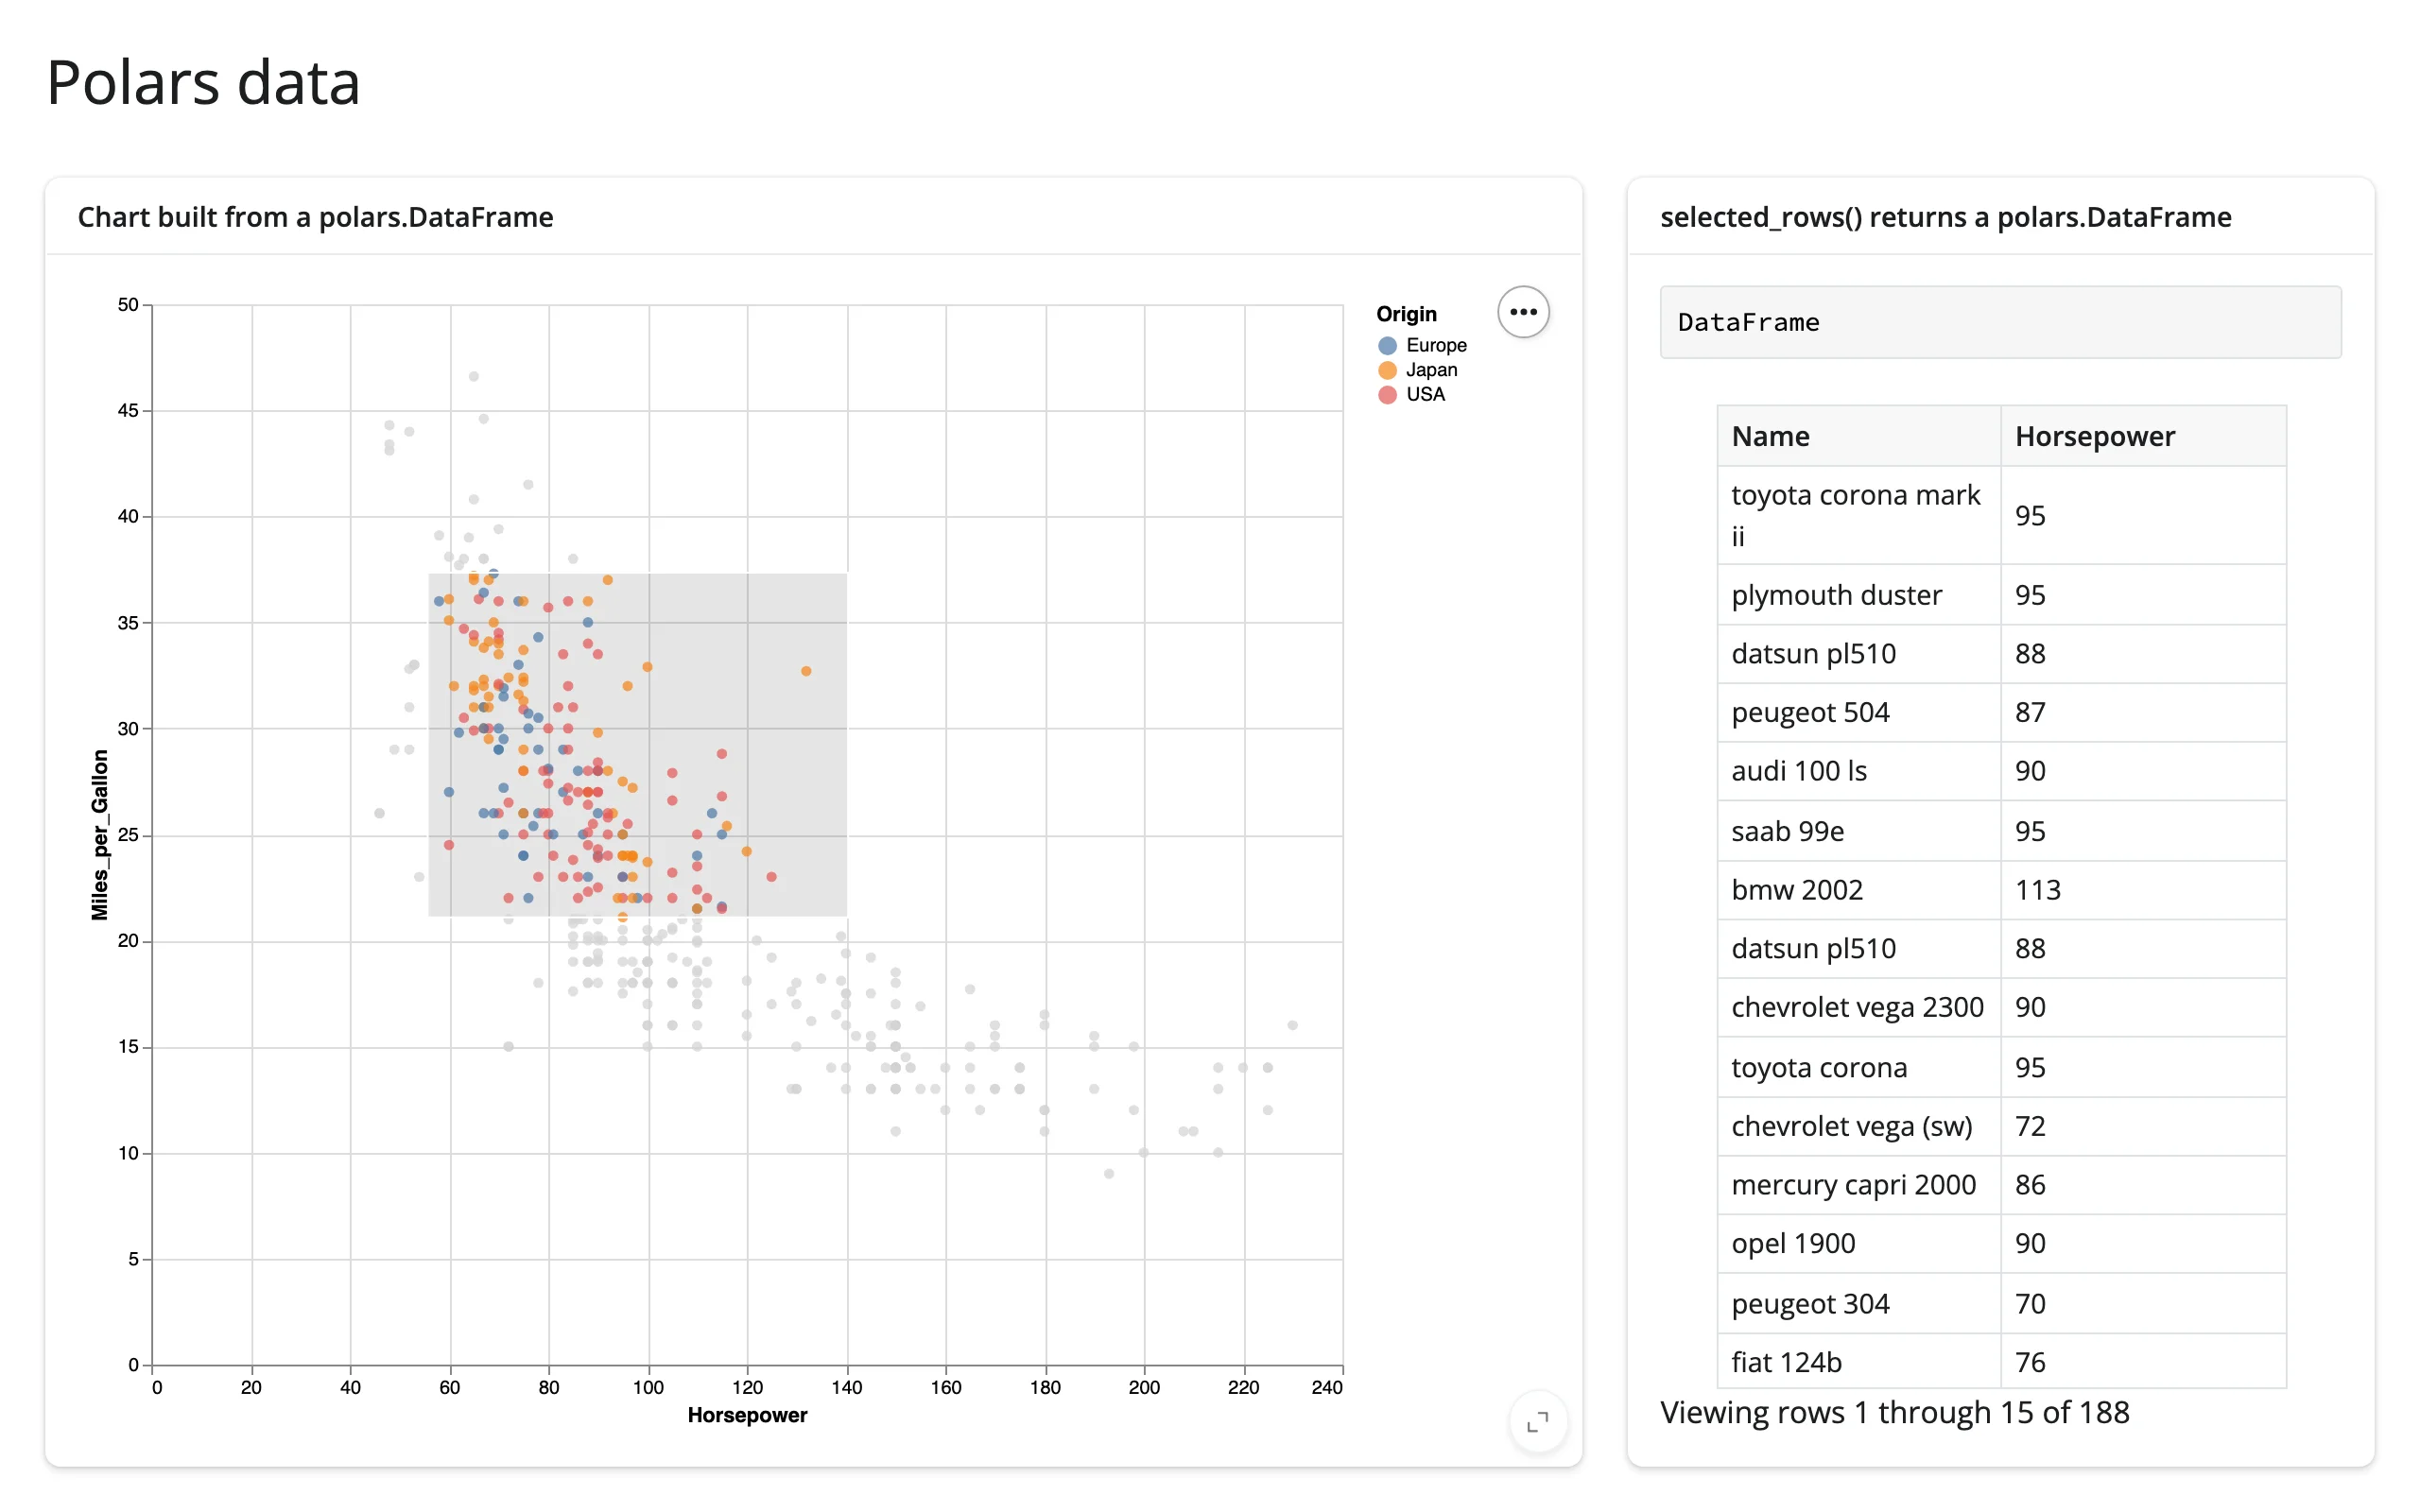
df= defaults to the chart’s own data frame; pass it explicitly for charts whose data is a URL string, or (see “Gotchas” below) a layered/concatenated chart whose layers weren’t built from the identical data frame object.
Beyond the accessors: reactive_read
Params (alt.param(...), including ones bound to in-chart controls like binding_range) are not selections, so they have no dedicated accessor. They also aren’t traits of chart.widget itself – each bound param becomes a trait of chart.widget.params, a separate object the widget builds – so chart.read("name") (which only looks at chart.widget’s own traits) can’t reach them. Read one with reactive_read(chart.widget.params, "name") instead – the same slider from “What you can build” above, now also driving a Python-side output:
import altair as alt
from altair.datasets import data
from shiny.express import render, ui

from shinywidgets import reactive_read, render_altair

ui.page_opts(title="Reading a bound param with reactive_read", fillable=True)

cars = data.cars()

with ui.layout_columns(col_widths=[8, 4]):
    with ui.card(full_screen=True):
        ui.card_header("Model year is a param, not a selection")

        @render_altair
        def chart():
            year_slider = alt.binding_range(min=1970, max=1982, step=1, name="Model year: ")
            year = alt.param(name="year", value=1977, bind=year_slider)
            return (
                alt.Chart(cars)
                .mark_circle()
                .encode(
                    x="Horsepower:Q",
                    y="Miles_per_Gallon:Q",
                    opacity=alt.condition(
                        "year(datum.Year) == year", alt.value(0.9), alt.value(0.05)
                    ),
                )
                .add_params(year)
            )

    with ui.card(full_screen=True):
        ui.card_header("Python reacts to the slider too")

        @render.text
        def year_value():
            # params aren't selections, so there's no accessor for them;
            # reactive_read watches the trait directly.
            year = reactive_read(chart.widget.params, "year")
            return f"Showing model year {int(year)}" if year is not None else "..."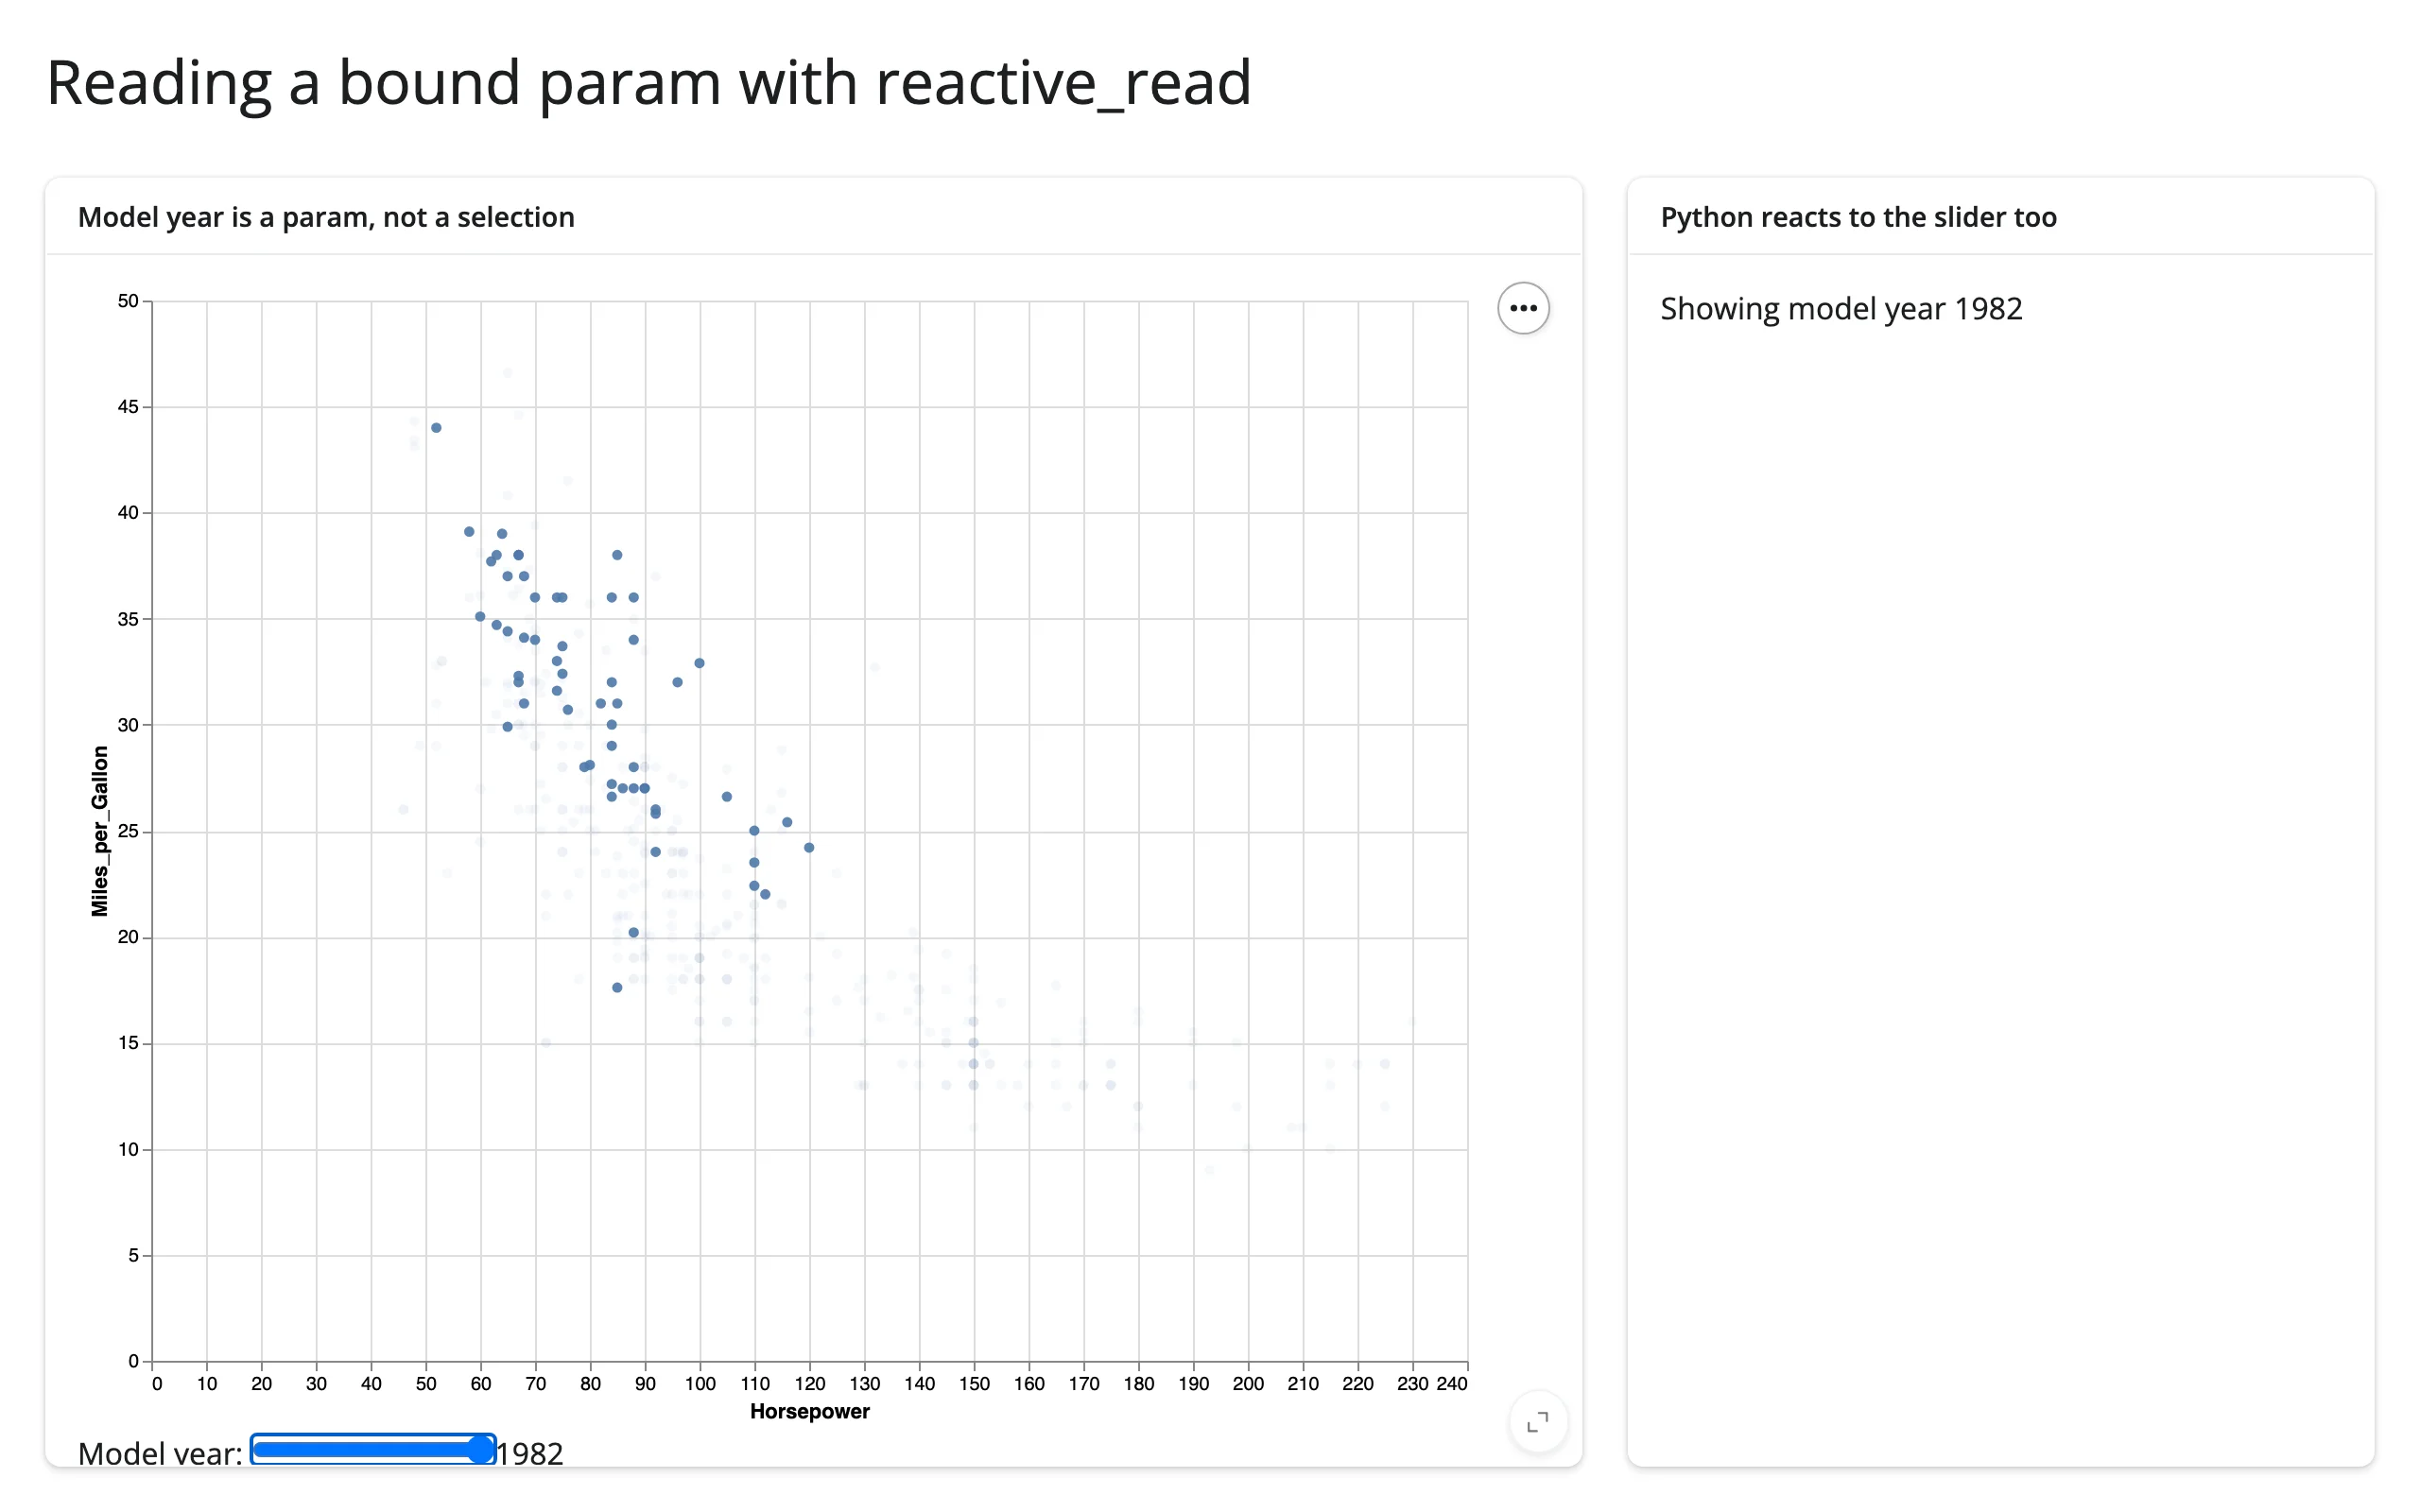
local_tz and debounce_wait, by contrast, are traits of chart.widget itself, so reading them doesn’t need reactive_read() at all – chart.read("local_tz") (the browser’s IANA zone name, the same one selected_rows() uses internally for naive temporal columns) and chart.read("debounce_wait") (see “Rate limiting,” next).
Rate limiting
Two independent rate limits are in play, and they solve different problems:
rate_policy/rate_delayon@render_altaircontrol how often Python re-readsselected()(andreactive_read()on this widget). The default is a 250 ms debounce, which is what you want for a brush you’re dragging: Python only sees the final-ish value, not every intermediate frame. Passrate_policy="throttle"for steady-interval updates instead of trailing-edge ones, orrate_delay=0to see every message.debounce_wait/max_waitonalt.JupyterChart(defaultdebounce_wait=10,max_wait=True) control how often the browser sends a selection update to the kernel at all, independent of shinywidgets. Raising this (alt.JupyterChart(chart, debounce_wait=150)) cuts the number of messages that cross the wire while dragging, which matters more as your data or your downstream computation gets larger.
In practice, the shinywidgets-side default is enough for most apps; reach for debounce_wait when a selection drives something expensive enough that even a debounced Python read is too frequent relative to the number of browser messages arriving.
Reading on demand
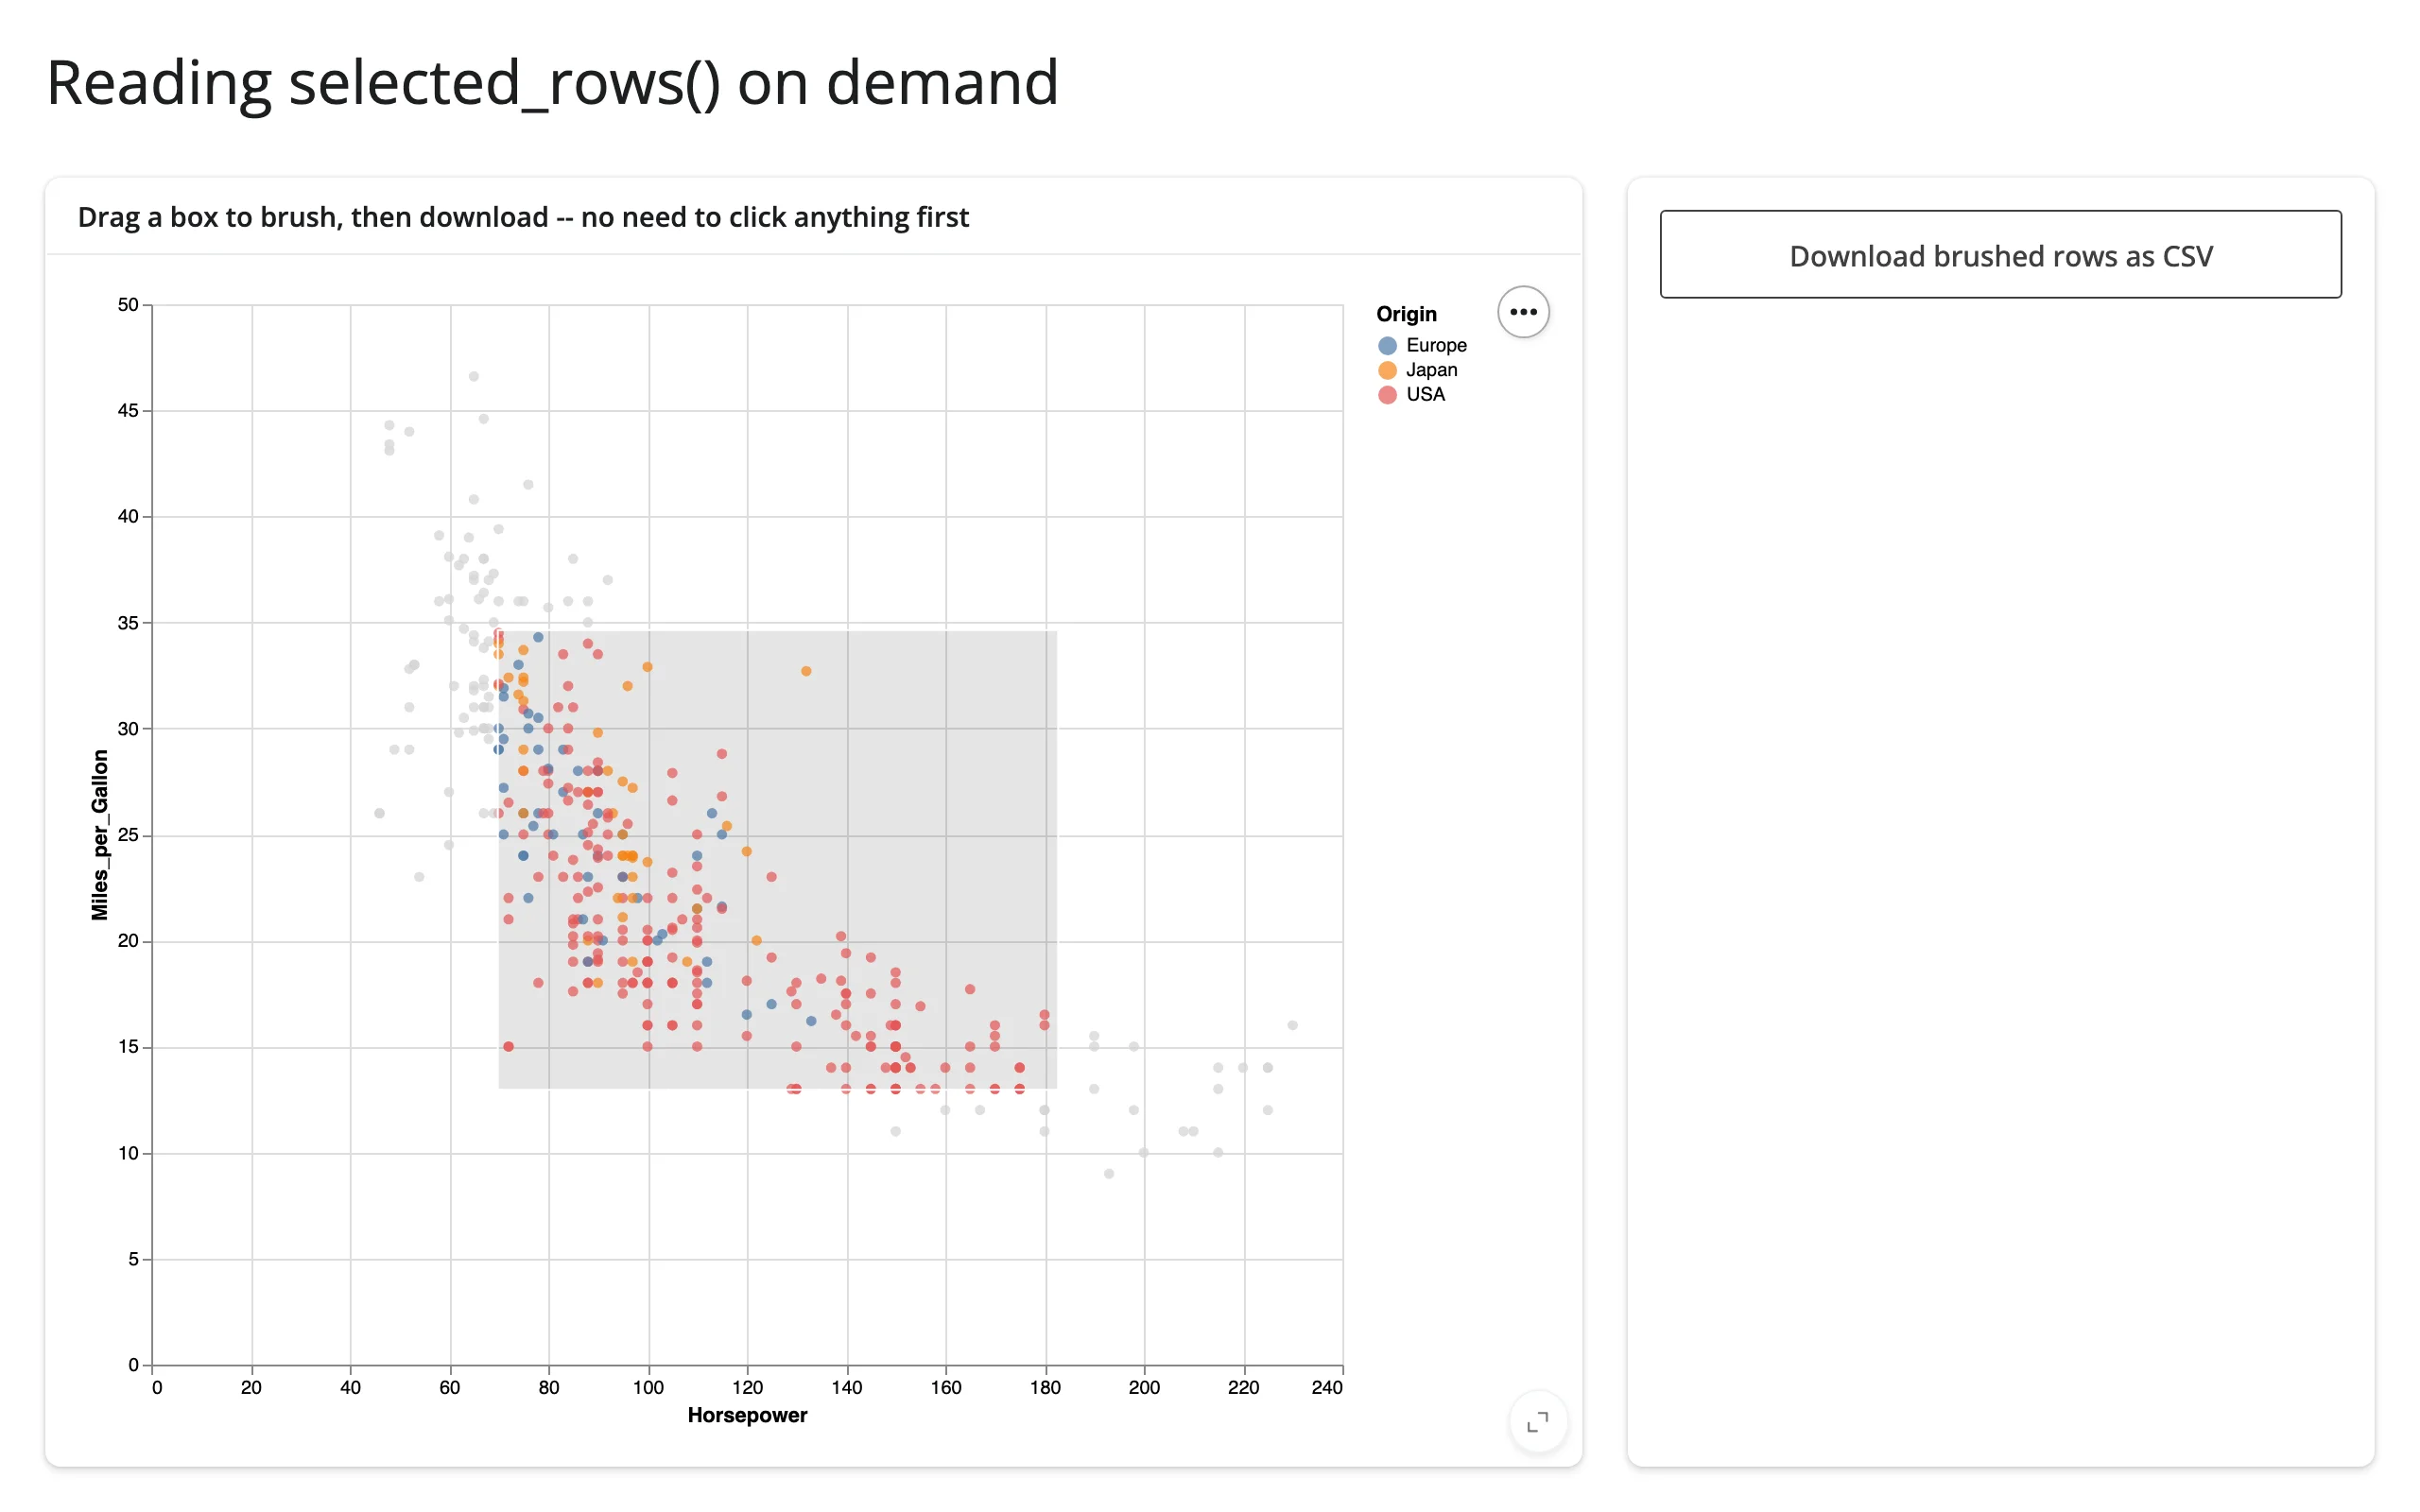
Because selected()/selected_rows() are live and seeded from the moment the chart renders, they’re safe to read from somewhere that only runs occasionally, like a download handler – no prior read, no warm-up, and the value you get back is whatever the user last brushed, even on the handler’s first run:
import altair as alt
from altair.datasets import data
from shiny.express import render, ui

from shinywidgets import render_altair

ui.page_opts(title="Reading selected_rows() on demand", fillable=True)

cars = data.cars()

with ui.layout_columns(col_widths=[8, 4]):
    with ui.card(full_screen=True):
        ui.card_header("Drag a box to brush, then download -- no need to click anything first")

        @render_altair
        def scatter():
            brush = alt.selection_interval(name="brush")
            return (
                alt.Chart(cars)
                .mark_circle()
                .encode(
                    x="Horsepower:Q",
                    y="Miles_per_Gallon:Q",
                    color=alt.condition(brush, "Origin:N", alt.value("lightgray")),
                )
                .add_params(brush)
            )

    with ui.card():

        @render.download_button(
            filename="brushed.csv", label="Download brushed rows as CSV"
        )
        def download():
            # selected_rows() is seeded empty from the moment the chart
            # renders, so this never needs a req() or a prior interaction.
            yield scatter.selected_rows("brush").to_csv(index=False)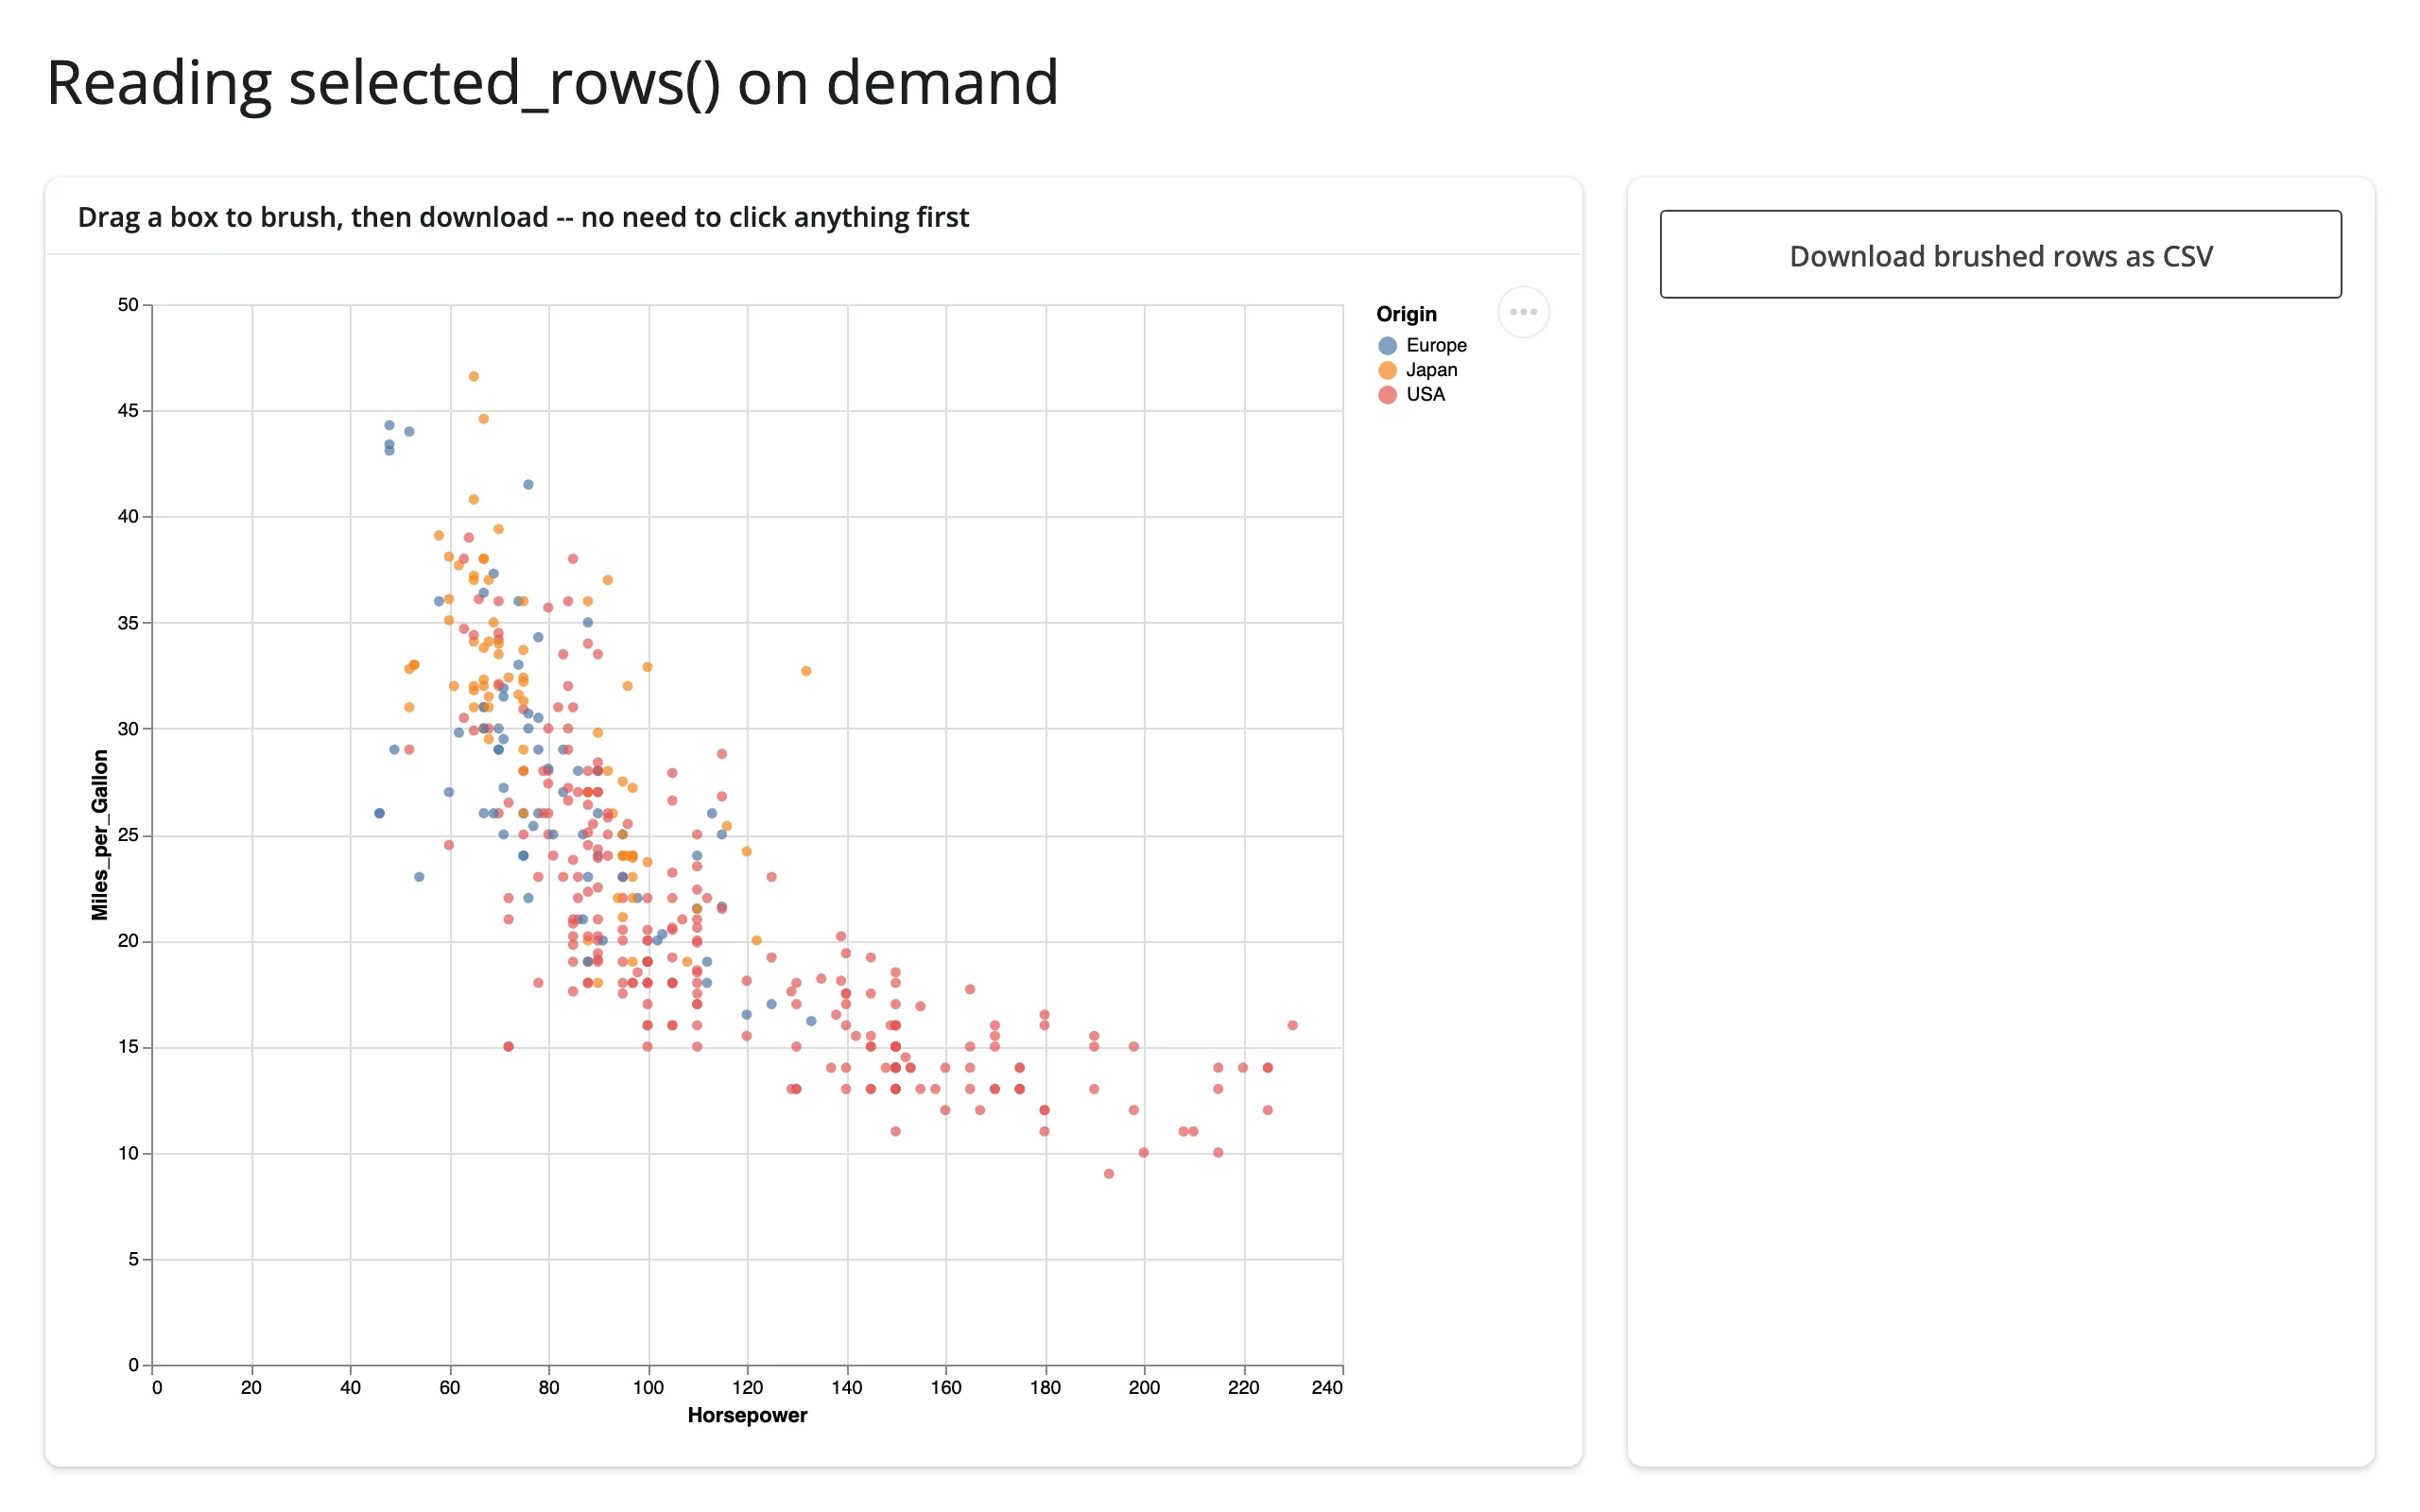
Updating the widget from Python
Selections are read-only from Python – there’s no way to set chart.widget.selections.brush = ... and have it move the brush. Params, by contrast, are meant to be set from Python: assign chart.widget.params.<name> = value inside a @reactive.effect, and the chart restyles in place, without resending its data or losing the user’s current selection/zoom state.
import altair as alt
from altair.datasets import data
from shiny import reactive
from shiny.express import input, render, ui

from shinywidgets import render_altair

ui.page_opts(title="Updating a param in place", fillable=True)

cars = data.cars()

with ui.sidebar():
    ui.input_slider("threshold", "Highlight above (mpg)", min=10, max=45, value=30)

with ui.card(full_screen=True):
    ui.card_header("Moving the slider restyles the chart without resending data")

    @render_altair
    def chart():
        with reactive.isolate():
            threshold = alt.param(name="threshold", value=input.threshold())
        return (
            alt.Chart(cars)
            .mark_circle()
            .encode(
                x="Horsepower:Q",
                y="Miles_per_Gallon:Q",
                color=alt.condition(
                    "datum.Miles_per_Gallon > threshold", alt.value("crimson"), alt.value("lightgray")
                ),
            )
            .add_params(threshold)
        )

    @reactive.effect
    def _():
        chart.widget.params.threshold = input.threshold()
reactive.isolate() around the initial value keeps the render function from re-running every time the slider moves – only the effect reacts to it, and only to patch the existing chart:
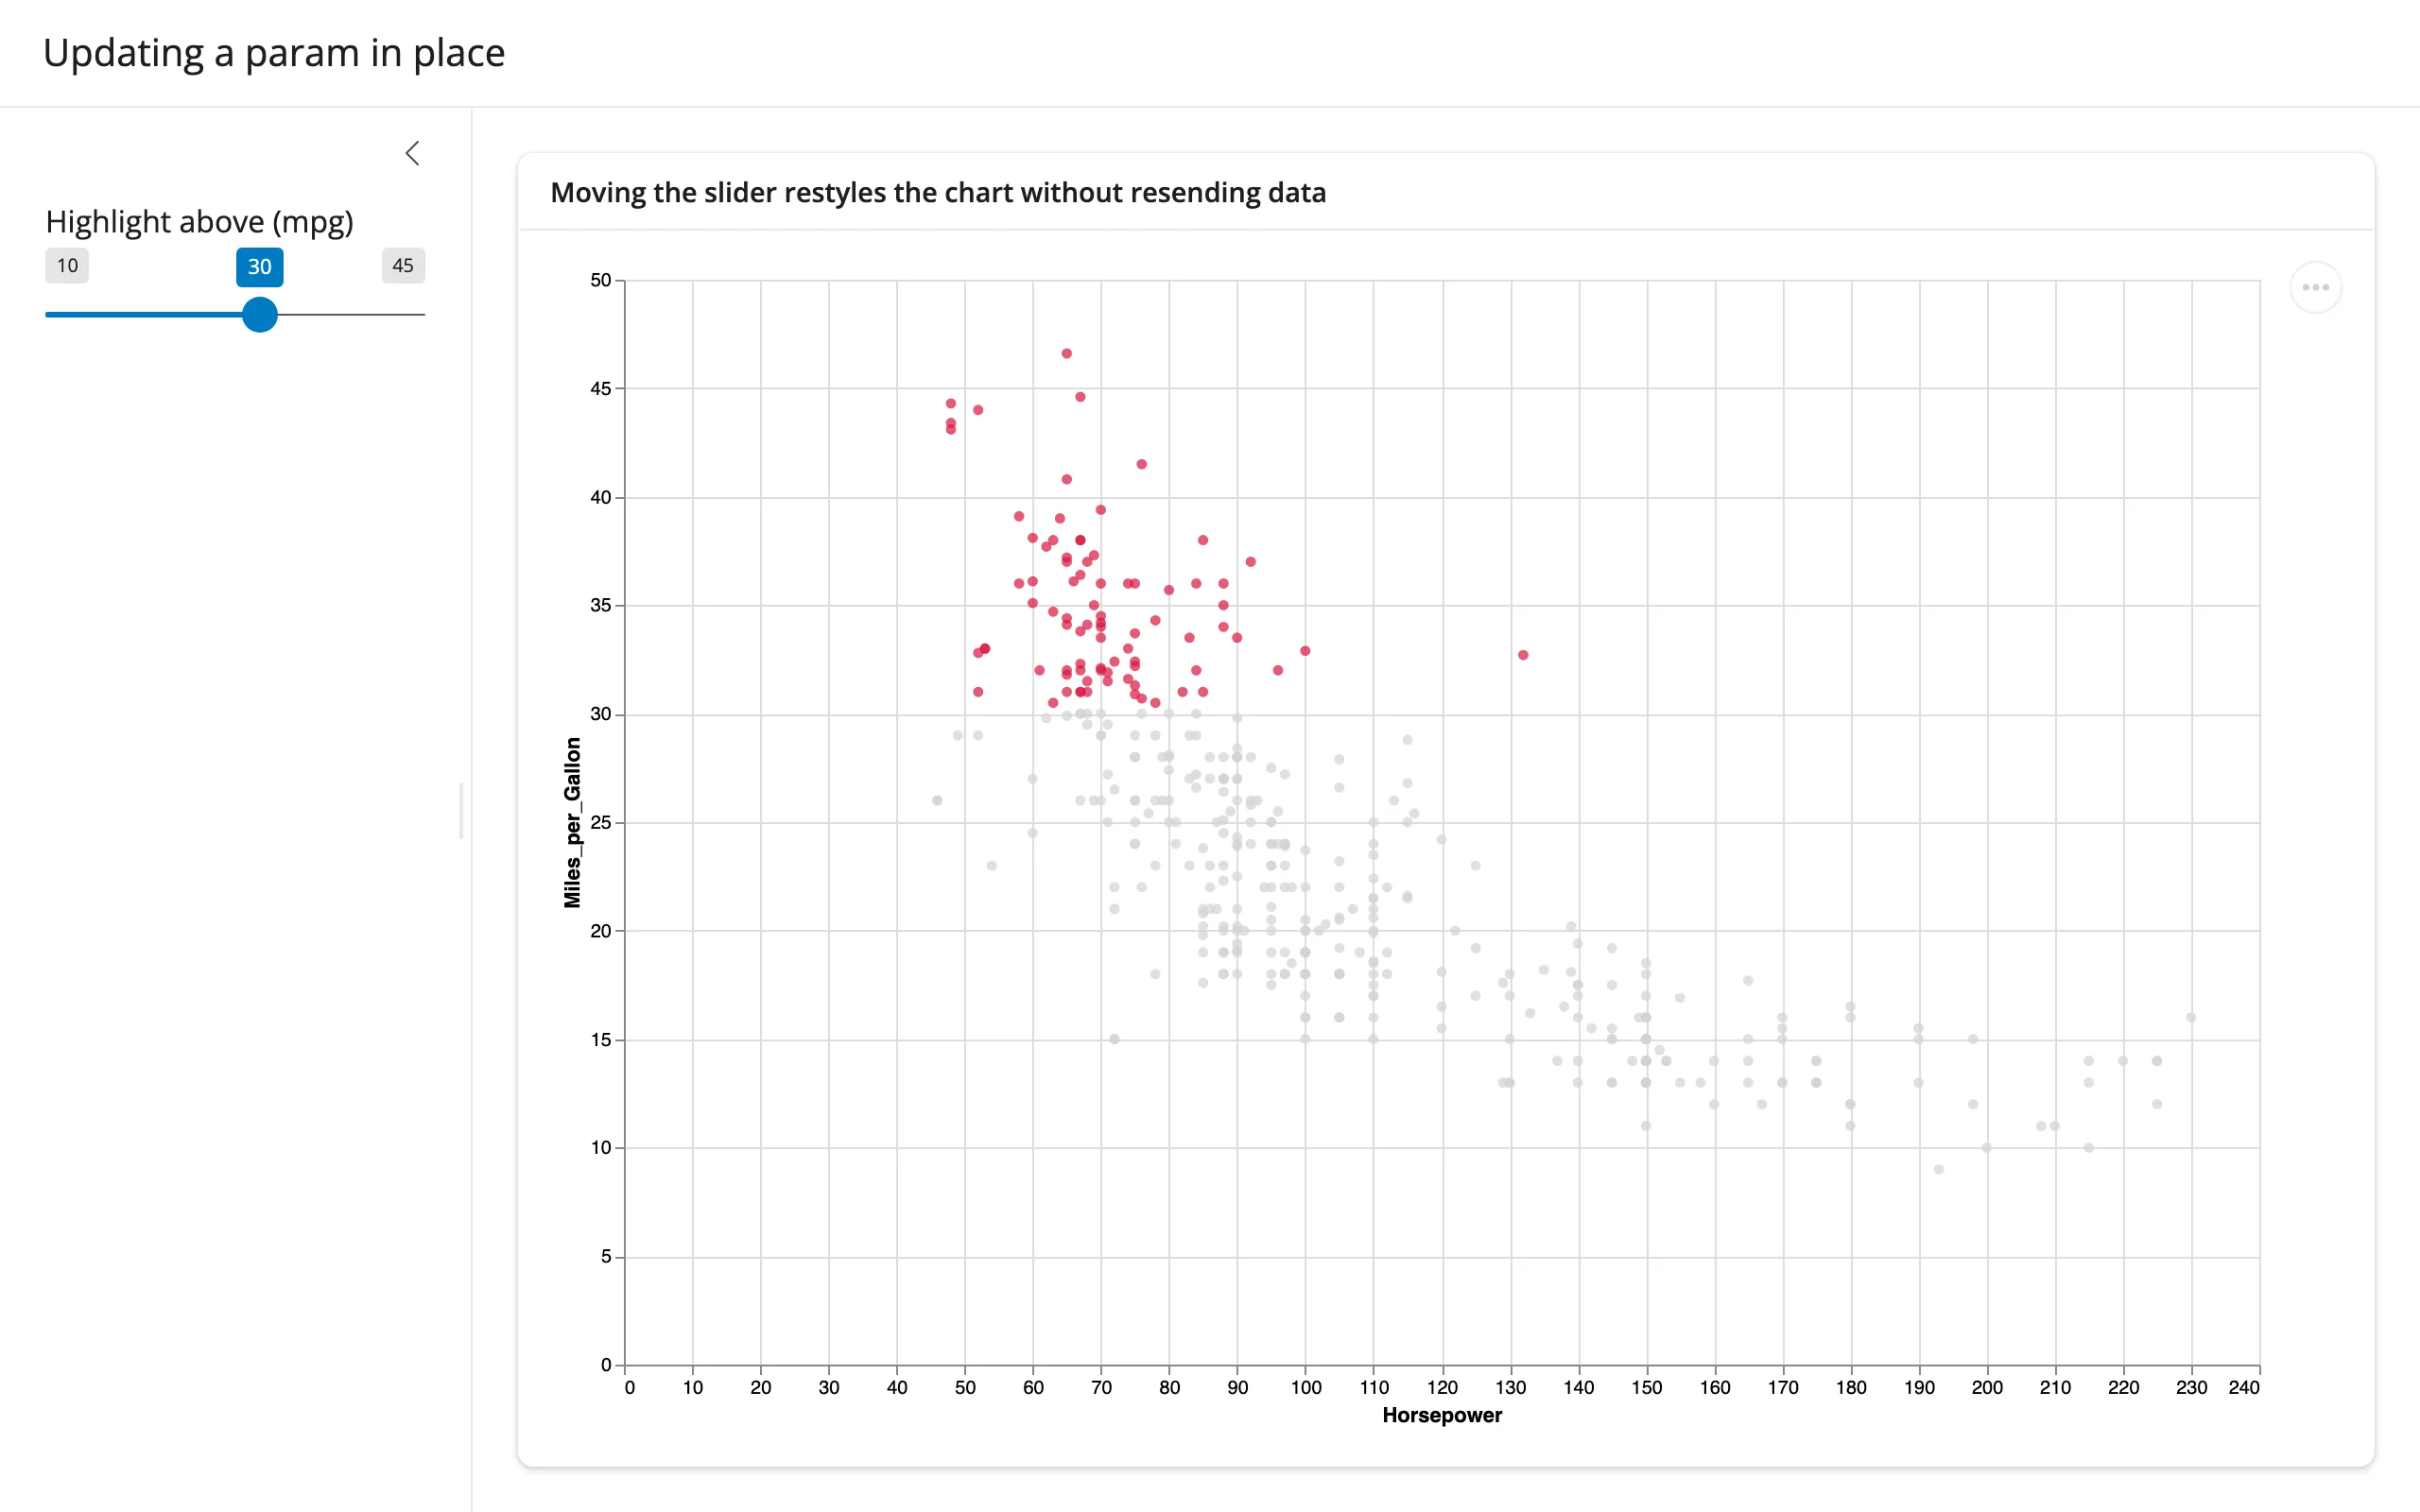
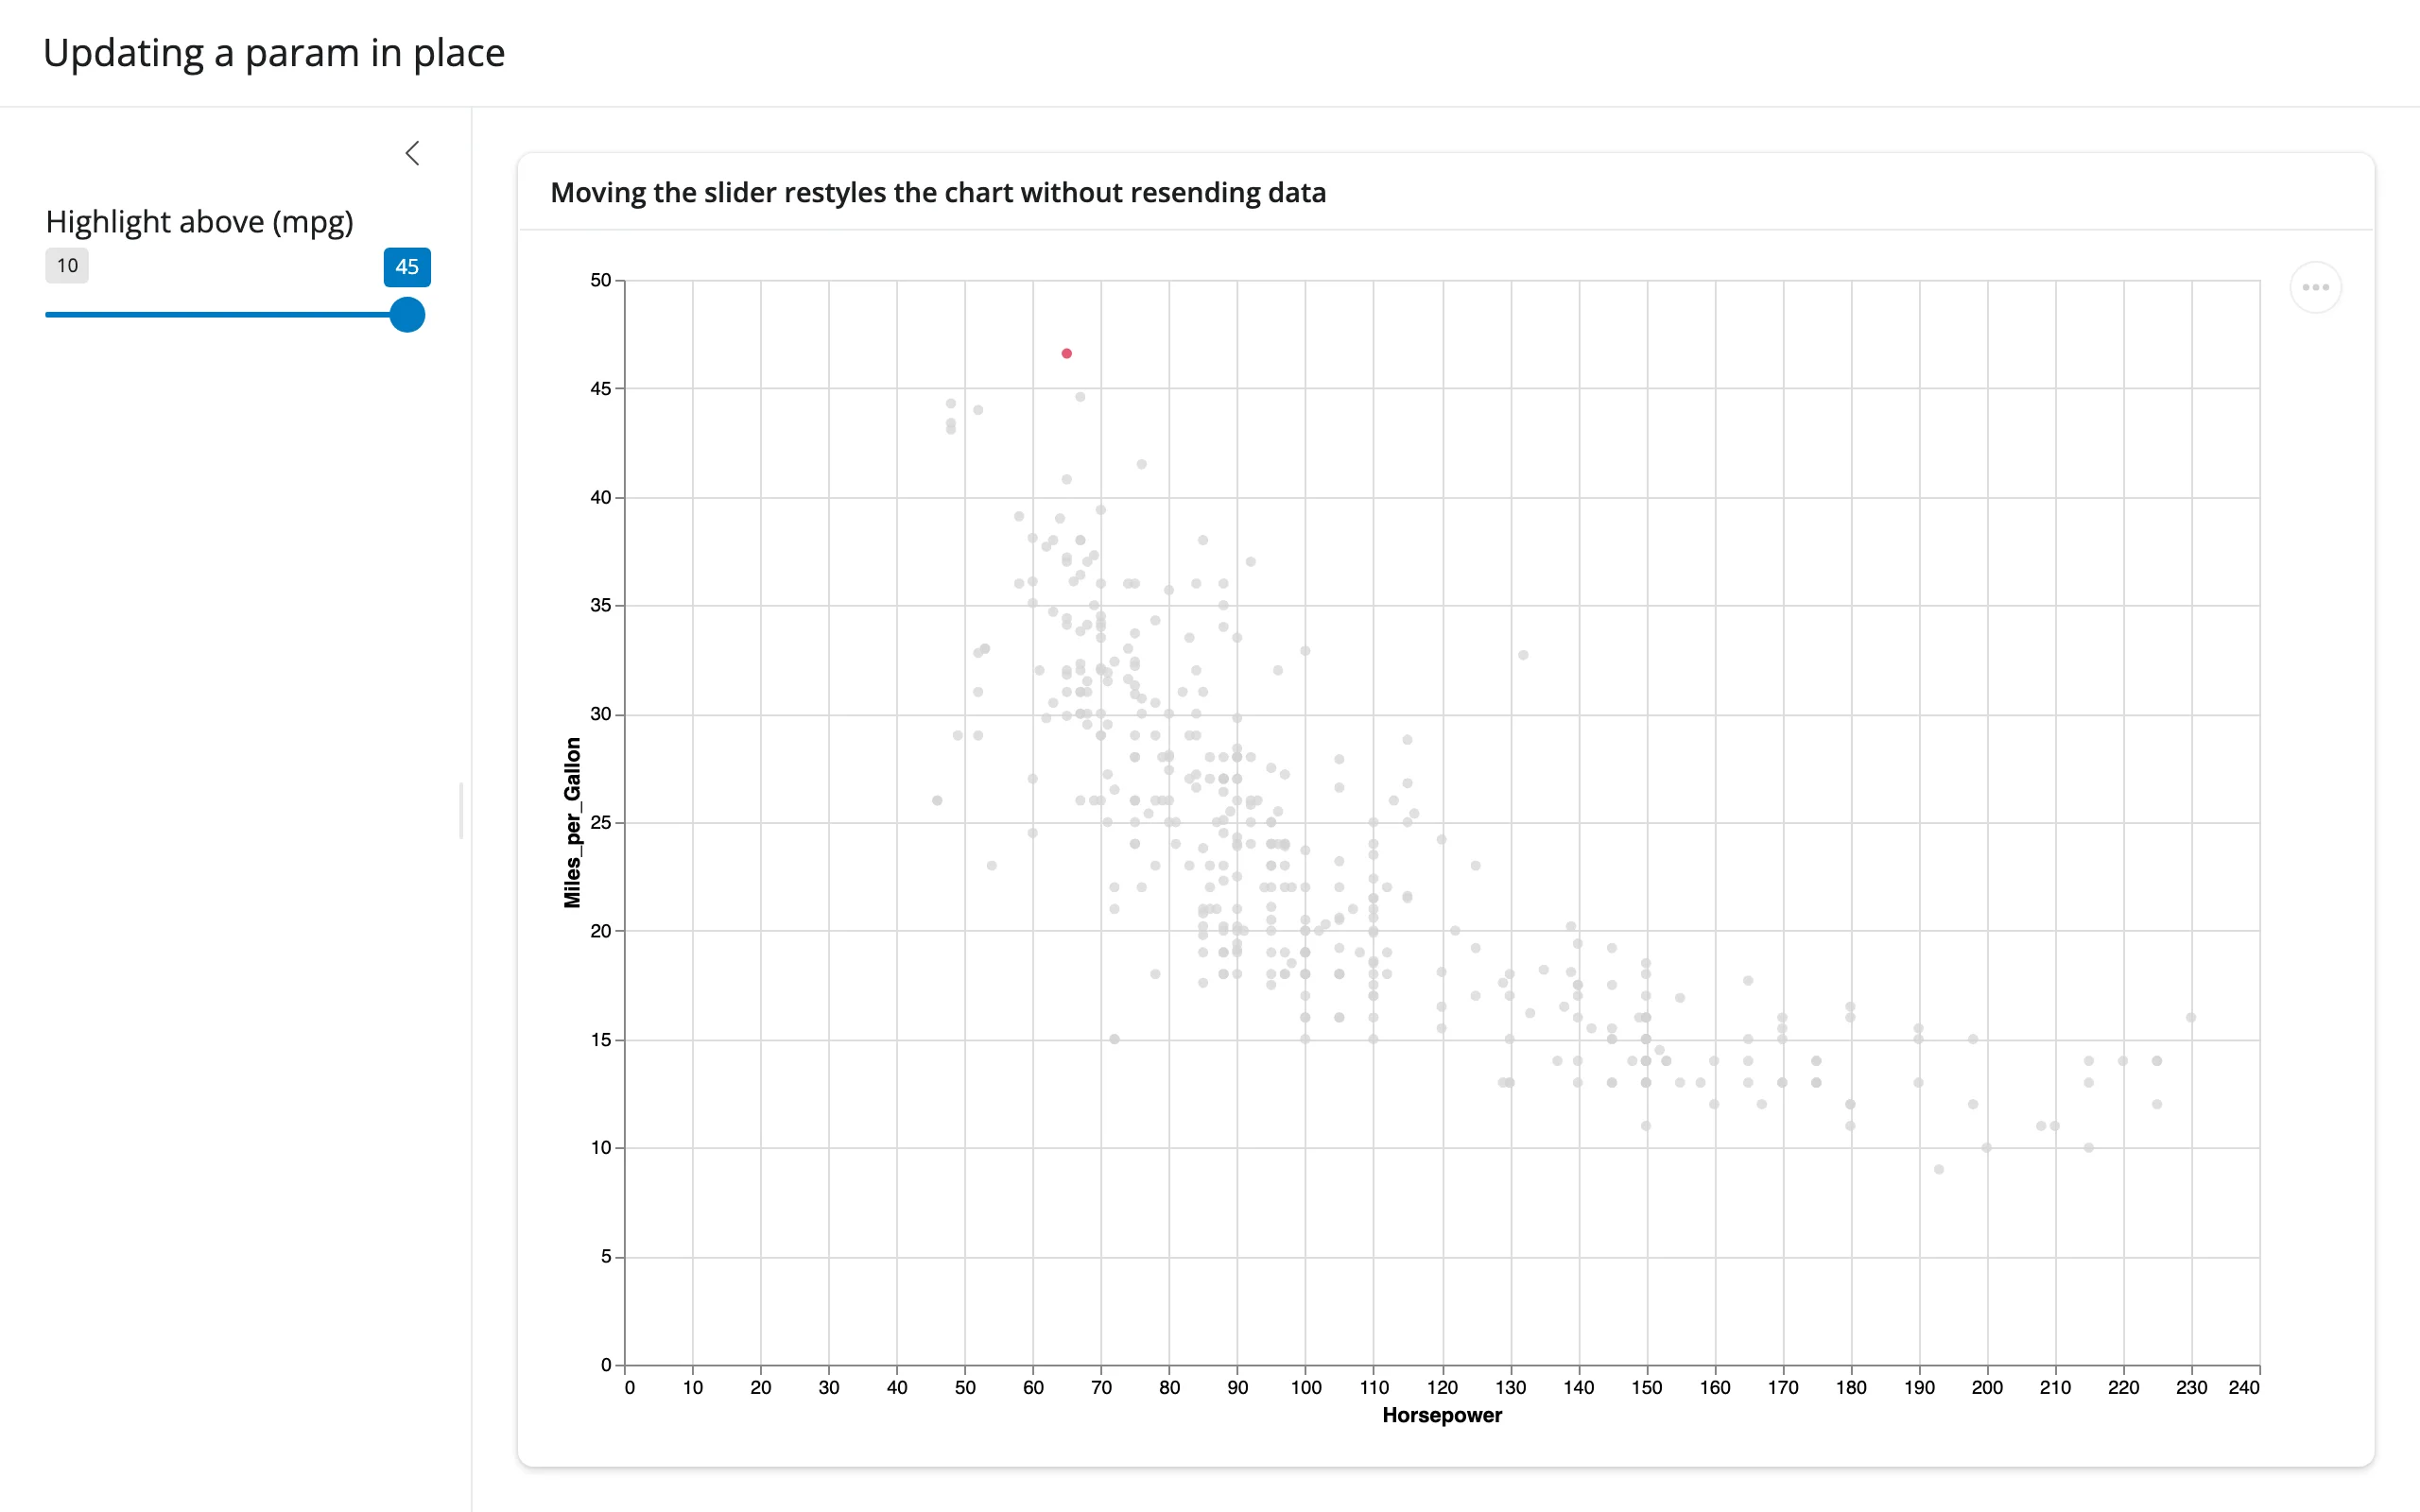
Use in-place param updates when you’re restyling an existing chart (thresholds, highlighted categories, a bound range). Re-render (just read the input in the @render_altair function itself) when the structure changes – different marks, a different data frame, added/removed encodings – since a param can’t add a layer that wasn’t already there. Avoid reassigning chart.widget.chart or chart.widget.spec wholesale from your own code as a substitute for either: see “Gotchas,” below.
Coordinating multiple views
Vega-Lite can link views entirely on its own, with transform_filter(selection) – no server round trip, updates on every mouse-move. Shiny’s accessors let you link through Python instead, which costs a round trip but lets you do anything Python can do: pandas aggregation, calling a model, writing to a database, or feeding a completely different kind of output. The two are not mutually exclusive – the clearest showcase is the same chart doing both at once.
Two ways to link a selection
import altair as alt
from altair.datasets import data
from shiny.express import render, ui

from shinywidgets import render_altair

ui.page_opts(title="Two ways to link a selection", fillable=True)

cars = data.cars()

with ui.card(full_screen=True):
    ui.card_header("Brush the scatter plot")

    @render_altair
    def chart():
        brush = alt.selection_interval(name="brush", encodings=["x"])
        top = (
            alt.Chart(cars)
            .mark_point()
            .encode(x="Horsepower:Q", y="Miles_per_Gallon:Q")
            .properties(height=260)
            .add_params(brush)
        )
        # Filtered entirely inside Vega-Lite: no Python round trip, updates
        # on every mouse-move while dragging.
        bottom = (
            alt.Chart(cars)
            .mark_bar()
            .encode(x="Origin:N", y="count()")
            .properties(height=140)
            .transform_filter(brush)
        )
        return top & bottom

with ui.card():
    ui.card_header("Through Shiny: a stat Vega-Lite's grammar can't compute")

    @render.text
    def summary():
        rows = chart.selected_rows("brush")
        if len(rows) == 0:
            return "Brush the scatter plot above to select cars."
        return f"{len(rows)} selected, average {rows['Miles_per_Gallon'].mean():.1f} mpg"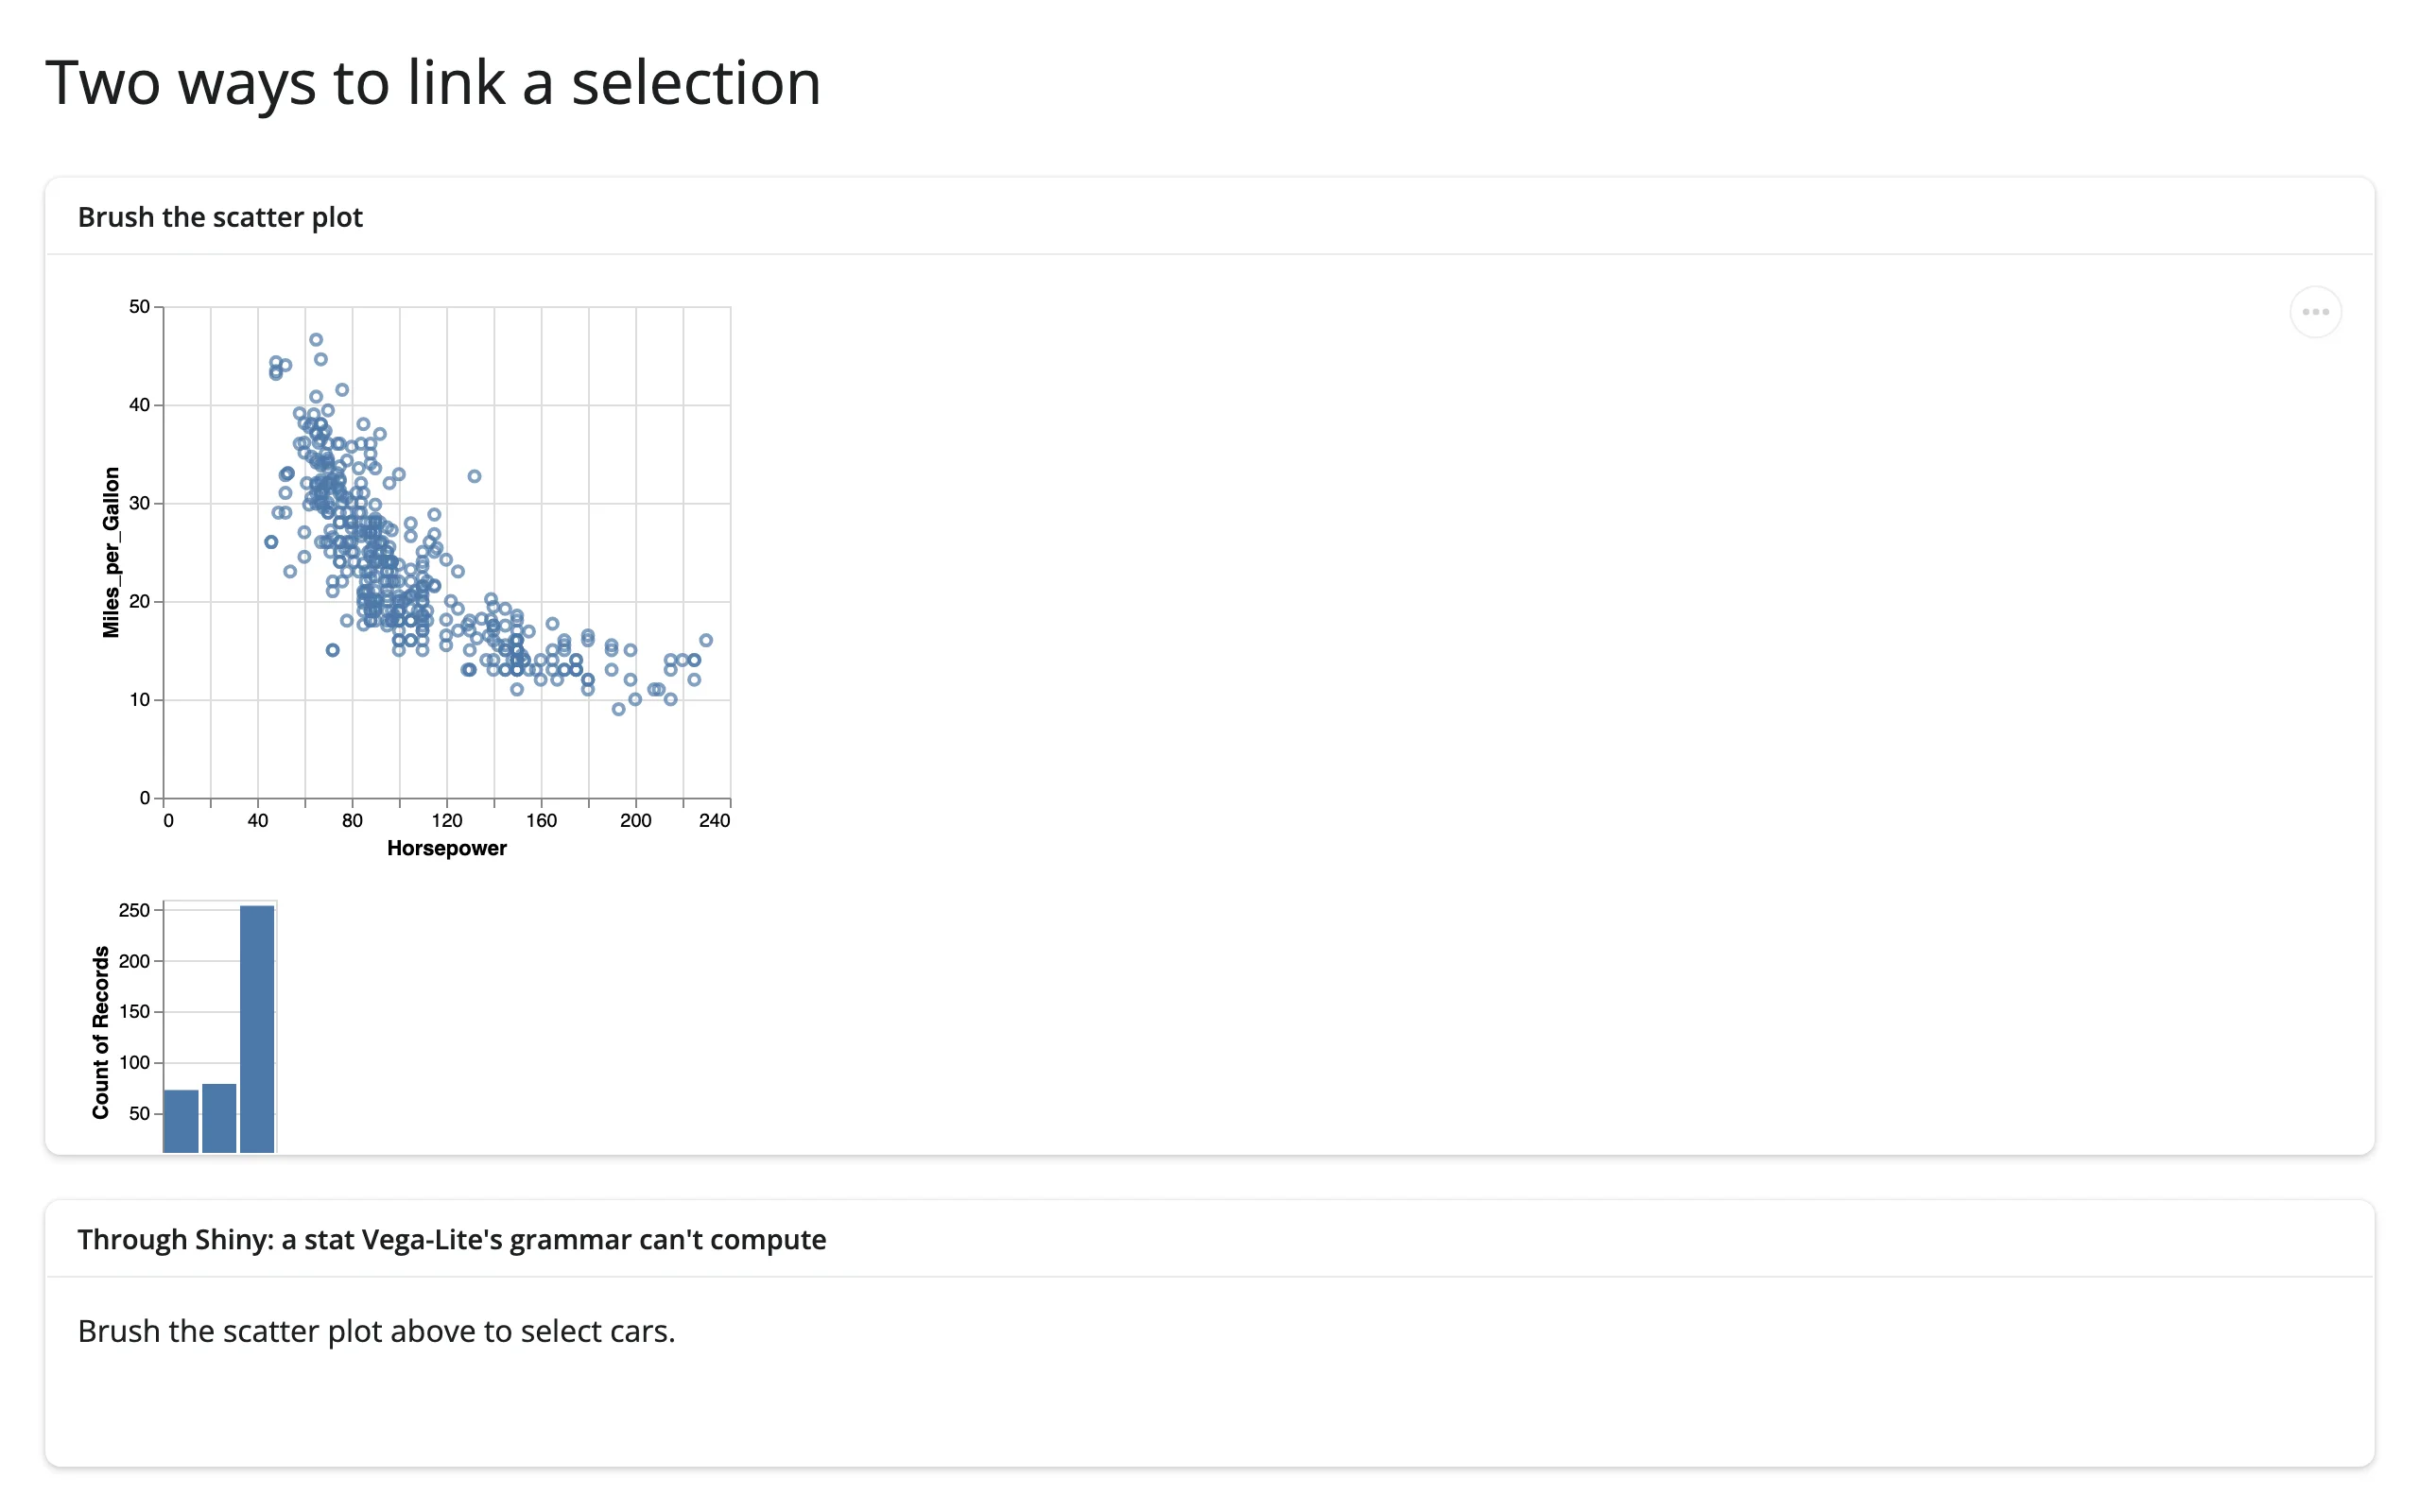
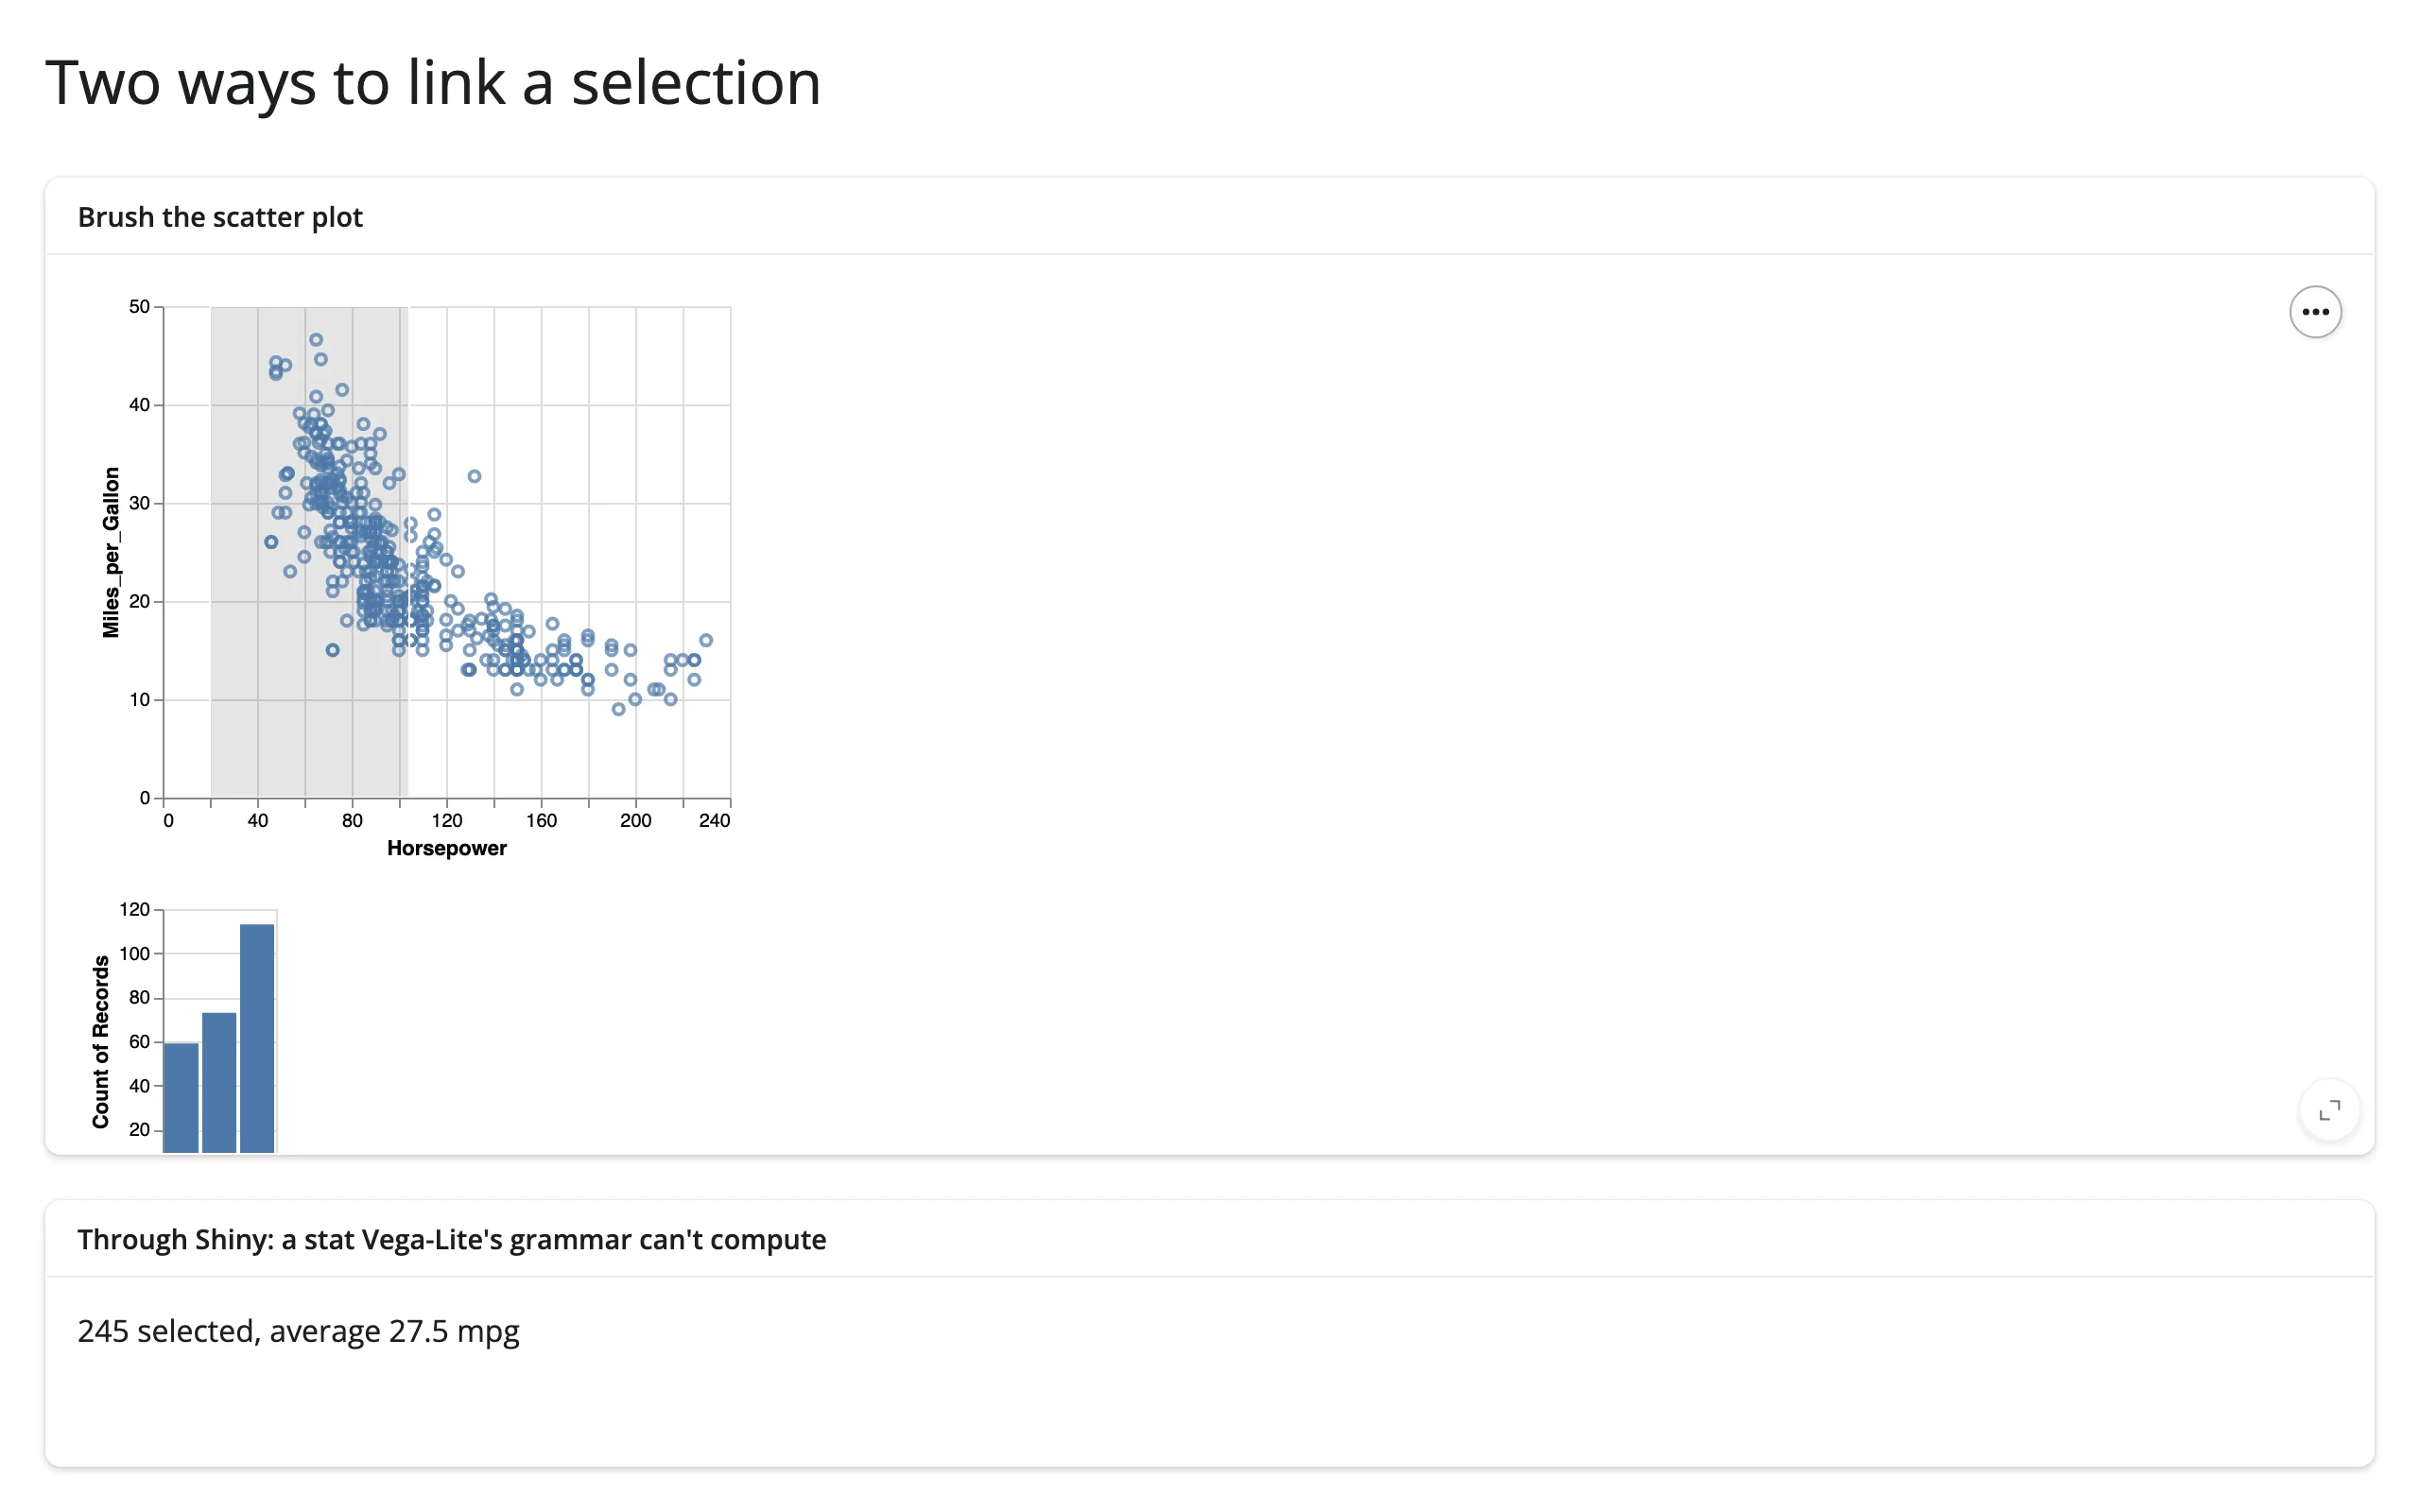
The bar chart under the scatter plot is pure Vega-Lite: transform_filter recomputes the counts in the browser on every frame of the drag. The text below it is pure Shiny: averaging the selected rows’ mpg isn’t something Vega-Lite’s grammar can express, so it goes through selected_rows(). Rule of thumb: reach for transform_filter / shared params when the derived view is itself a Vega-Lite chart filtering or recoloring the same data; reach for the accessors when you need arbitrary Python, a different kind of output (a value box, a table, another widget entirely), or server-side state.
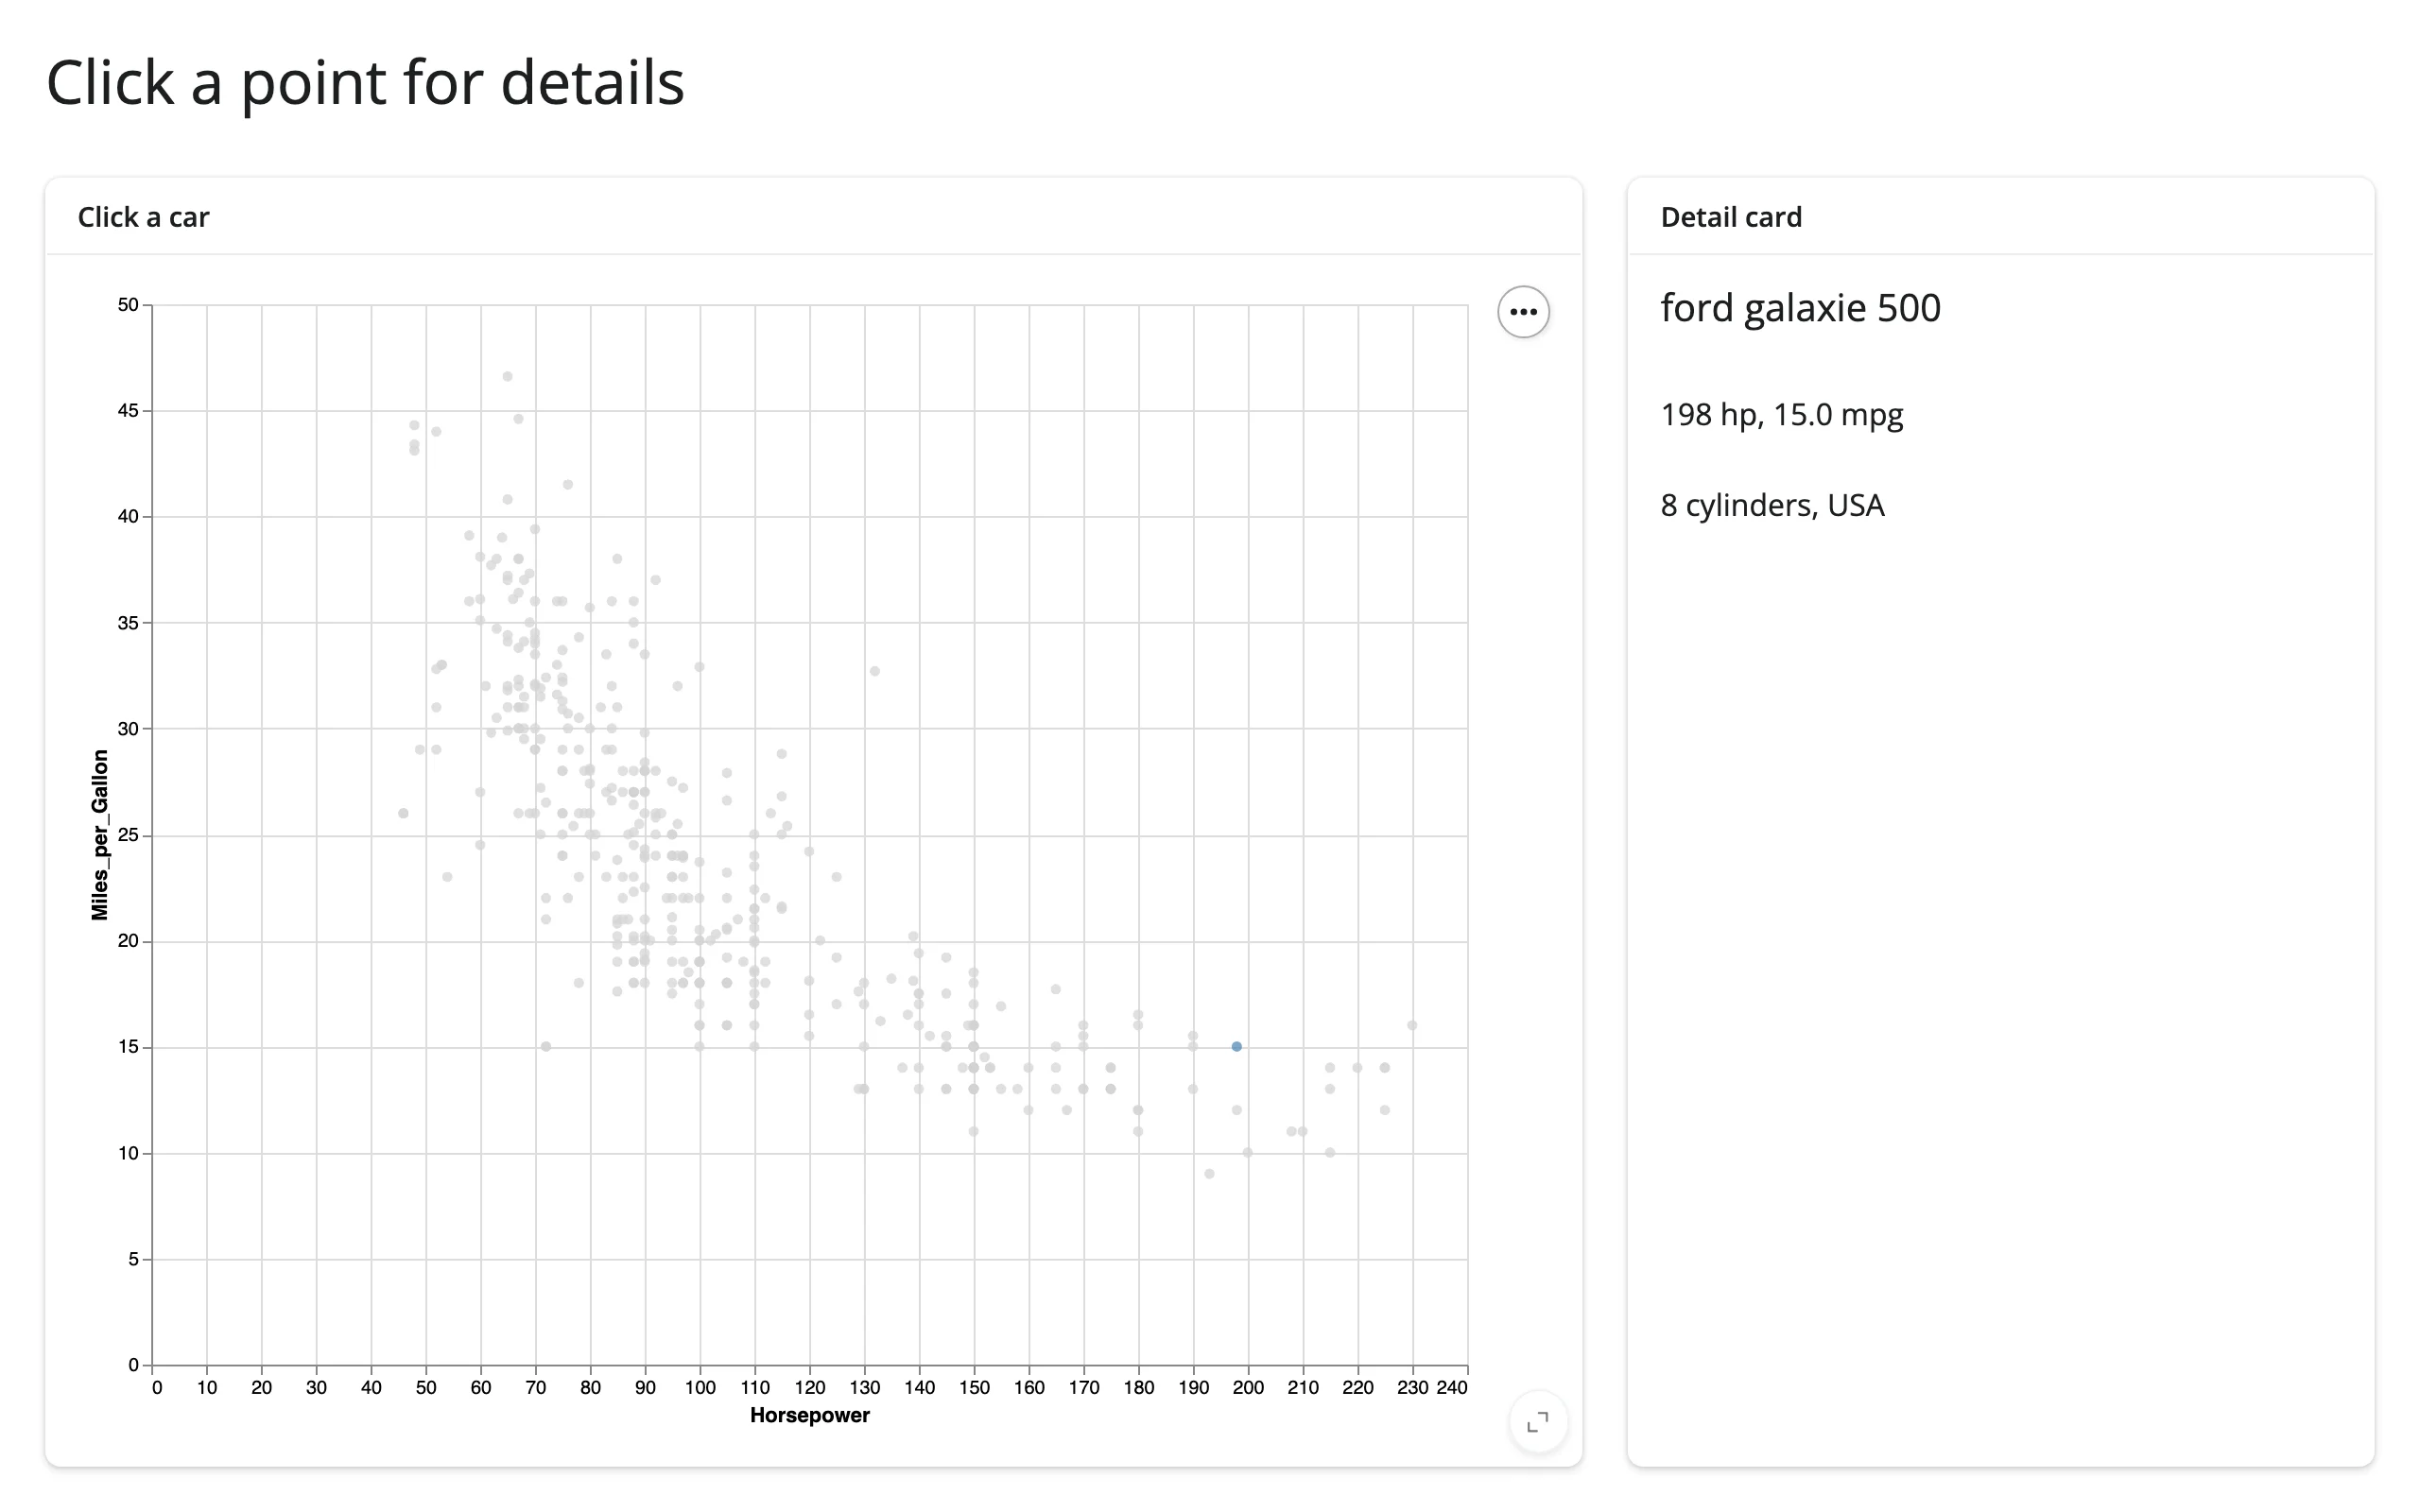
Click a point for details
A single-mark IndexSelection is a natural fit for a “detail card” pattern – the selected row’s other columns (not just the ones plotted) render as free-form UI.
import altair as alt
from altair.datasets import data
from shiny.express import render, ui

from shinywidgets import render_altair

ui.page_opts(title="Click a point for details", fillable=True)

cars = data.cars()

with ui.layout_columns(col_widths=[8, 4]):
    with ui.card(full_screen=True):
        ui.card_header("Click a car")

        @render_altair
        def scatter():
            pick = alt.selection_point(name="pick")
            return (
                alt.Chart(cars)
                .mark_circle()
                .encode(
                    x="Horsepower:Q",
                    y="Miles_per_Gallon:Q",
                    color=alt.condition(pick, alt.value("steelblue"), alt.value("lightgray")),
                )
                .add_params(pick)
            )

    with ui.card(full_screen=True):
        ui.card_header("Detail card")

        @render.ui
        def detail():
            rows = scatter.selected_rows("pick")
            if len(rows) == 0:
                return ui.p("Click a point to see its details.")
            car = rows.iloc[0]
            return ui.TagList(
                ui.h5(car["Name"]),
                ui.p(f"{car['Horsepower']:.0f} hp, {car['Miles_per_Gallon']:.1f} mpg"),
                ui.p(f"{car['Cylinders']} cylinders, {car['Origin']}"),
            )
Brush an Altair chart, render a different widget
The accessors work the same way regardless of what consumes them – including a different @render_* output entirely. Here, a brushed selection feeds a reactable table instead of @render.data_frame:
import altair as alt
from altair.datasets import data
from reactable import Reactable
from shiny.express import ui

from shinywidgets import render_altair, render_reactable

ui.page_opts(title="Brush an altair chart, render a reactable table", fillable=True)

cars = data.cars()

with ui.layout_columns(col_widths=[8, 4]):
    with ui.card(full_screen=True):
        ui.card_header("Drag a box to brush")

        @render_altair
        def scatter():
            brush = alt.selection_interval(name="brush")
            return (
                alt.Chart(cars)
                .mark_circle()
                .encode(
                    x="Horsepower:Q",
                    y="Miles_per_Gallon:Q",
                    color=alt.condition(brush, "Origin:N", alt.value("lightgray")),
                )
                .add_params(brush)
            )

    with ui.card(full_screen=True):
        ui.card_header("Selected rows, as a reactable table")

        @render_reactable
        def tbl():
            # reactable reads its data once per render, so a new selection
            # means a new table rather than an in-place update.
            rows = scatter.selected_rows("brush")[["Name", "Horsepower", "Miles_per_Gallon"]]
            return Reactable(rows, default_page_size=6)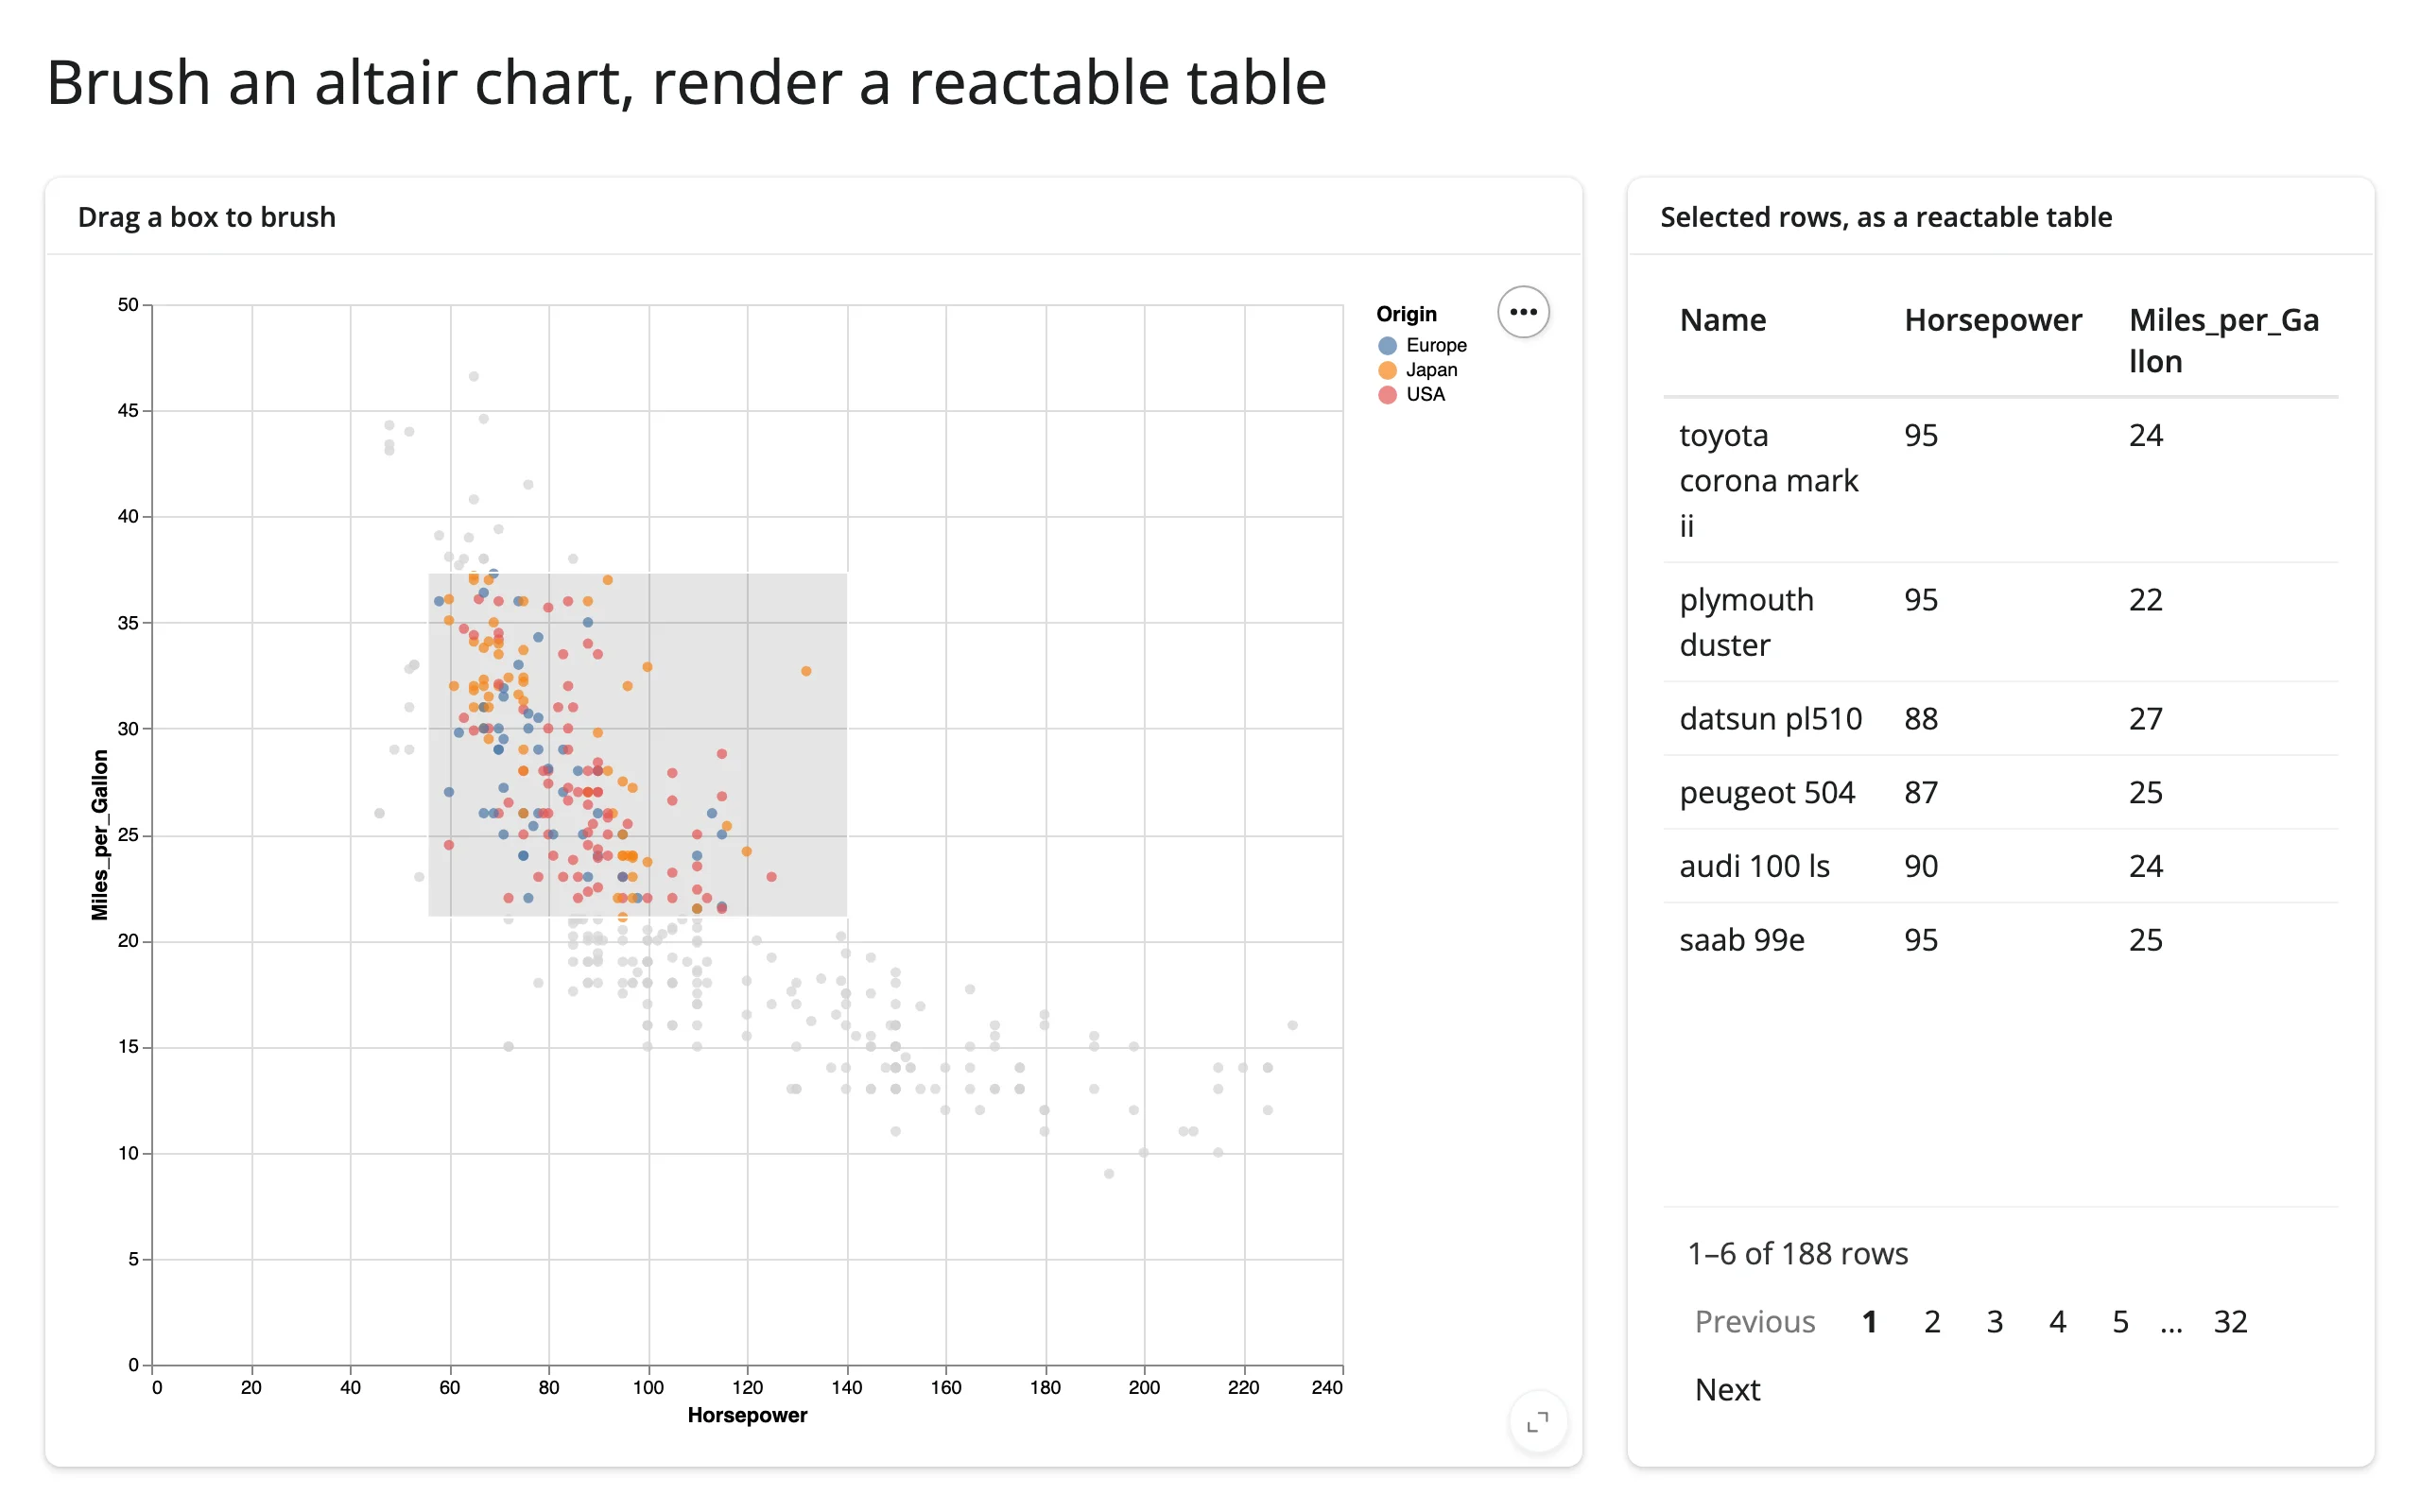
This pairs naturally with any table or chart renderer in the roster – the brush doesn’t need to know what’s downstream.
Large data
More than 5,000 rows raises MaxRowsError on a bare DataFrame (see Gotchas) unless you opt into a transformer that stops inlining raw rows into the spec. VegaFusion (alt.data_transformers.enable("vegafusion")) runs bin/aggregate transforms in Python via DataFusion instead of the browser, and selected()/selected_rows() keep working through it – but it only pays off when the chart aggregates. Measured directly: a binned histogram’s spec stays flat (about 3.7-5.5 KB) from 5,000 to 2,000,000 rows, while a raw per-row mark_circle scatter’s spec still grows linearly (344 KB at 5,000 rows to 134 MB at 2,000,000) – VegaFusion moves where the transform runs, it doesn’t shrink a raw-point payload.
import altair as alt
import numpy as np
import pandas as pd
from shiny.express import render, ui

from shinywidgets import render_altair

# Above ~5,000 rows, Altair raises MaxRowsError on a bare DataFrame unless you
# opt into a transformer that stops inlining raw rows into the spec. VegaFusion
# computes bin/aggregate transforms in Python (via DataFusion) instead of the
# browser, so only the aggregated result crosses the wire -- not the million
# rows behind it. Assign the return value: Shiny Express auto-displays any
# bare top-level expression, including the enabler object `enable()` returns.
_ = alt.data_transformers.enable("vegafusion")

rng = np.random.default_rng(0)
n = 1_000_000
df = pd.DataFrame({"value": rng.normal(loc=50, scale=15, size=n)})

ui.page_opts(title="VegaFusion at scale", fillable=True)

with ui.layout_columns(col_widths=[8, 4]):
    with ui.card(full_screen=True):
        ui.card_header(f"Click a bar ({n:,} rows, aggregated with VegaFusion)")

        @render_altair
        def histogram():
            pick = alt.selection_point(name="bin", encodings=["x"])
            return (
                alt.Chart(df)
                .mark_bar()
                .encode(x=alt.X("value:Q", bin=alt.Bin(maxbins=40)), y="count()")
                .add_params(pick)
            )

    with ui.card(full_screen=True):
        ui.card_header("histogram.selected_rows('bin')")

        @render.code
        def count():
            rows = histogram.selected_rows("bin")
            return f"{len(rows):,} of {len(df):,} rows in the selected bin"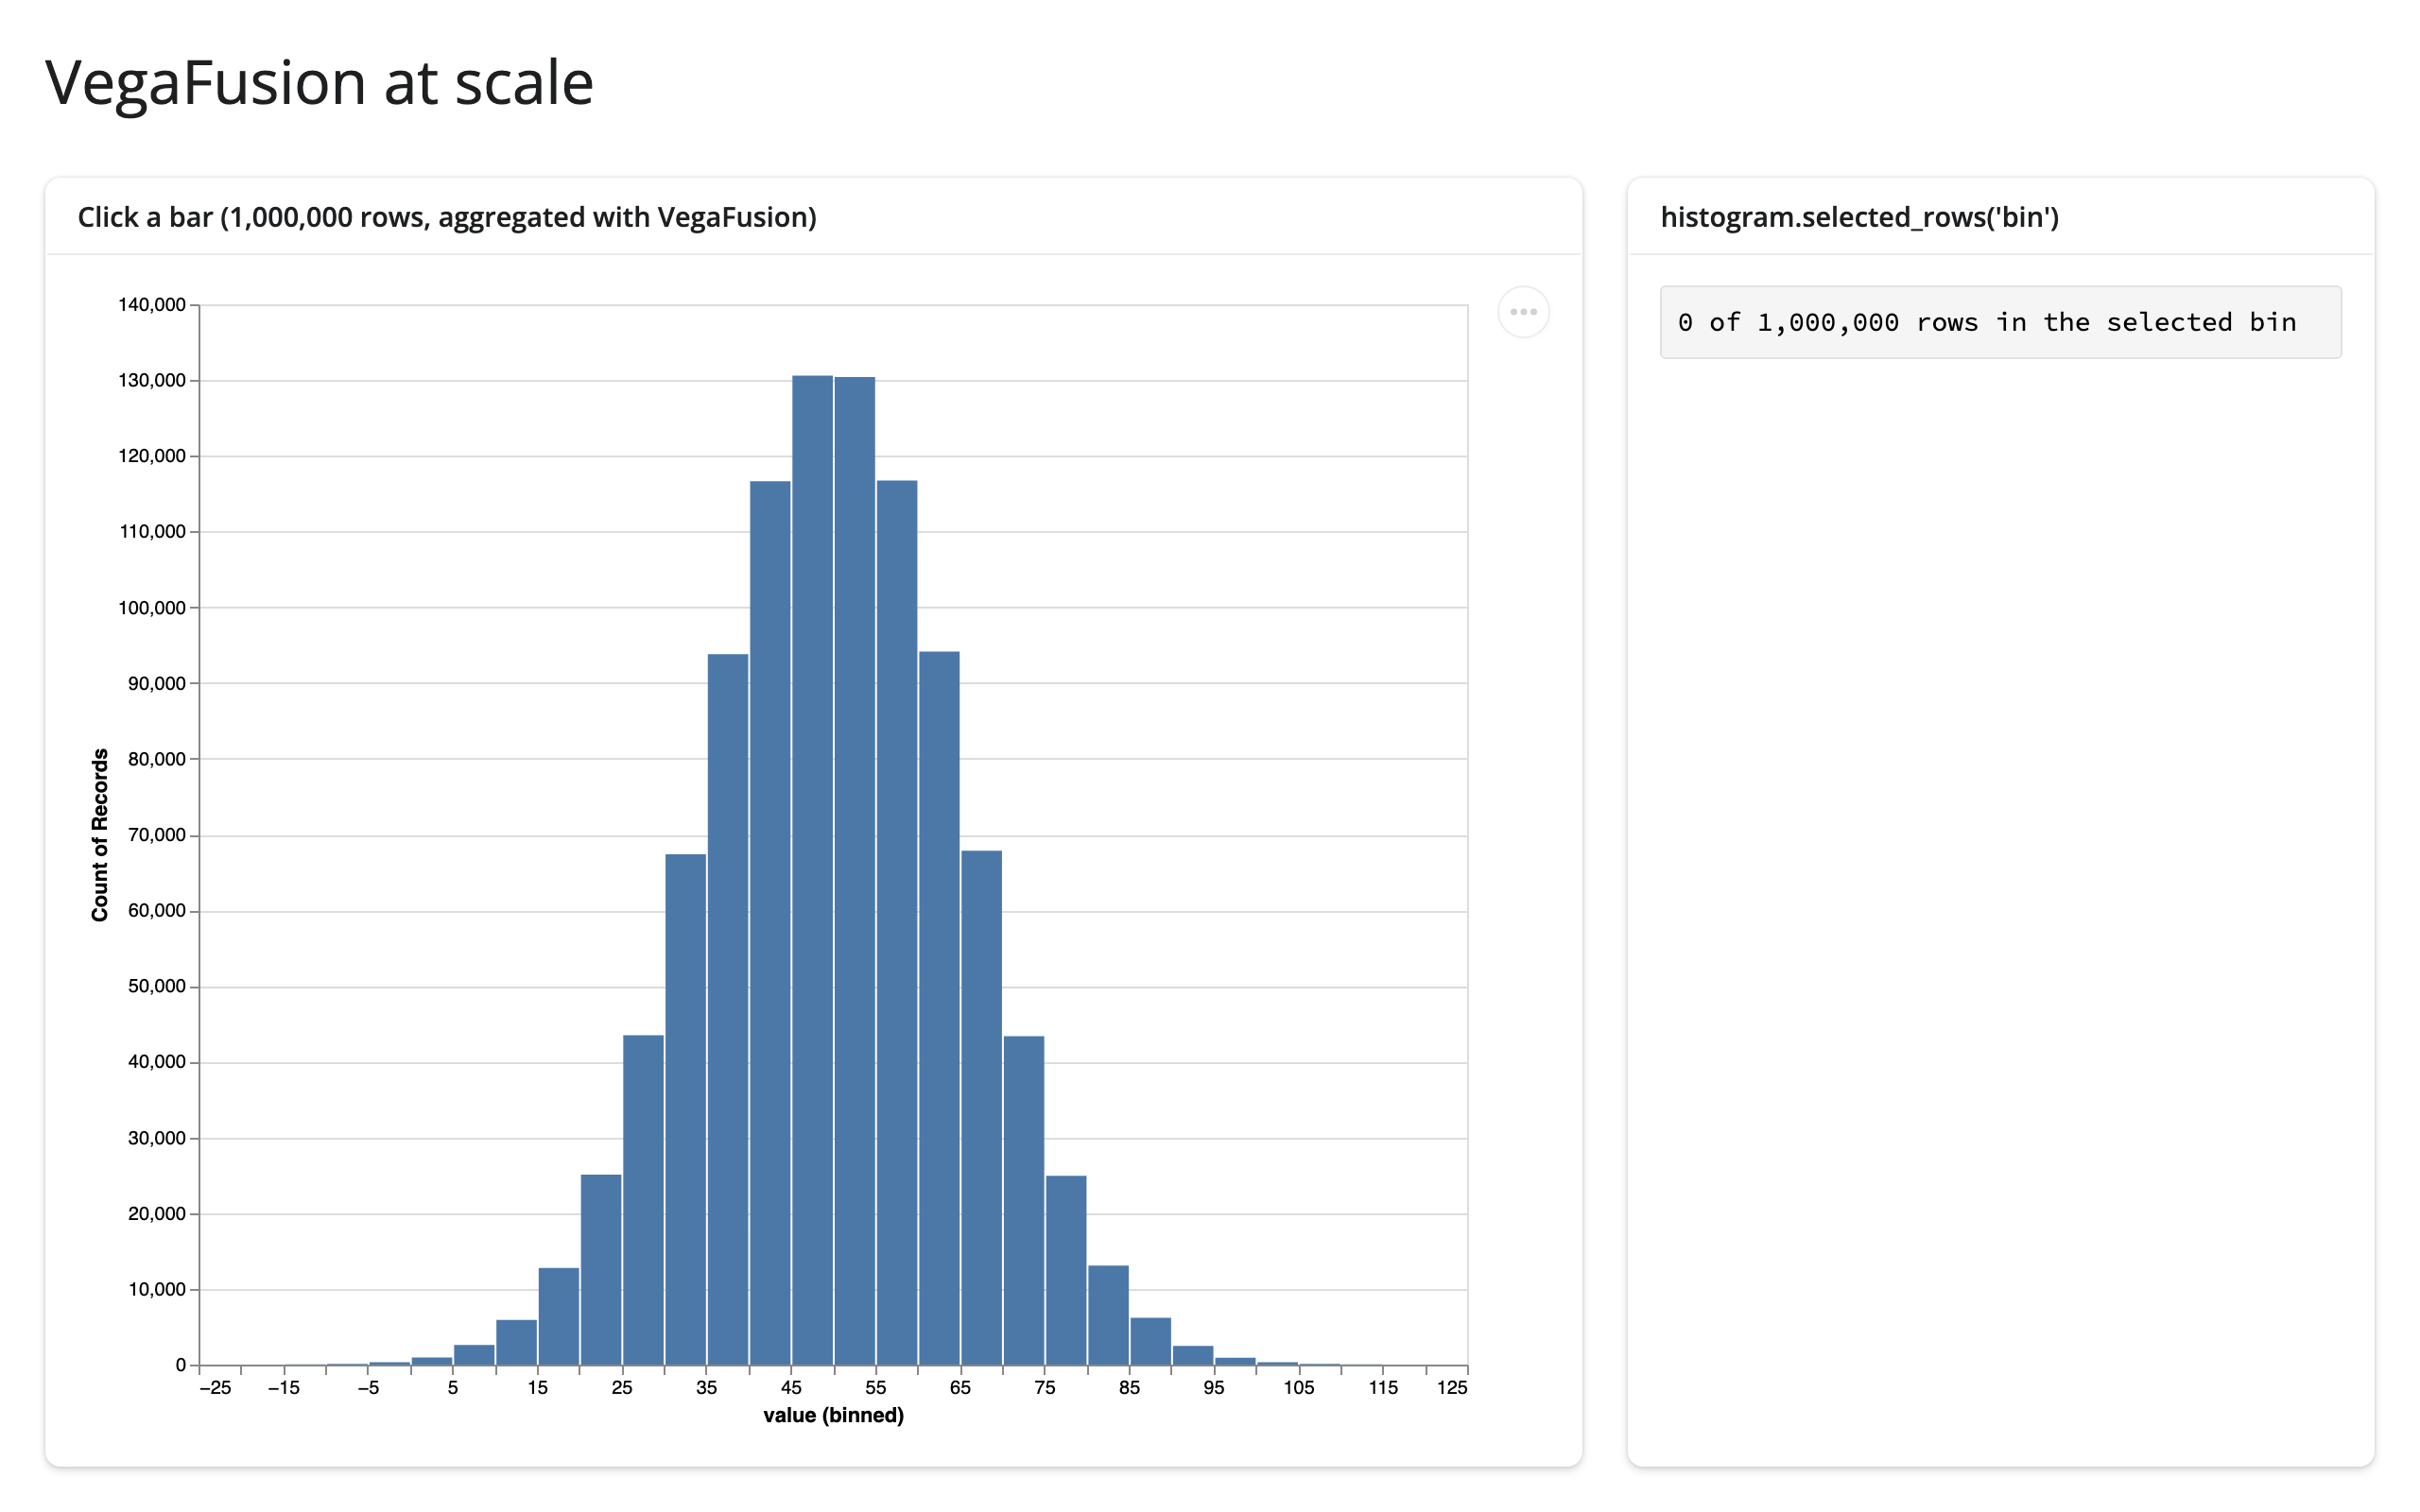
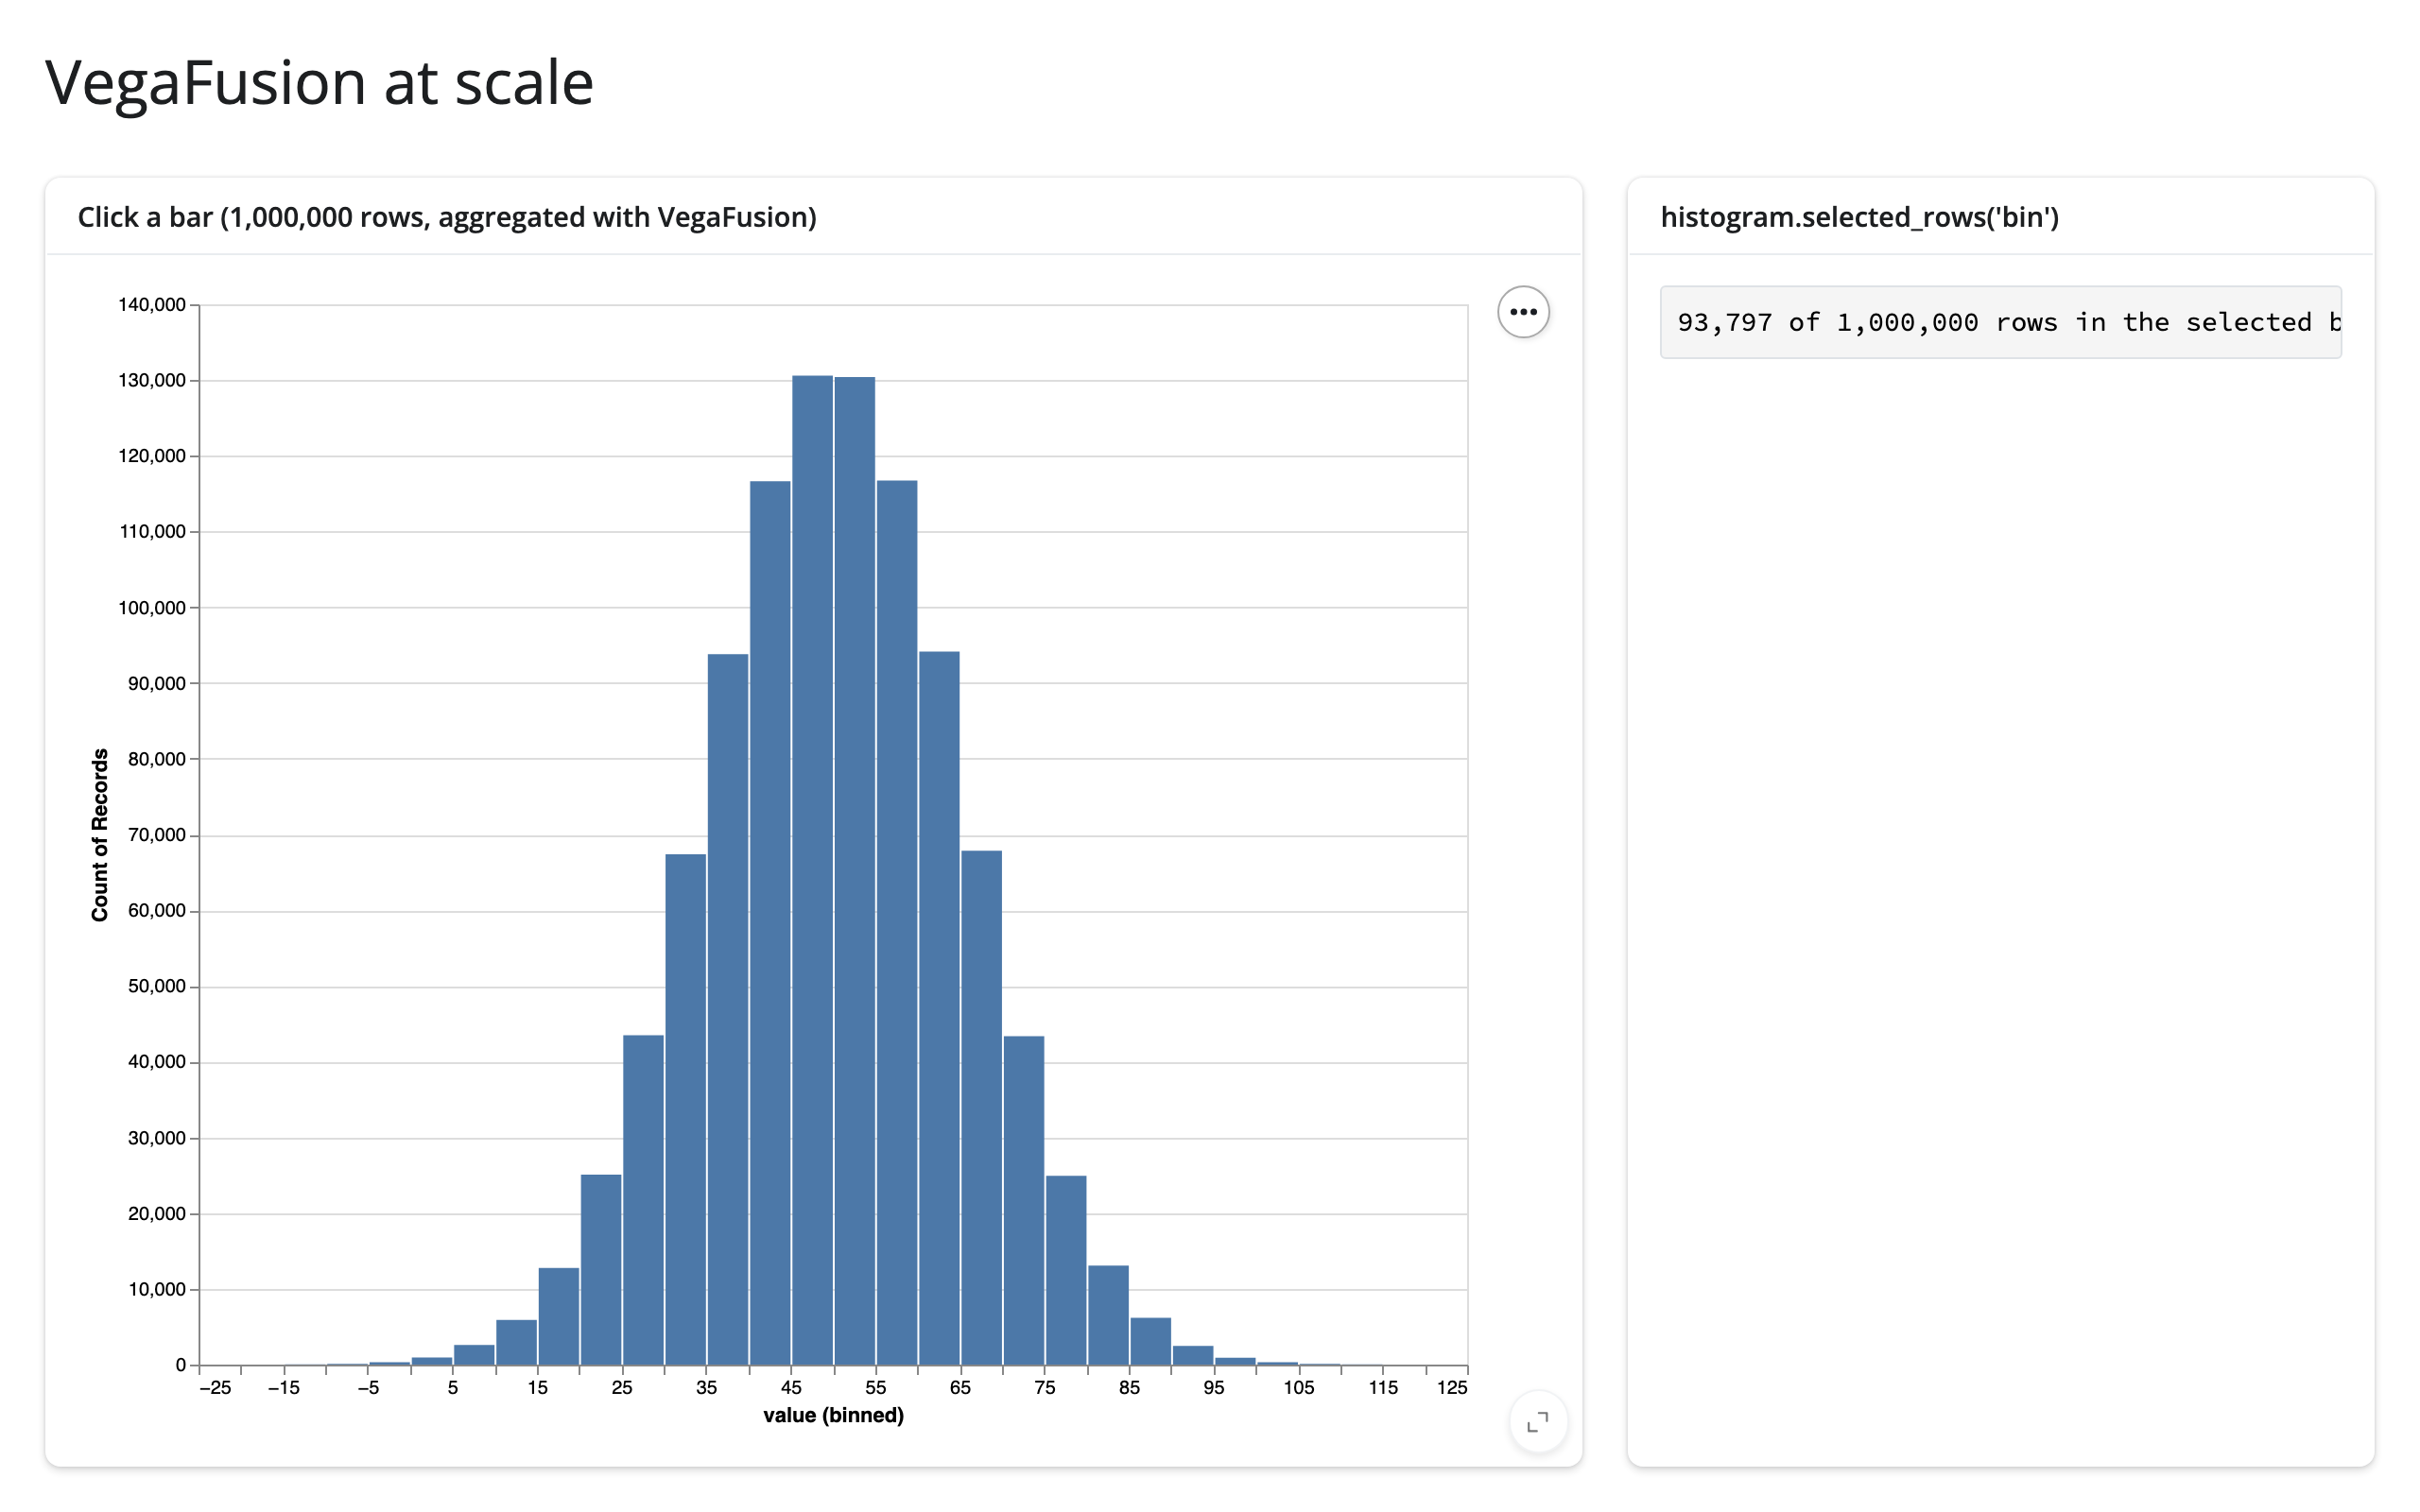
Clicking a bar on 1,000,000 rows still updates selected_rows() correctly (93,797 of 1,000,000 selected, above). Needs both vegafusion and vl-convert-python installed – the altair extra pulls in neither, and with only vegafusion present the chart silently never renders: no browser console error, only a server-log ImportError (#320, the general case of a widget error surfacing only in the server log once rendering has already started). This is the “summarize on the server” approach from Large data & performance.
Layout and sizing
A chart without an explicit width/height is sized to "container" and fills its output – cards, sidebars, full-screen toggles, and window resizes all just work, with no code beyond the usual ui.page_opts(fillable=True) / ui.card(full_screen=True). This applies to a plain alt.Chart and to LayerChart.
Concatenated, faceted, and repeated charts keep their natural size instead. render_altair warns when it sees an alt.concat() for exactly this reason, suggesting shiny.ui.layout_column_wrap() (one chart per card) instead, which does fill; the same limitation applies to |/& (hconcat/vconcat), facet(), and repeat(), which don’t currently trigger the warning. Use a vconcat/hconcat (as in “Two ways to link a selection” above) only when you specifically want several views that share one Vega-Lite spec and its selections; otherwise prefer one chart per card.
An explicit size always wins: .properties(width=..., height=...) (as used for facet() above, and for the two stacked views in “Two ways to link a selection”) pins a chart or sub-view to a fixed size regardless of its container.
Gotchas and limitations
Verified on current main (altair 6.3.0, shiny 1.9.0):
- A point selection’s own highlight can fail to show on an aggregated, binned bar chart. In
06_binned_temporal.py, clicking a histogram bar correctly updatesselected()/selected_rows()in Python, but the clicked bar itself doesn’t turn blue the wayalt.condition(pick, ...)suggests it should. This reproduces in plainvega-embedwith no shinywidgets involved at all, so it’s an upstream Vega-Lite behavior: highlighting a mark by testing a selection against aggregated data doesn’t resolve the way it does against raw rows. The selection itself is correct; only the in-chart color feedback is missing. If you need a visual cue here, drive it from a second, Python-rendered element instead (as the example does with thebin_counttext), rather than fromalt.conditionon the same bar mark. - Two selections in the same view can clear each other. Clicking a legend-bound point selection clears an interval brush in the same chart, and dragging the brush clears the legend pick – verified in both directions (
07_multiple_selections.py). This is Vega-Lite’s own behavior for co-located selections, not something shinywidgets introduces or can suppress. If you want two selections that stay independently “sticky,” put them in separate views. selected_rows()needs a real data frame on the chart, and layered/concatenated charts only hoist one under a specific condition. Altair hoists a shared data frame to the top of a layered or concatenated spec only when every layer was built from the same frame object – checked by identity, not by equal content. Calling a filter function twice (alt.Chart(shown())for one layer,alt.Chart(shown())again for another) produces two distinct objects even if their contents are identical, andselected_rows()then can’t find a frame to filter and raisesTypeError. Compute the frame once and reuse the same object for every layer, or passselected_rows(df=...)explicitly (seegallery/showcase_weather_dashboard.py, which does both: it reuses onedataobject across the chart’s layers and passesdf=to the accessor for clarity). This isn’t documented anywhere upstream or in theselected_rows()docstring, and it’s an easy mistake to repeat.- Selections are read-only from Python. There’s no supported way to move a brush or set a legend pick from Python; use a param (
alt.param) for anything you want to drive from the server side, as in “Updating the widget from Python.” - Reassigning
chart.widget.chart(or.spec) wholesale resends the chart’s entire data payload and replaceschart.widget.selections/.params. This also means Altair’s own documented idiom for reacting to selections,jchart.selections.observe(callback, ["name"]), stops firing after such a reassignment, because it’s watching the nested.selectionsobject that gets replaced. We verified thatselected()/selected_rows()do not have this problem – they watch a lower-level trait on the widget that survives a.chartreassignment, so the accessors keep working (reset to empty, then pick up the next gesture normally) even if your own code replaces.chart. Prefer a param update or a full re-render over reassigning.chart/.specyourself regardless, since the data resend and sizing reset still apply. - More than 5,000 rows raises
MaxRowsErrorunless you callalt.data_transformers.disable_max_rows()or enable the VegaFusion transformer (alt.data_transformers.enable("vegafusion"), which additionally requirespyarrow). Both are upstream Altair settings, not somethingrender_altairchanges. JupyterChartloads its JavaScript from a CDN at runtime. For an offline or firewalled deployment, callalt.JupyterChart.enable_offline()(requiresvl-convert-python, included in thealtairextra) once at import time.- A module-level docstring renders as page text in Shiny Express, not just as Python metadata – this bit both gallery apps below during writing. Use a
#-comment header instead of a triple-quoted string at the top of an Express file if you want file-level notes that don’t show up in the UI.
Gallery candidates
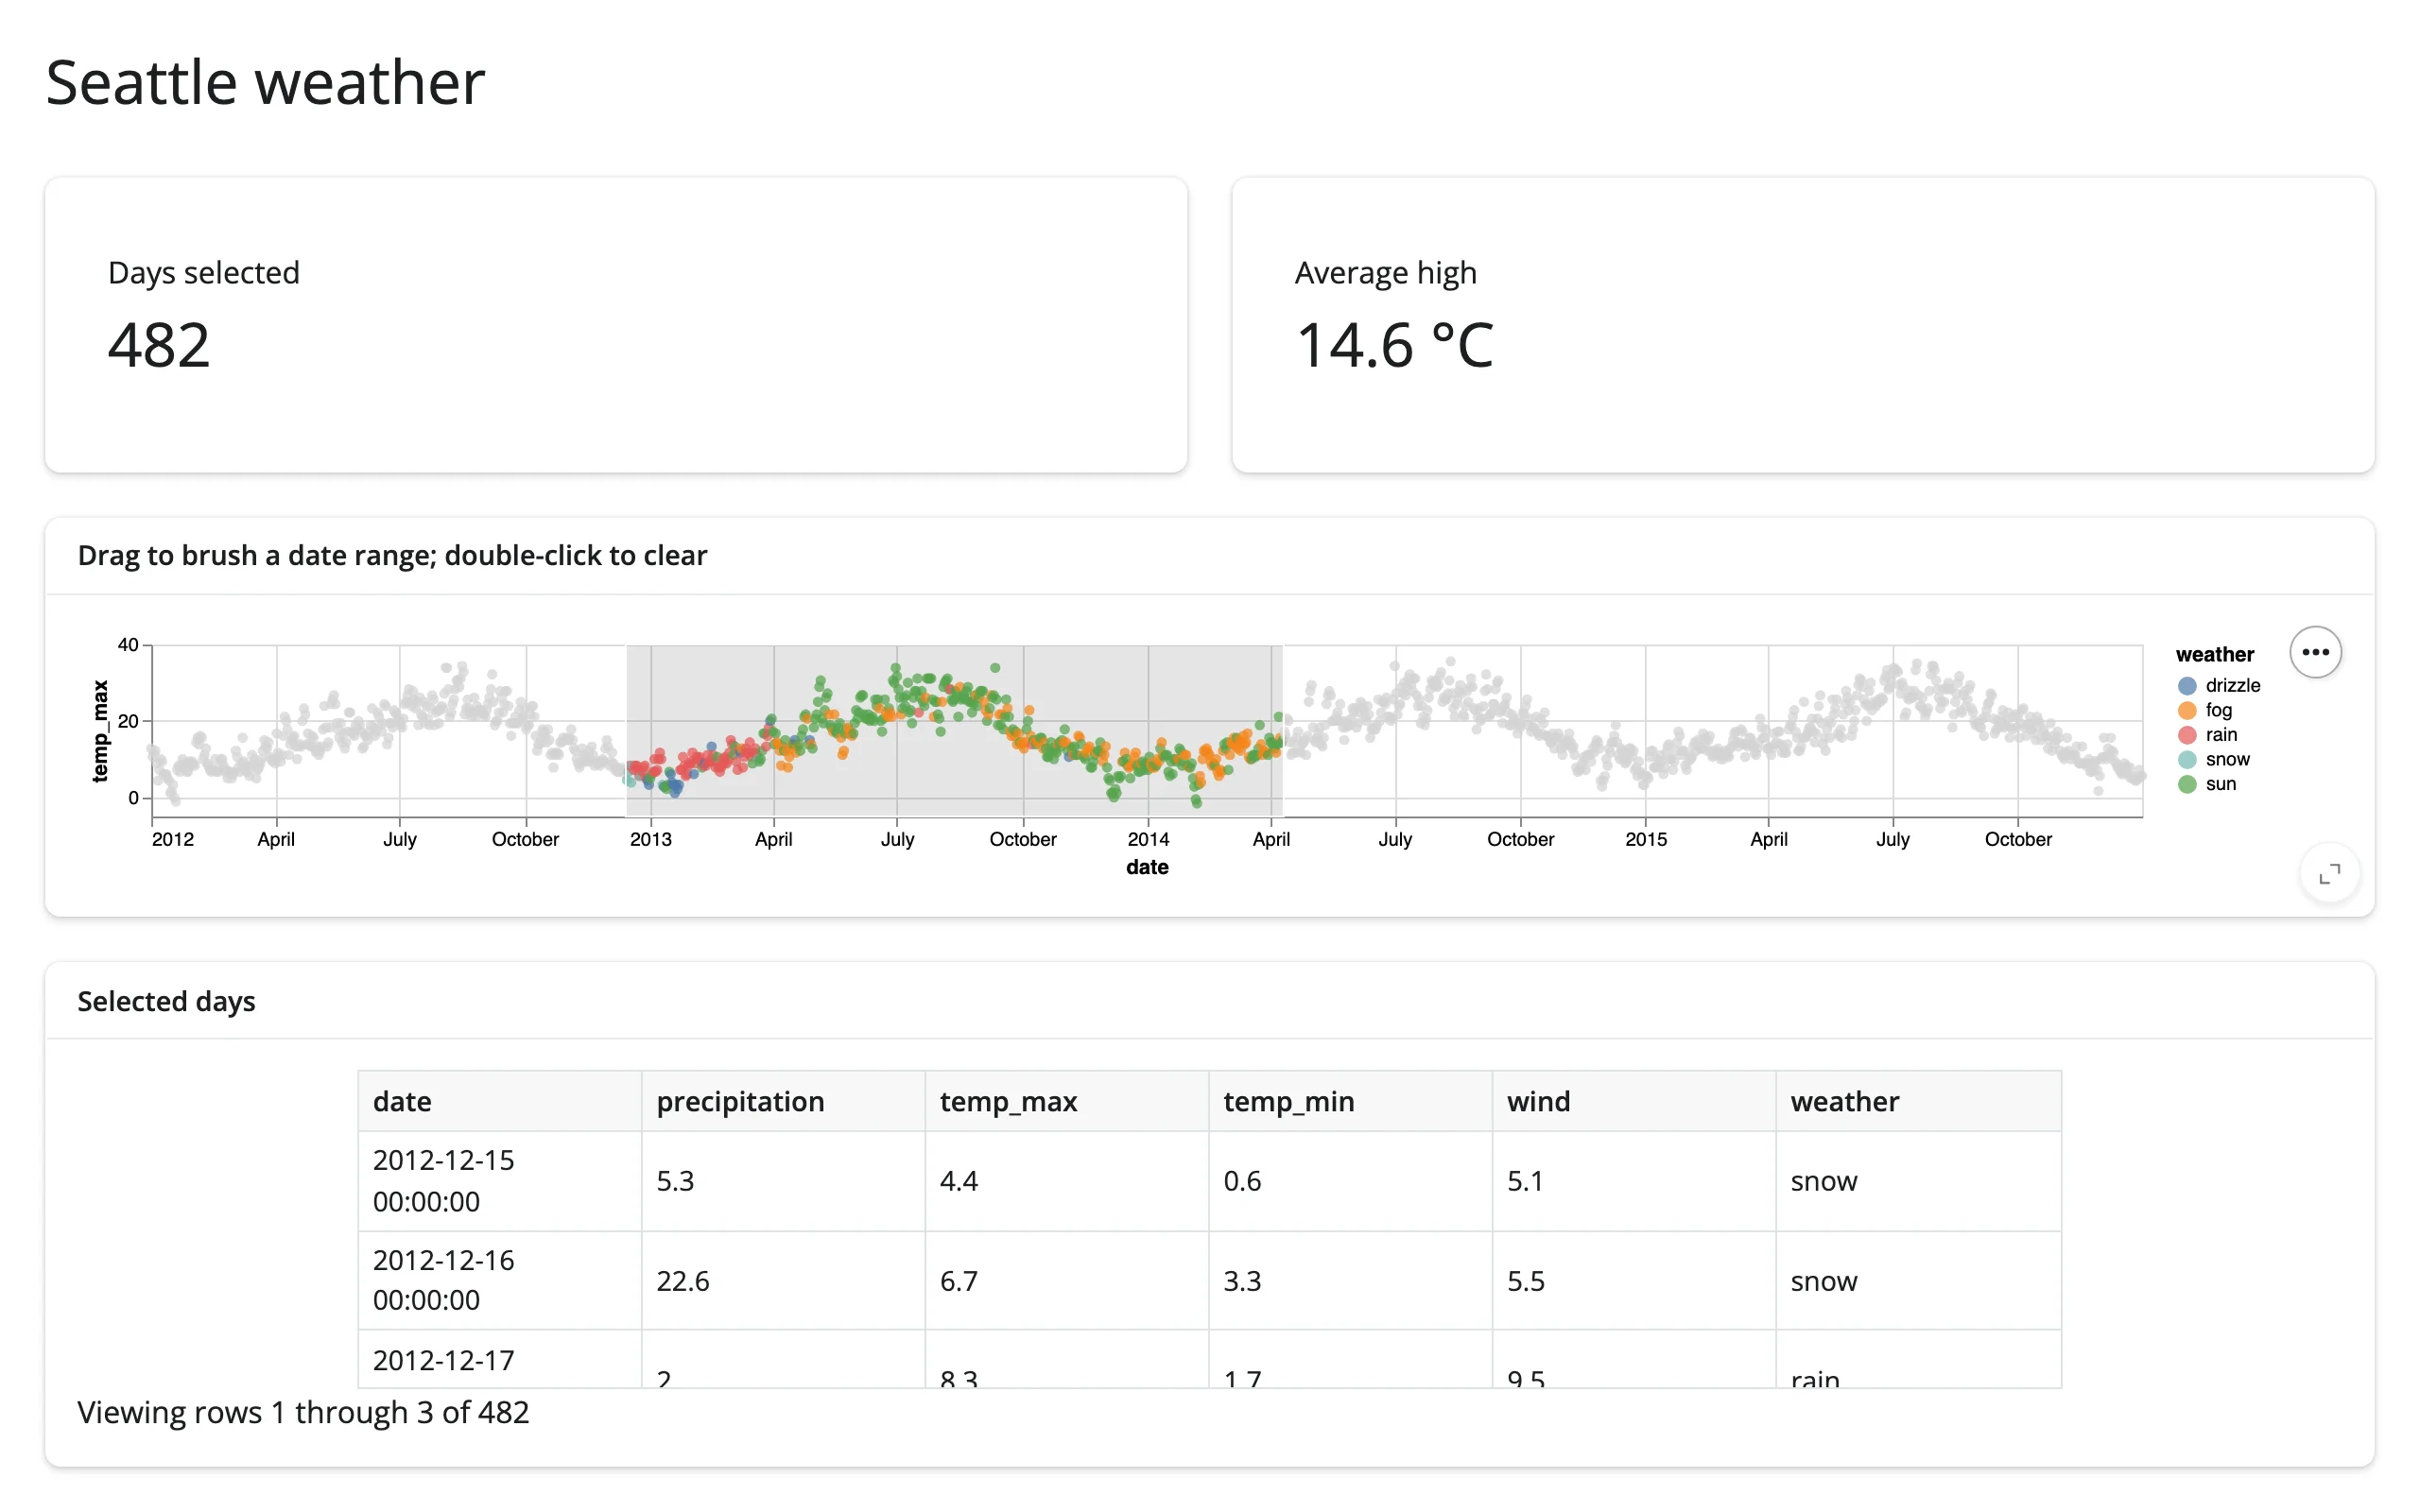
Template – gallery/template_weather_brush.py: four years of real Seattle weather (NOAA, via altair.datasets), brushable by date range, with two value boxes and a table computed from timeline.selected_rows(). About 55 lines; a reasonable starting point for any “brush a timeline, summarize the selection” dashboard.
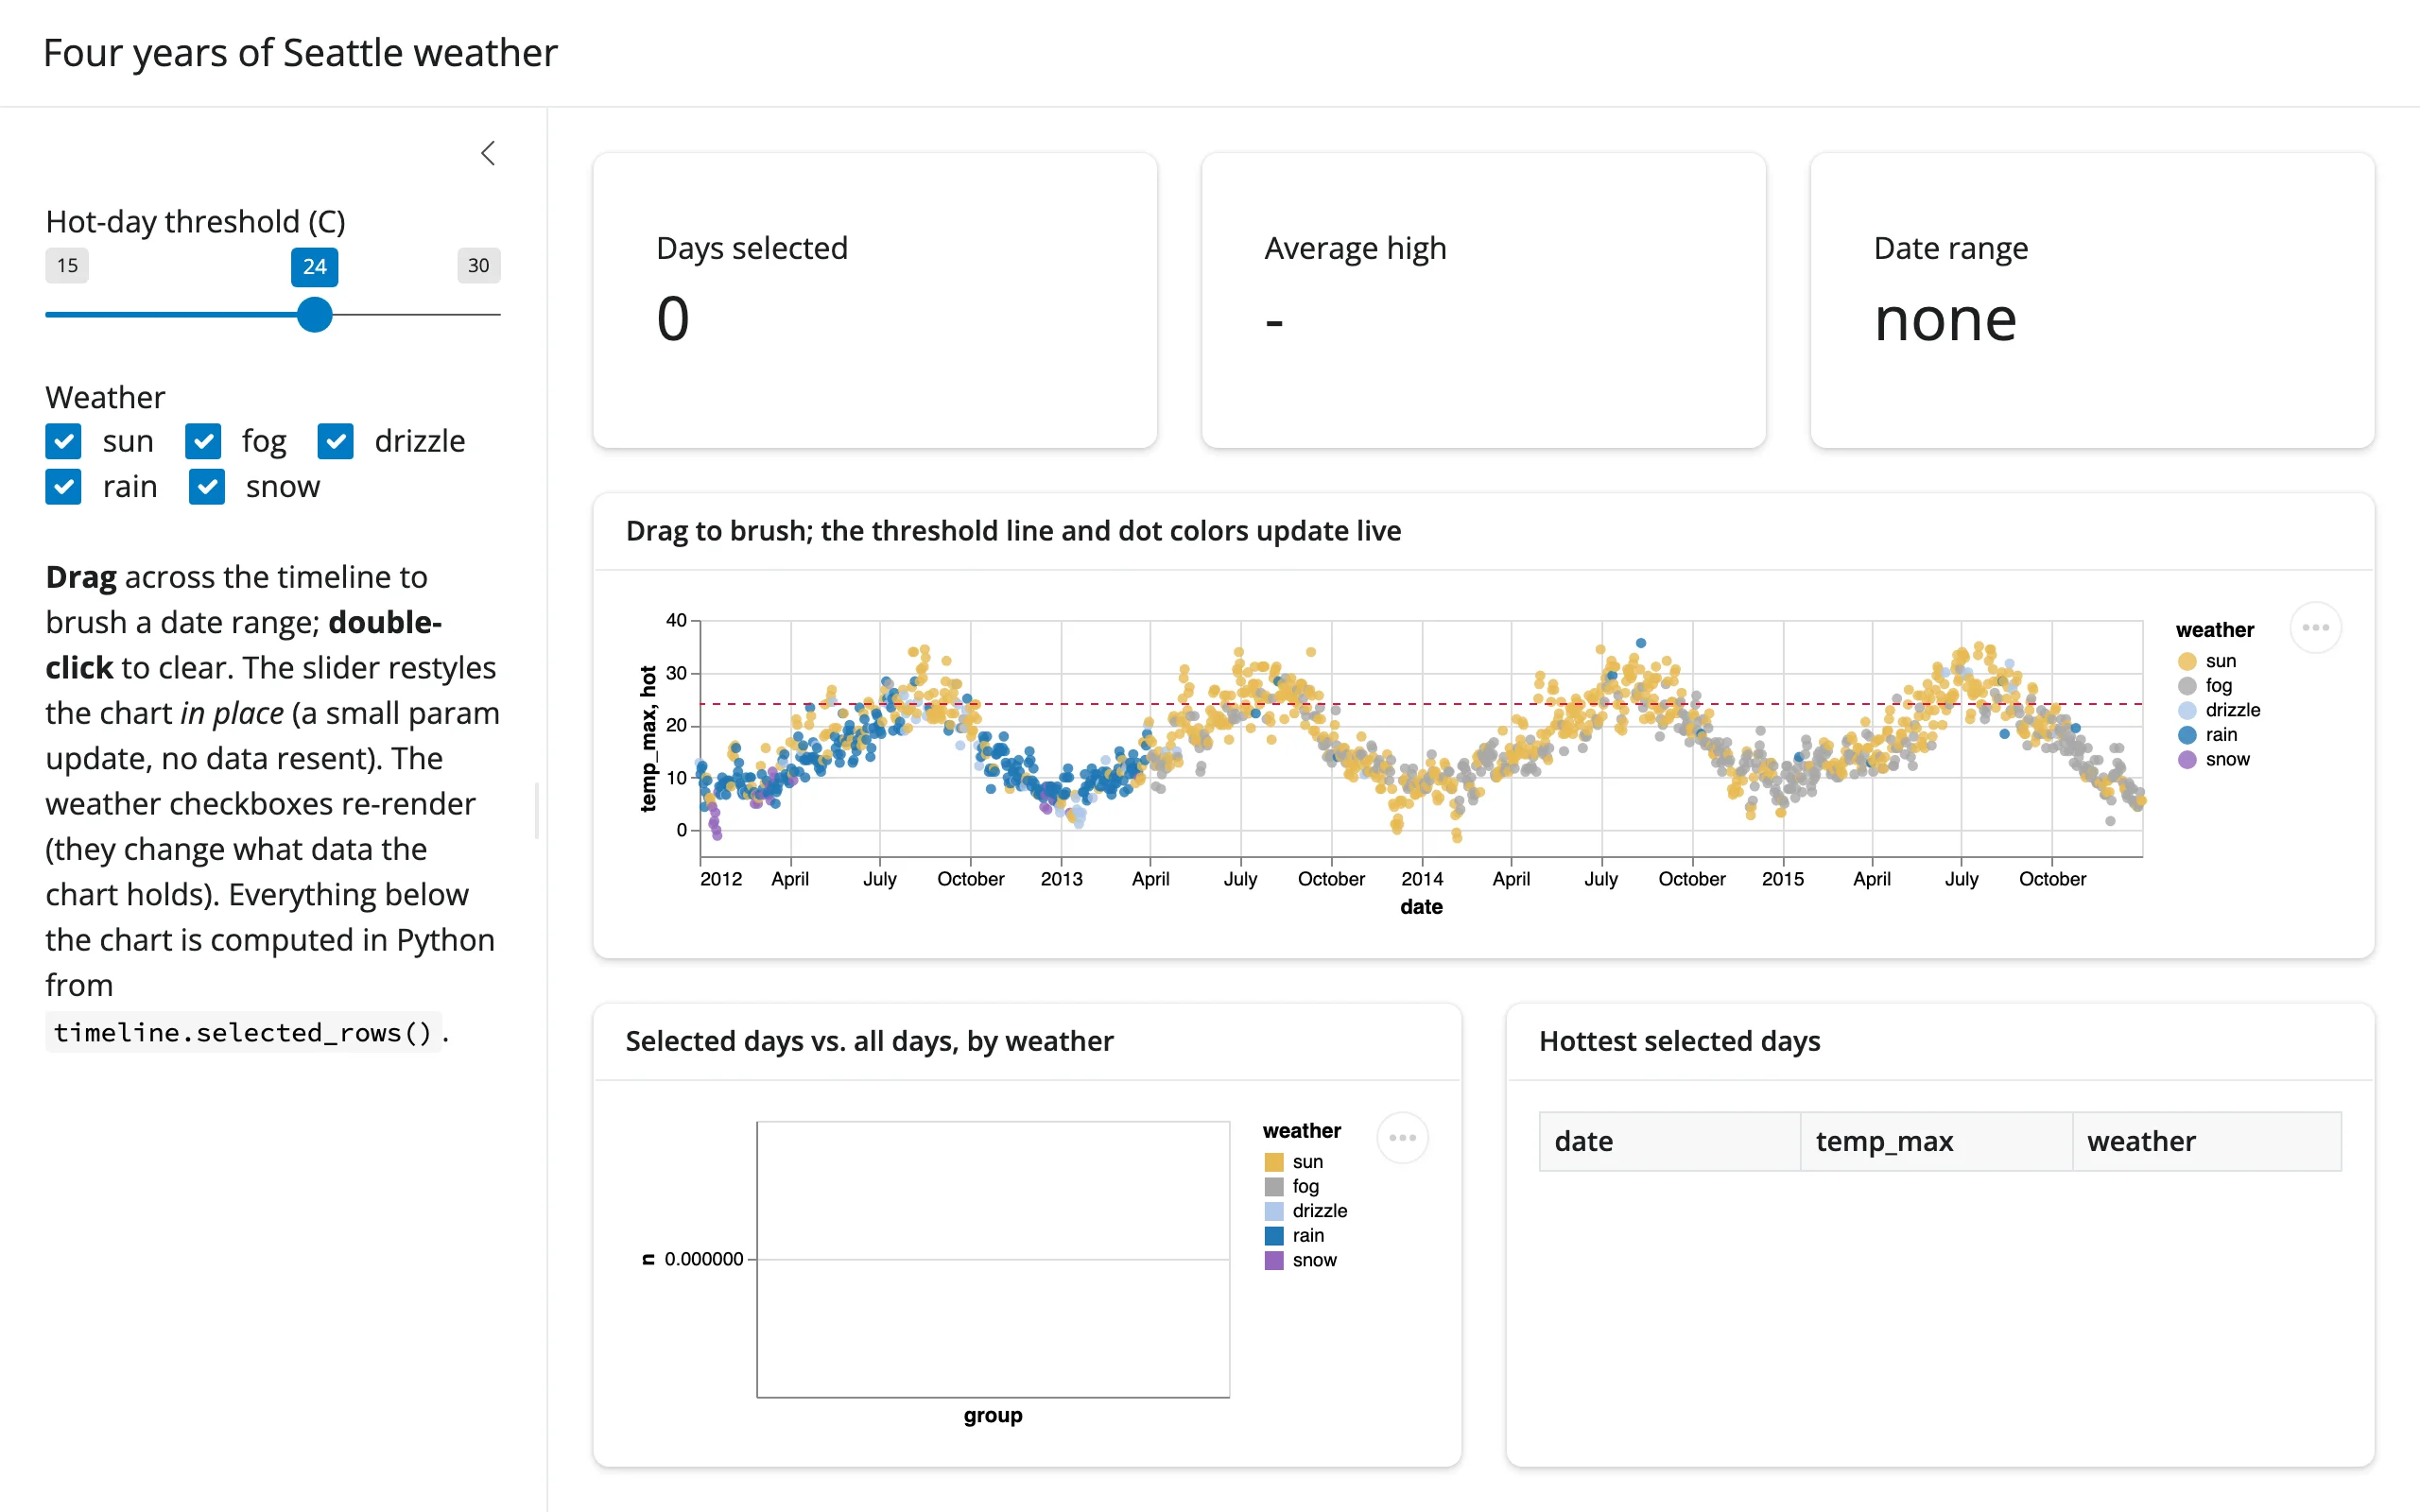
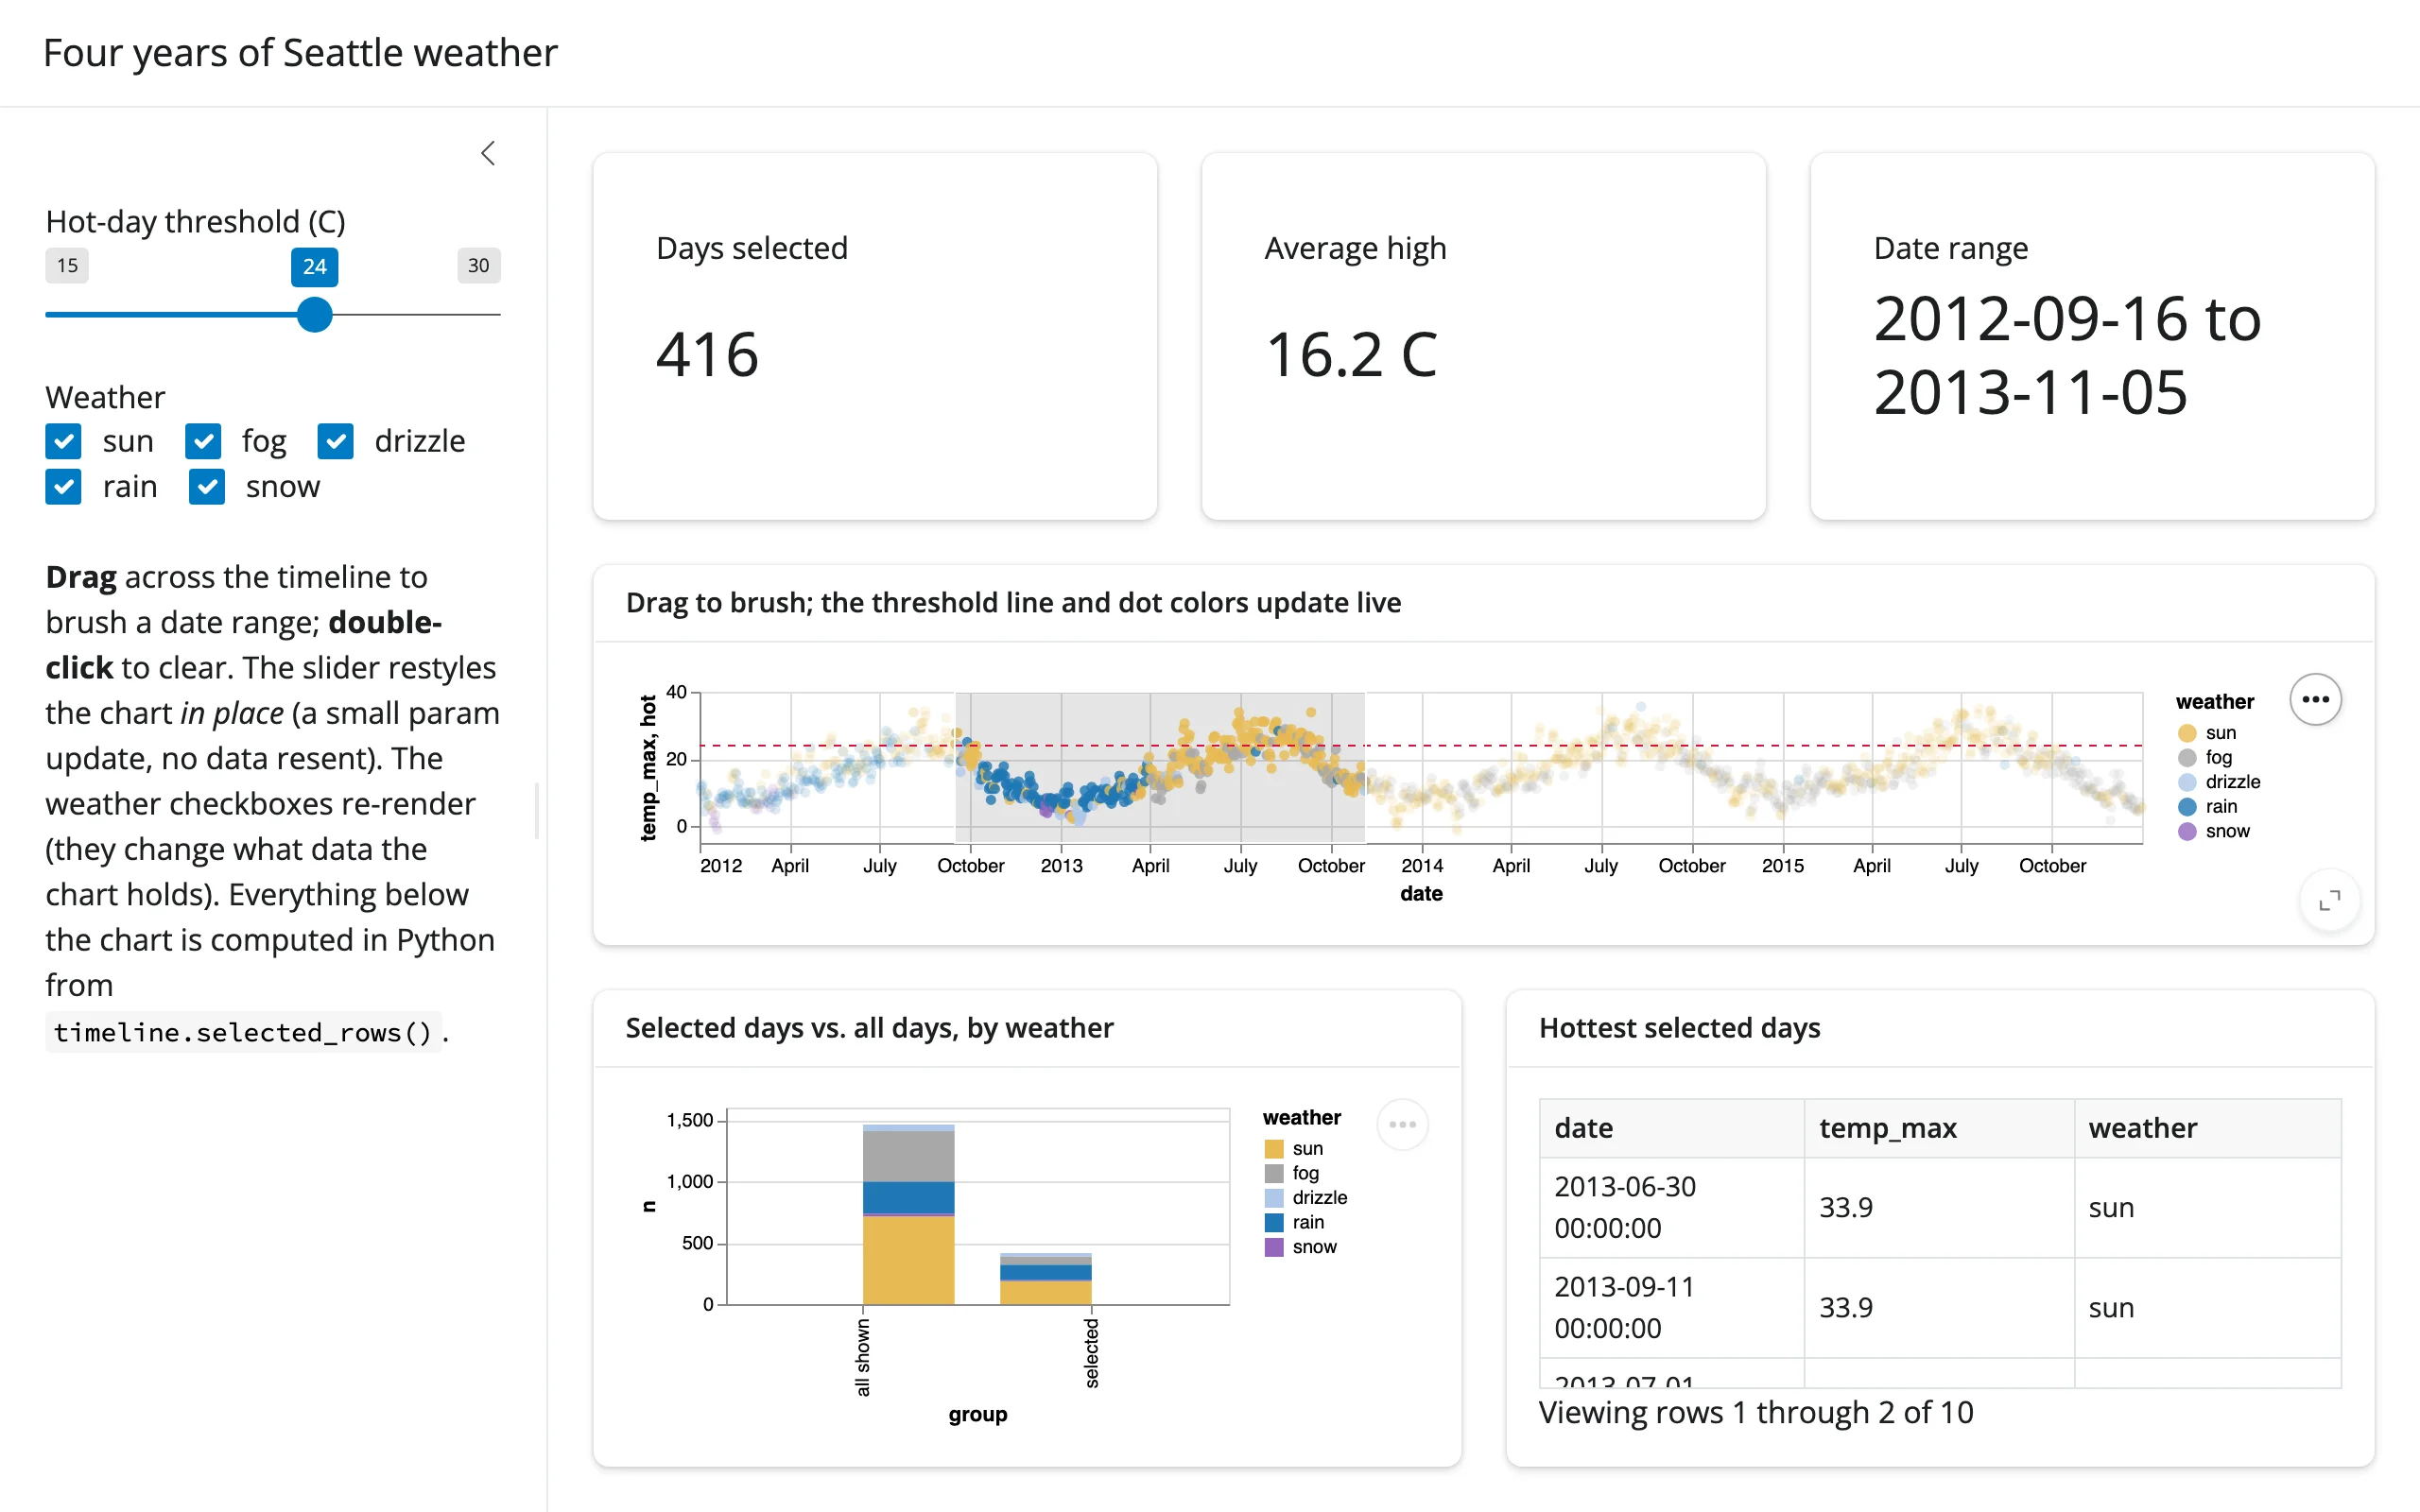
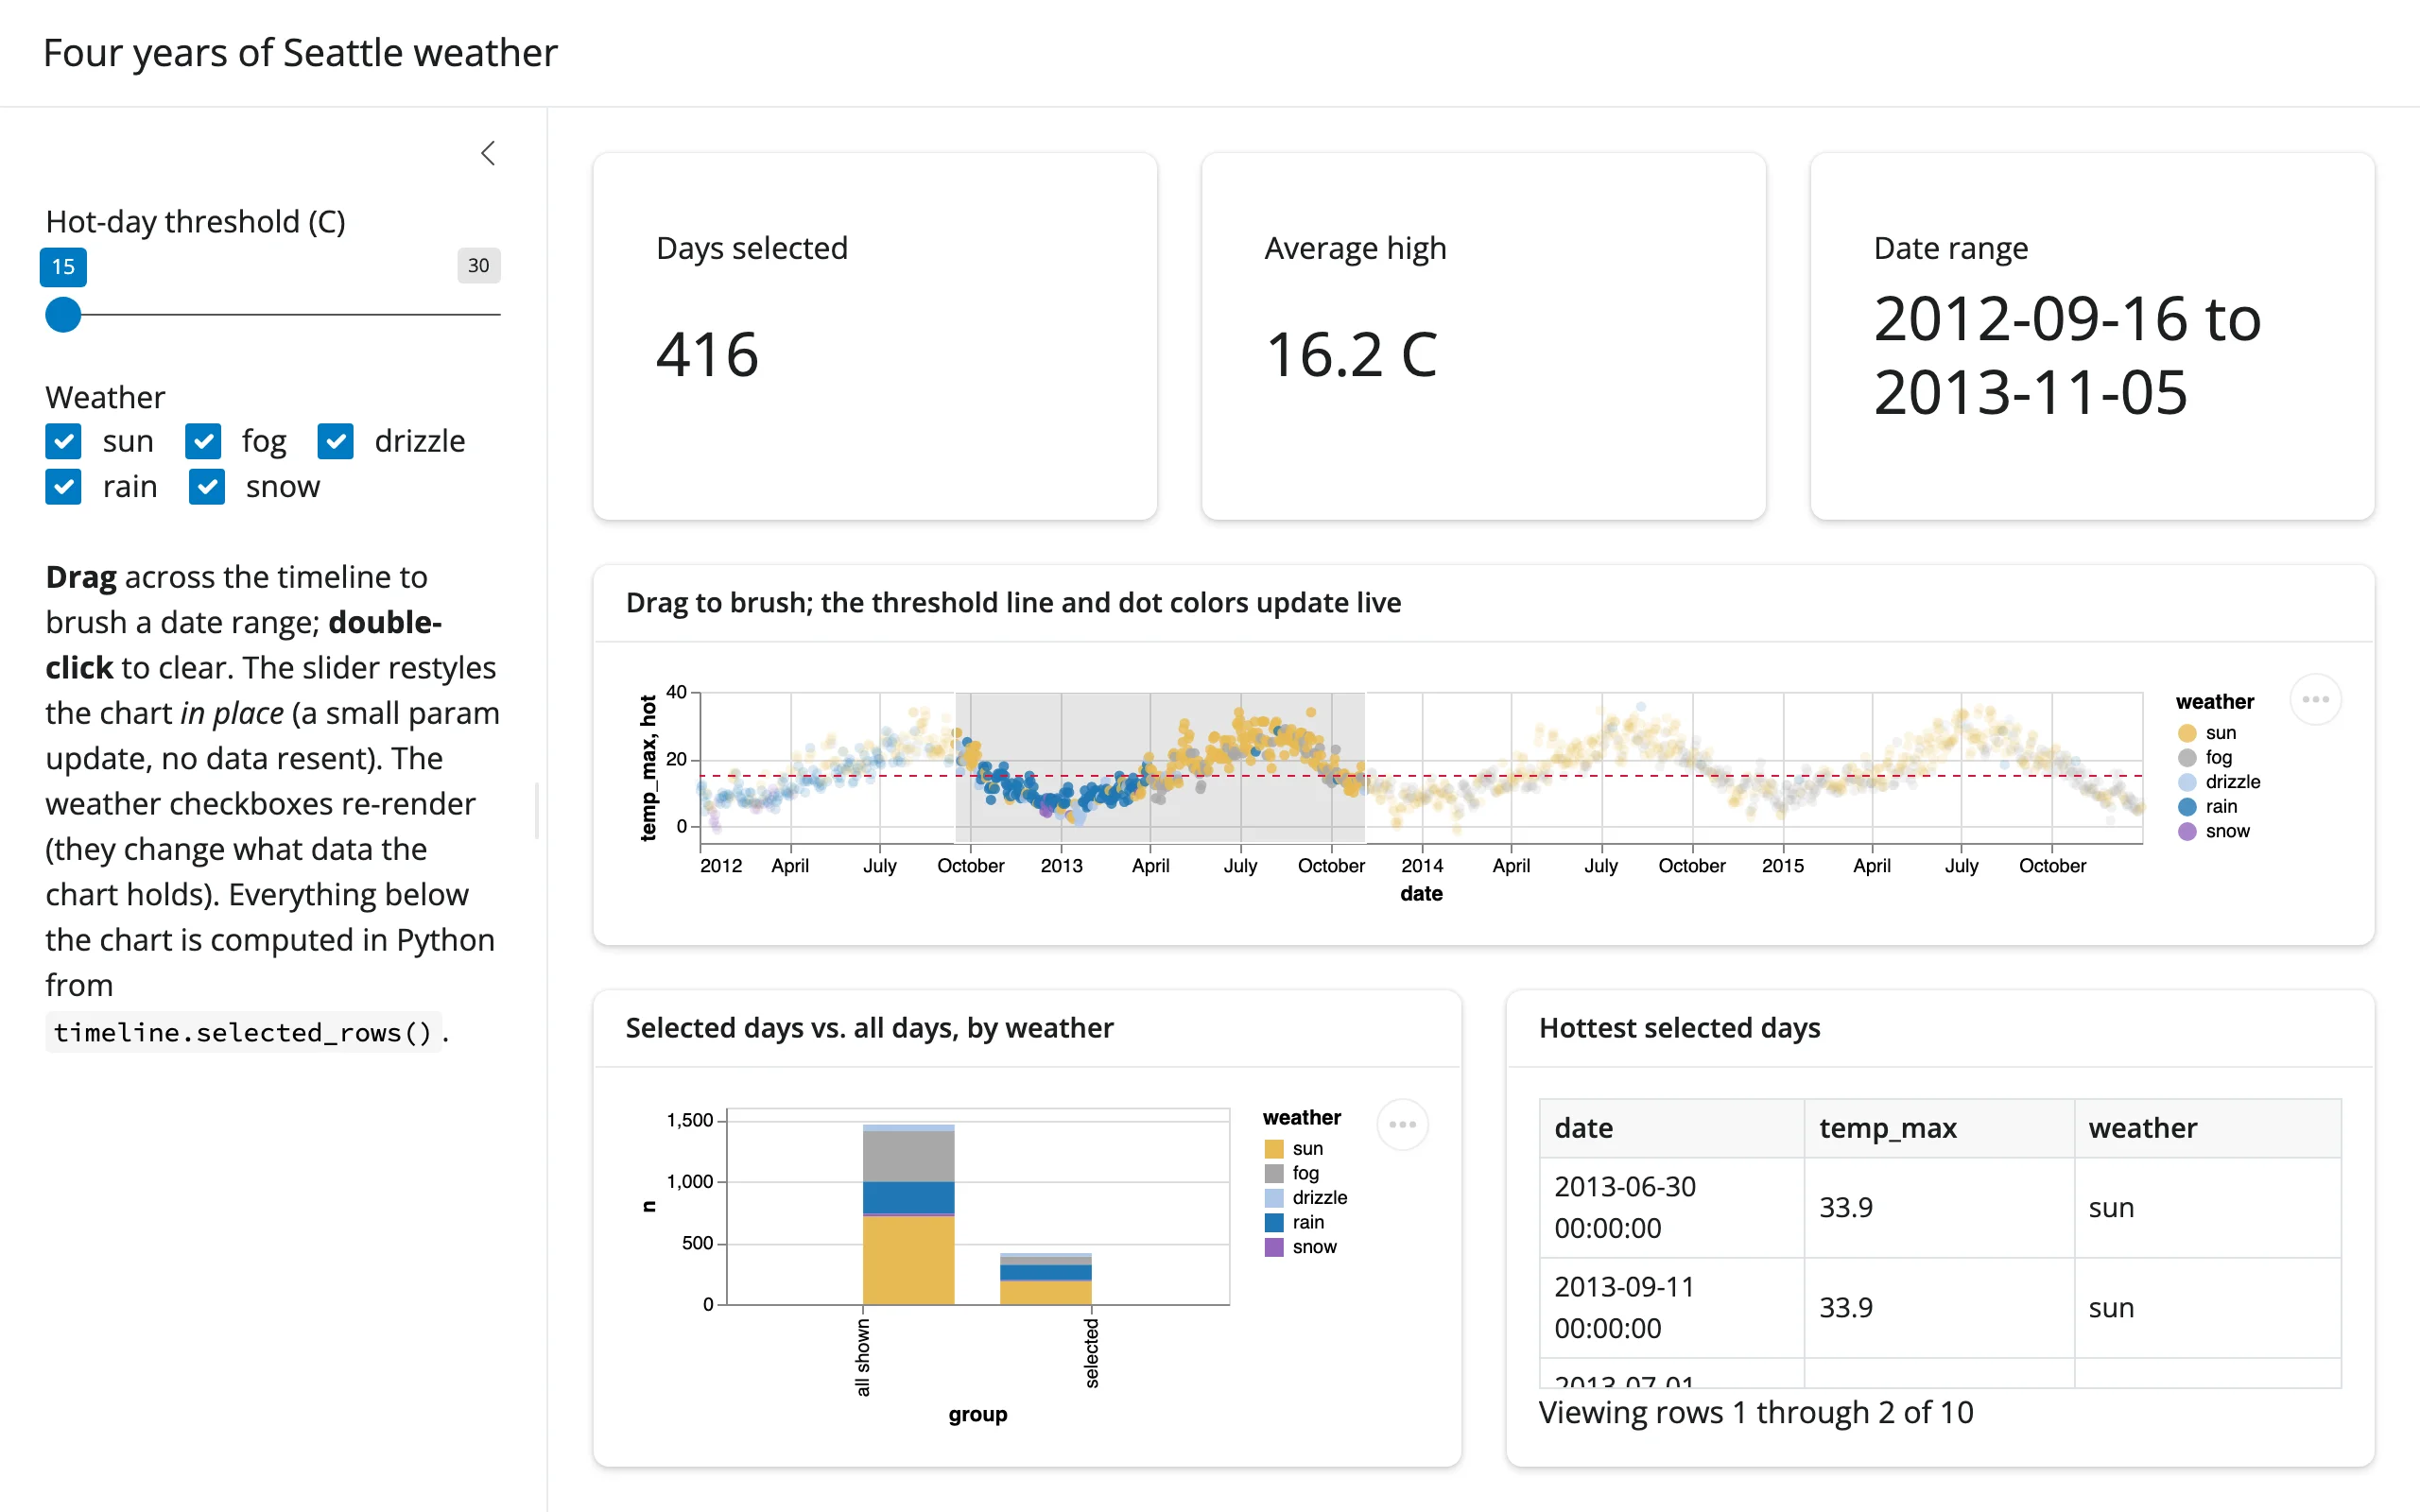
Showcase – gallery/showcase_weather_dashboard.py: the same four years of real Seattle weather, with more of the story told. A brushed date range drives three value boxes, a Python-computed comparison chart (selected days vs. all shown days, by weather type), and a “hottest selected days” table – all from timeline.selected_rows(). A sidebar slider restyles the chart’s hot-day threshold line in place via a param update (no data resent, selection preserved), while a weather-type checkbox group re-renders the chart (since it changes what data it holds). About 135 lines.
Before any interaction, after brushing a date range, and after moving the threshold slider (brush and selection are preserved; only the dashed line moves):
Learn more
- Altair documentation and its example gallery
- JupyterChart and selections
- Vega-Lite selection parameters (the grammar
selected()/selected_rows()read) - Related guides in this roster: plotly, bokeh, reactable