Plotly
Plotly is an open-source charting library (Plotly Technologies Inc.) built on plotly.js, with first-class support for scatter, line, bar, 3D, maps, and statistical charts through its high-level plotly.express API, plus a lower-level graph_objects API for full control. It’s the chart library most Shiny for Python users reach for first: it fills a layout well, exports cleanly, and ships a widget form (FigureWidget) that round-trips user interaction back to Python.
@render_plotly accepts a plotly.graph_objects.Figure (coerced to a FigureWidget), a FigureWidget you built yourself, or a Dash-style (figure, config) tuple. It applies layout defaults so the figure fills its card without plotly’s default 80px margins, and it installs a small event bridge (see “Reacting to user interaction” below) so clicks, hovers, selections, zooms, and legend toggles are available as accessors – ordinary methods you call from any reactive context, the same way you’d call input.my_slider(). Every accessor attaches the moment the figure renders and remembers the last thing the user did, so it’s safe to read from anywhere – a button handler, a download handler, a chat callback – even if nothing read it before.
Choose plotly when you want rich interactivity (click-to-detail, lasso-to-filter, zoom-to-explore) and don’t need a declarative grammar-of-graphics selection model (that’s altair), a bigger-than-browser point budget (that’s jscatter or embedding-atlas), or geographic projections (see the maps roster, e.g. lonboard). For static charts with no interactivity, plotnine or matplotlib are lighter-weight.
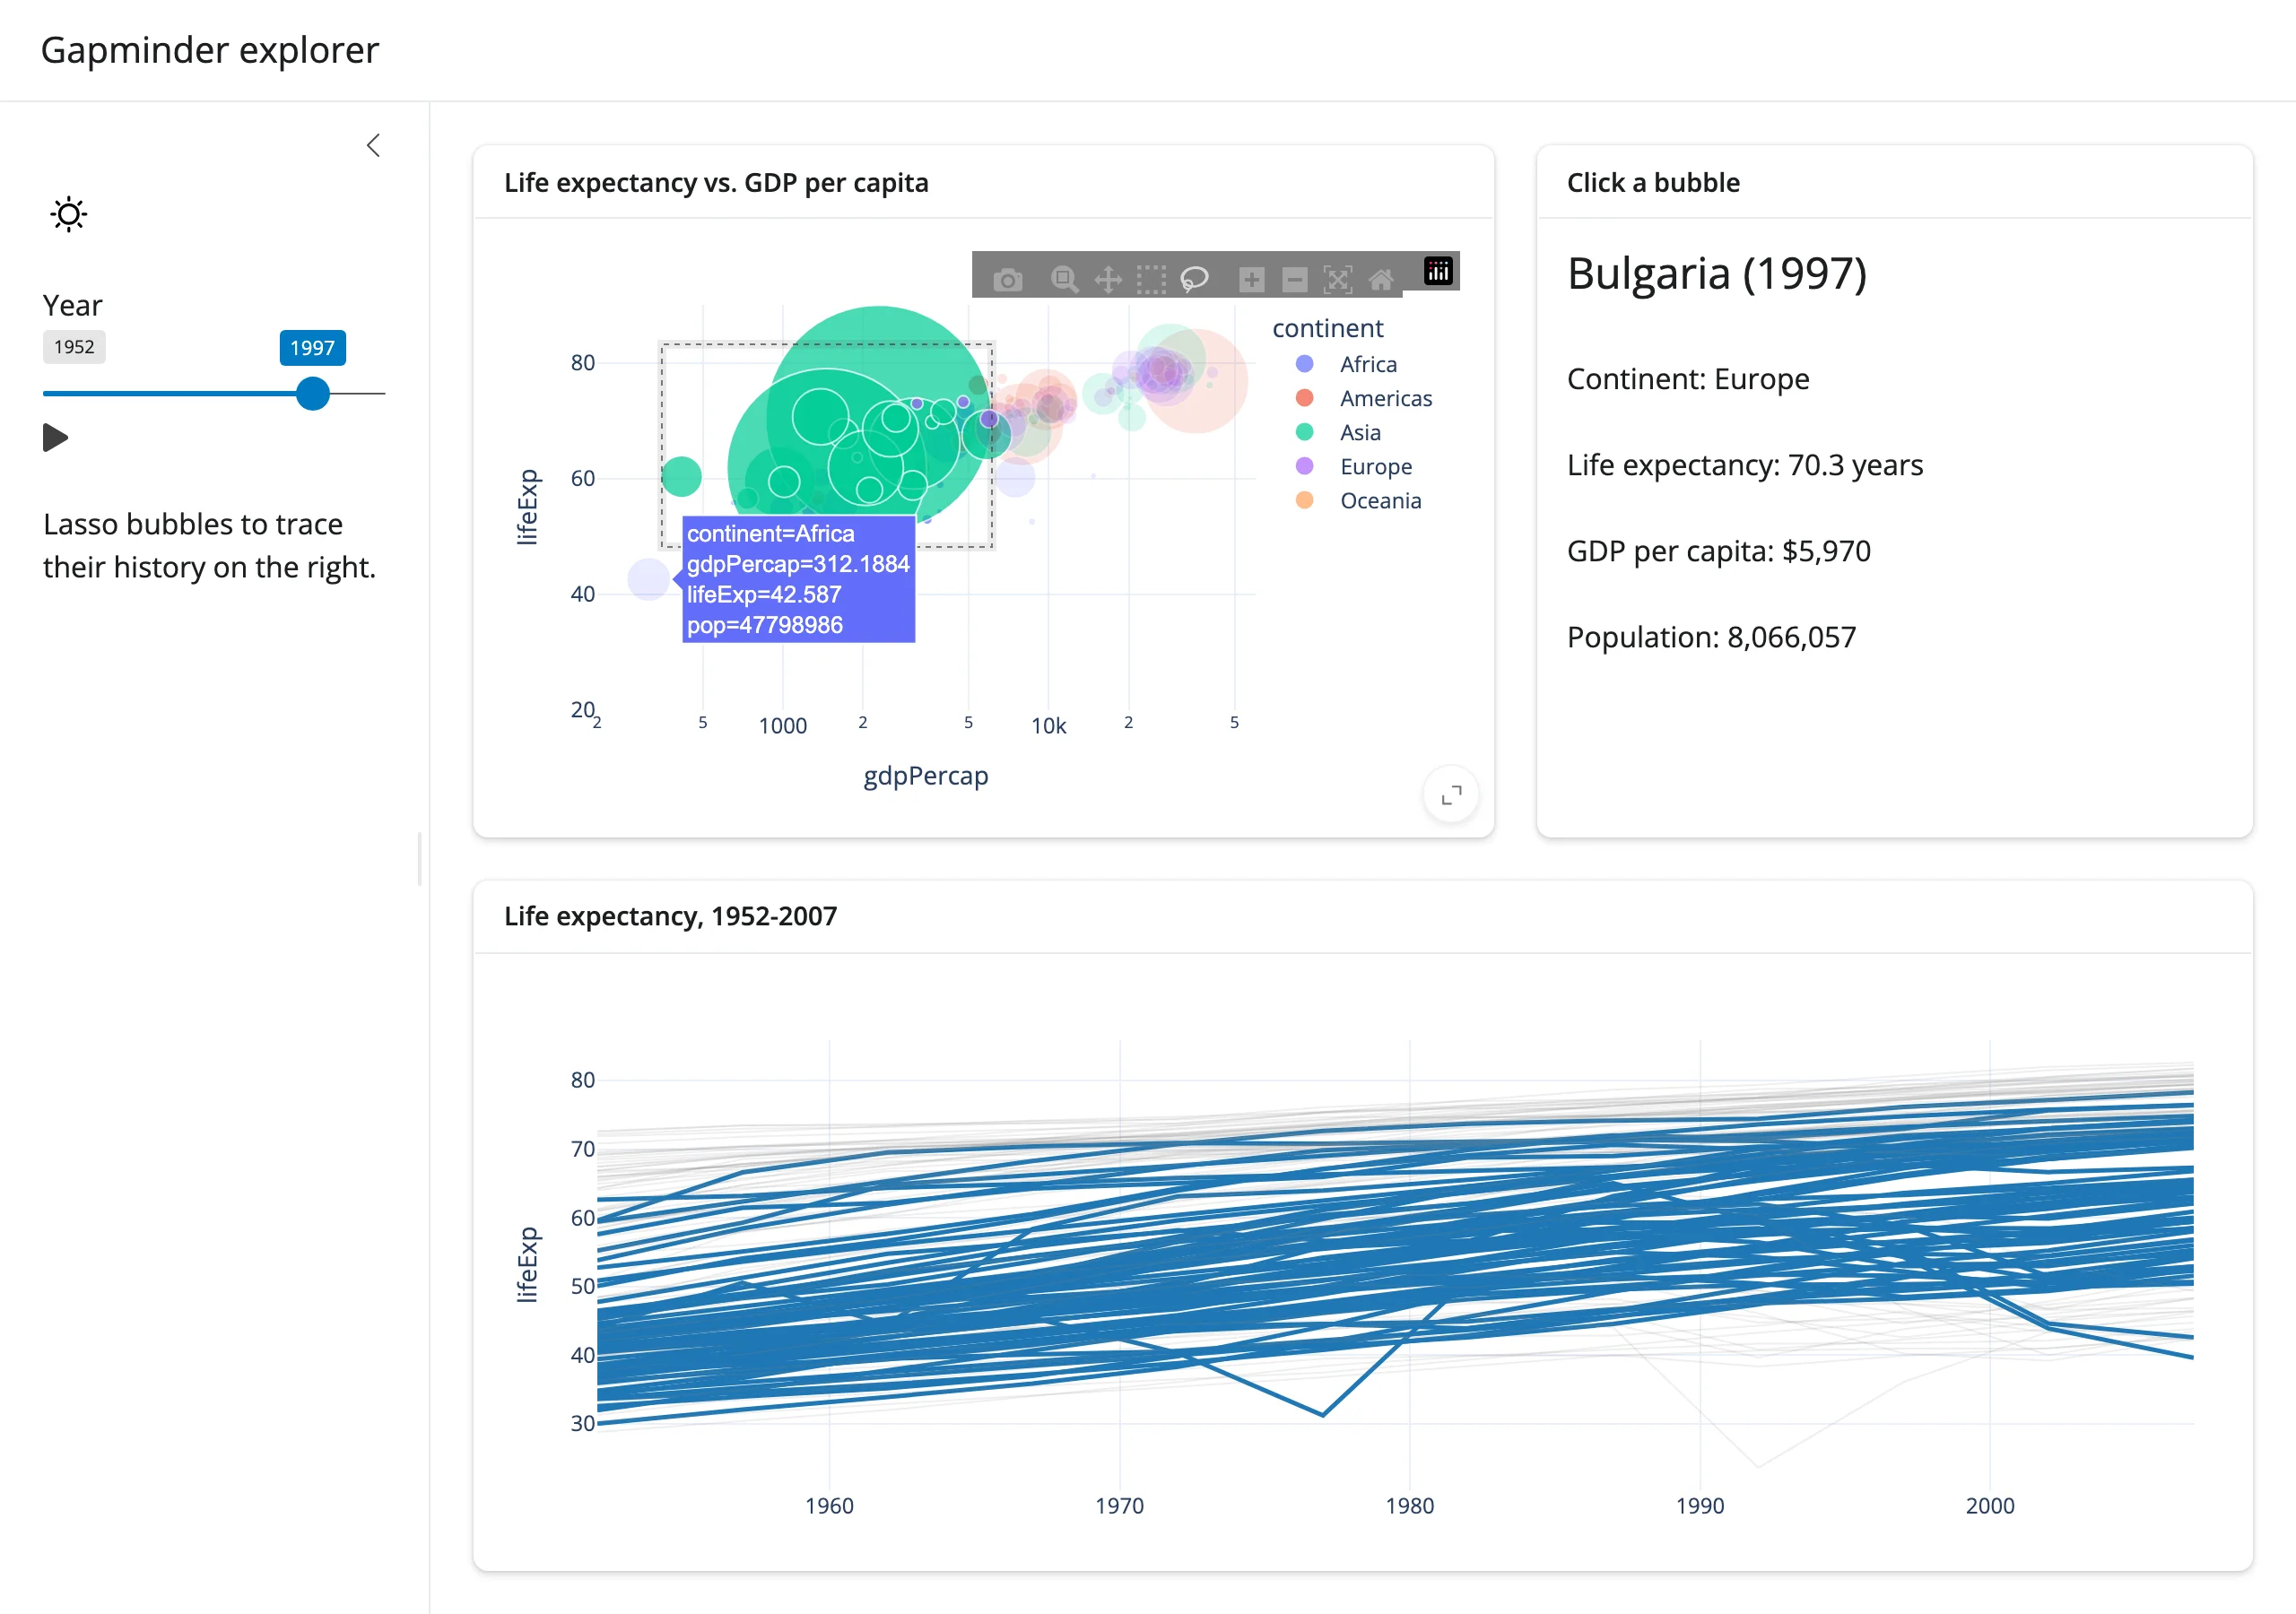
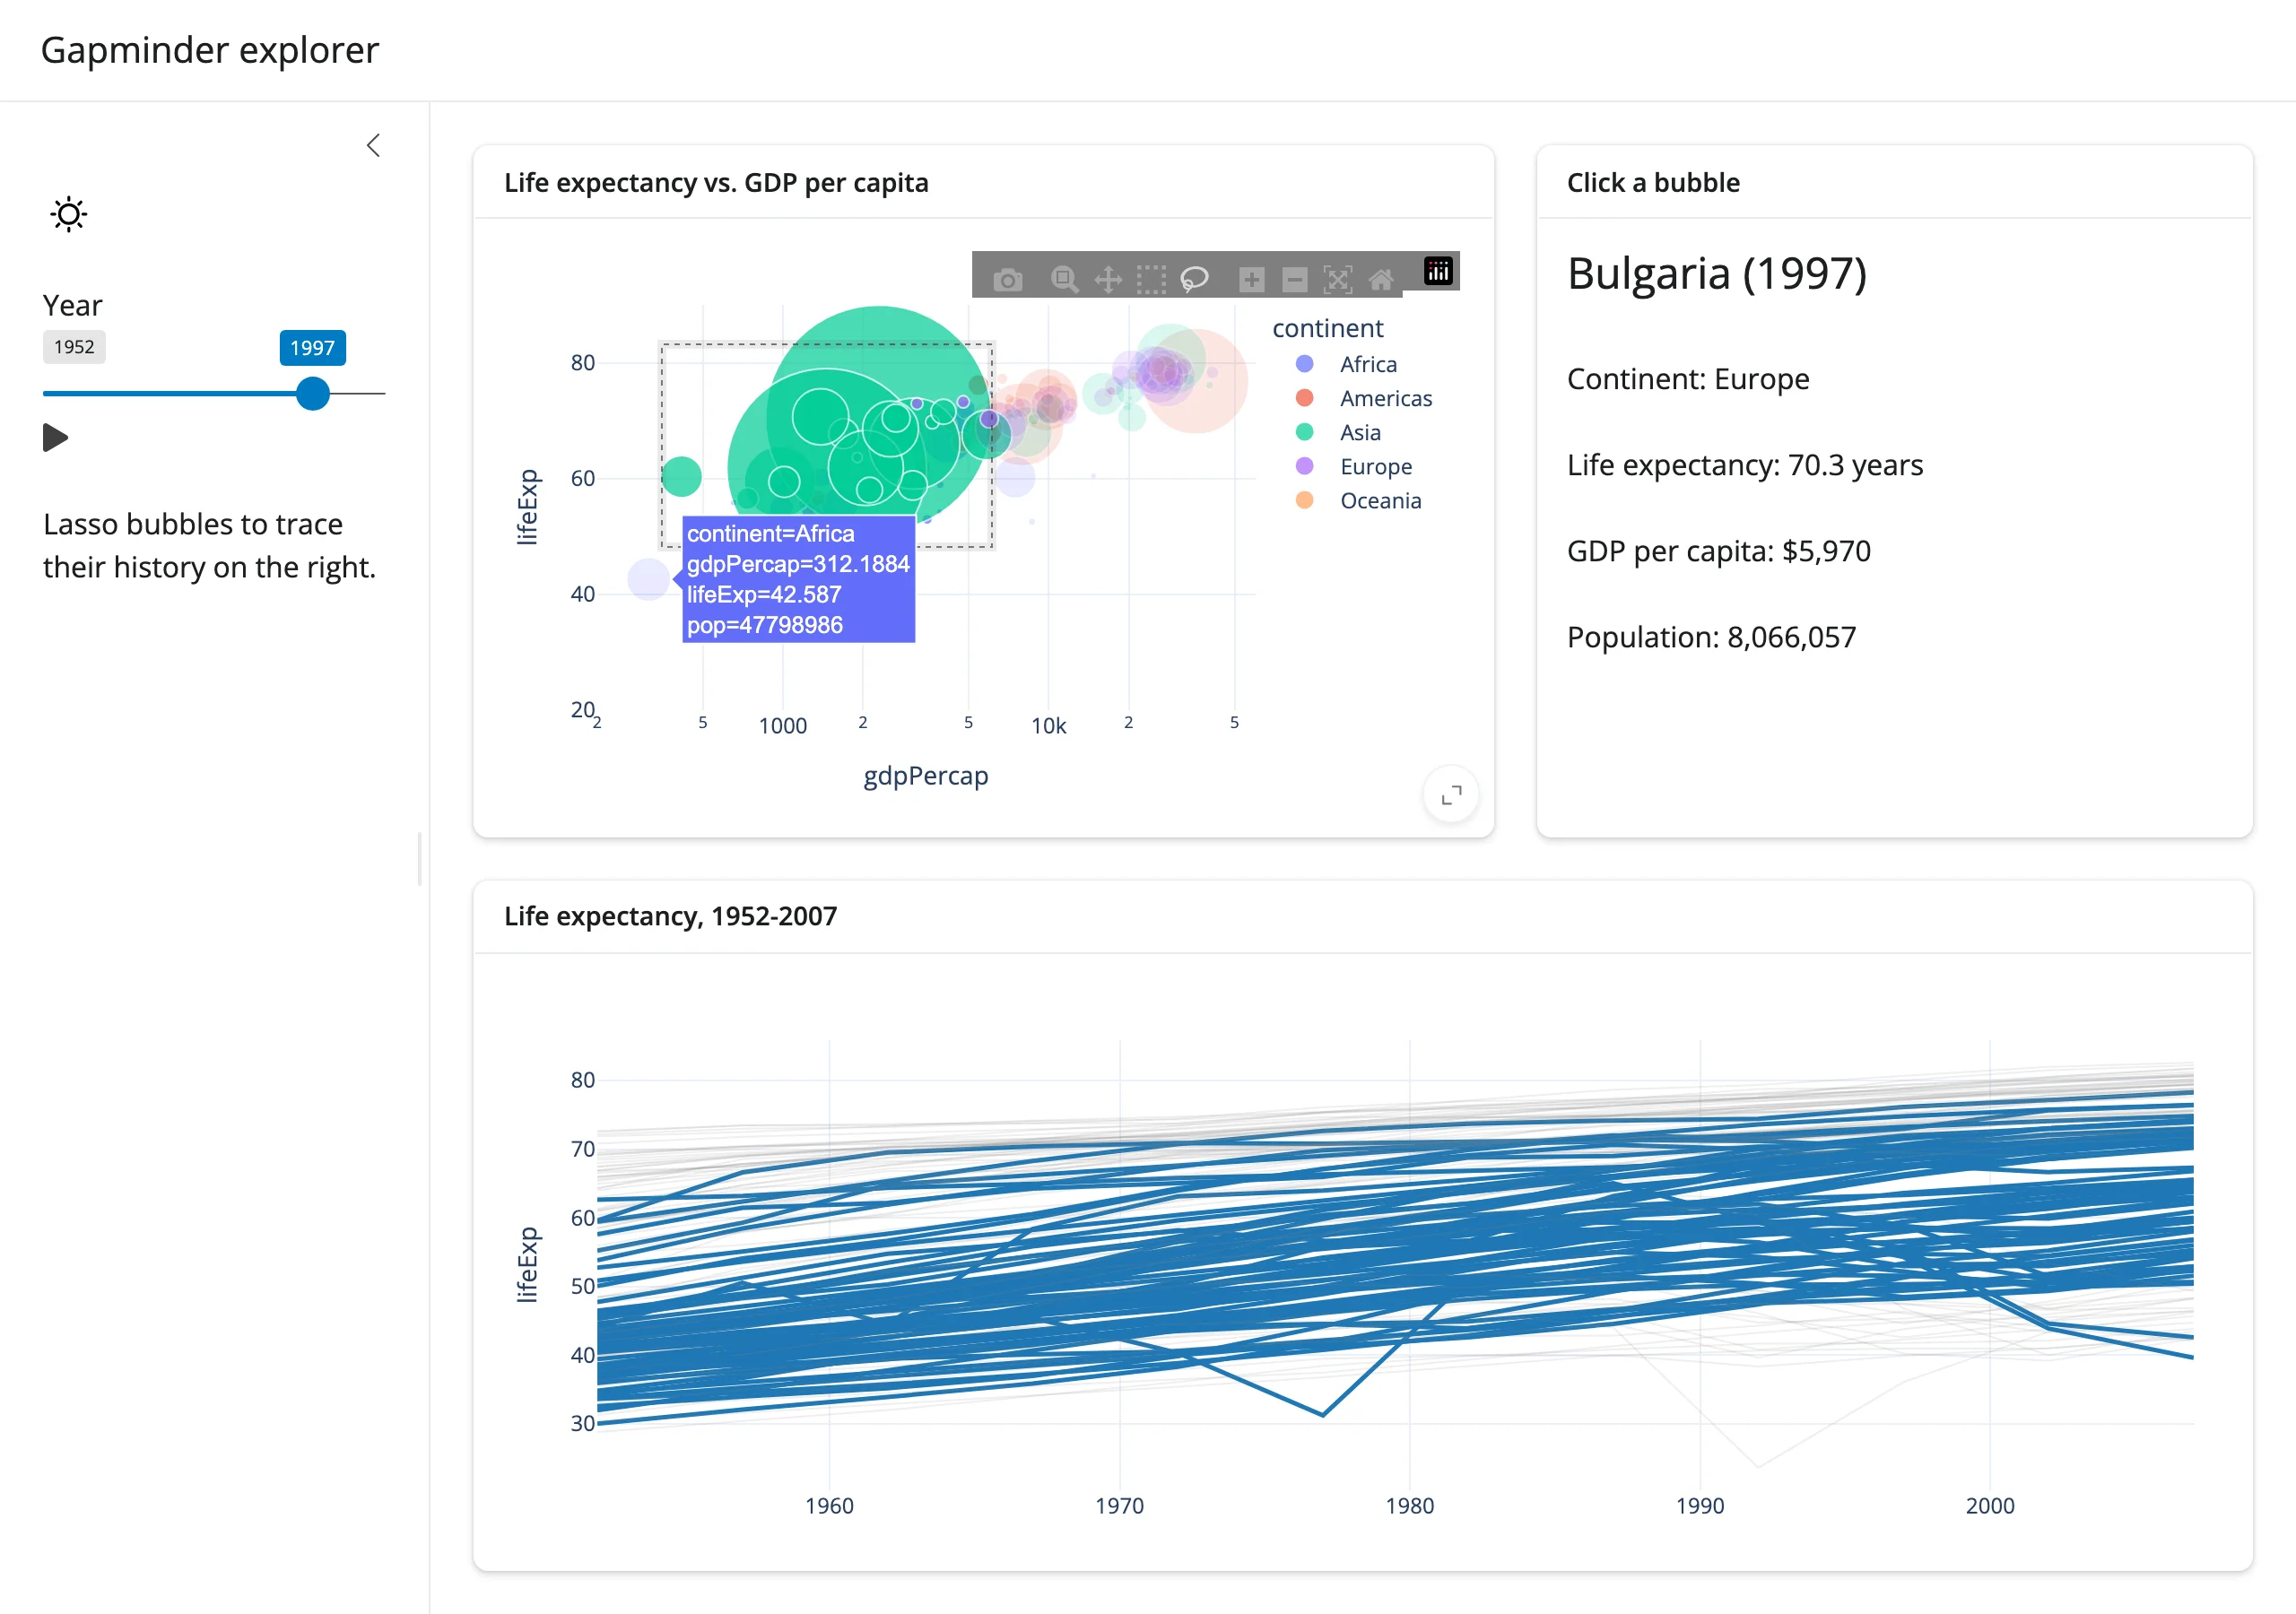
A lasso selection on the left highlights 26 countries’ full history on the right – the bubbles moved there by batch_animate(), not a re-render. From gallery/showcase_gapminder_explorer.py.
Installation
pip install 'shinywidgets[plotly]'This installs plotly and pandas (the accessors’ points frames are pandas) along with narwhals, which selected_rows() uses to support polars data frames too.
Quick start
import plotly.express as px
from shiny.express import ui
from shinywidgets import render_plotly

df = px.data.iris()

ui.page_opts(title="Iris", fillable=True)


@render_plotly
def plot():
    return px.scatter(
        df, x="sepal_width", y="sepal_length", color="species", title="Iris"
    )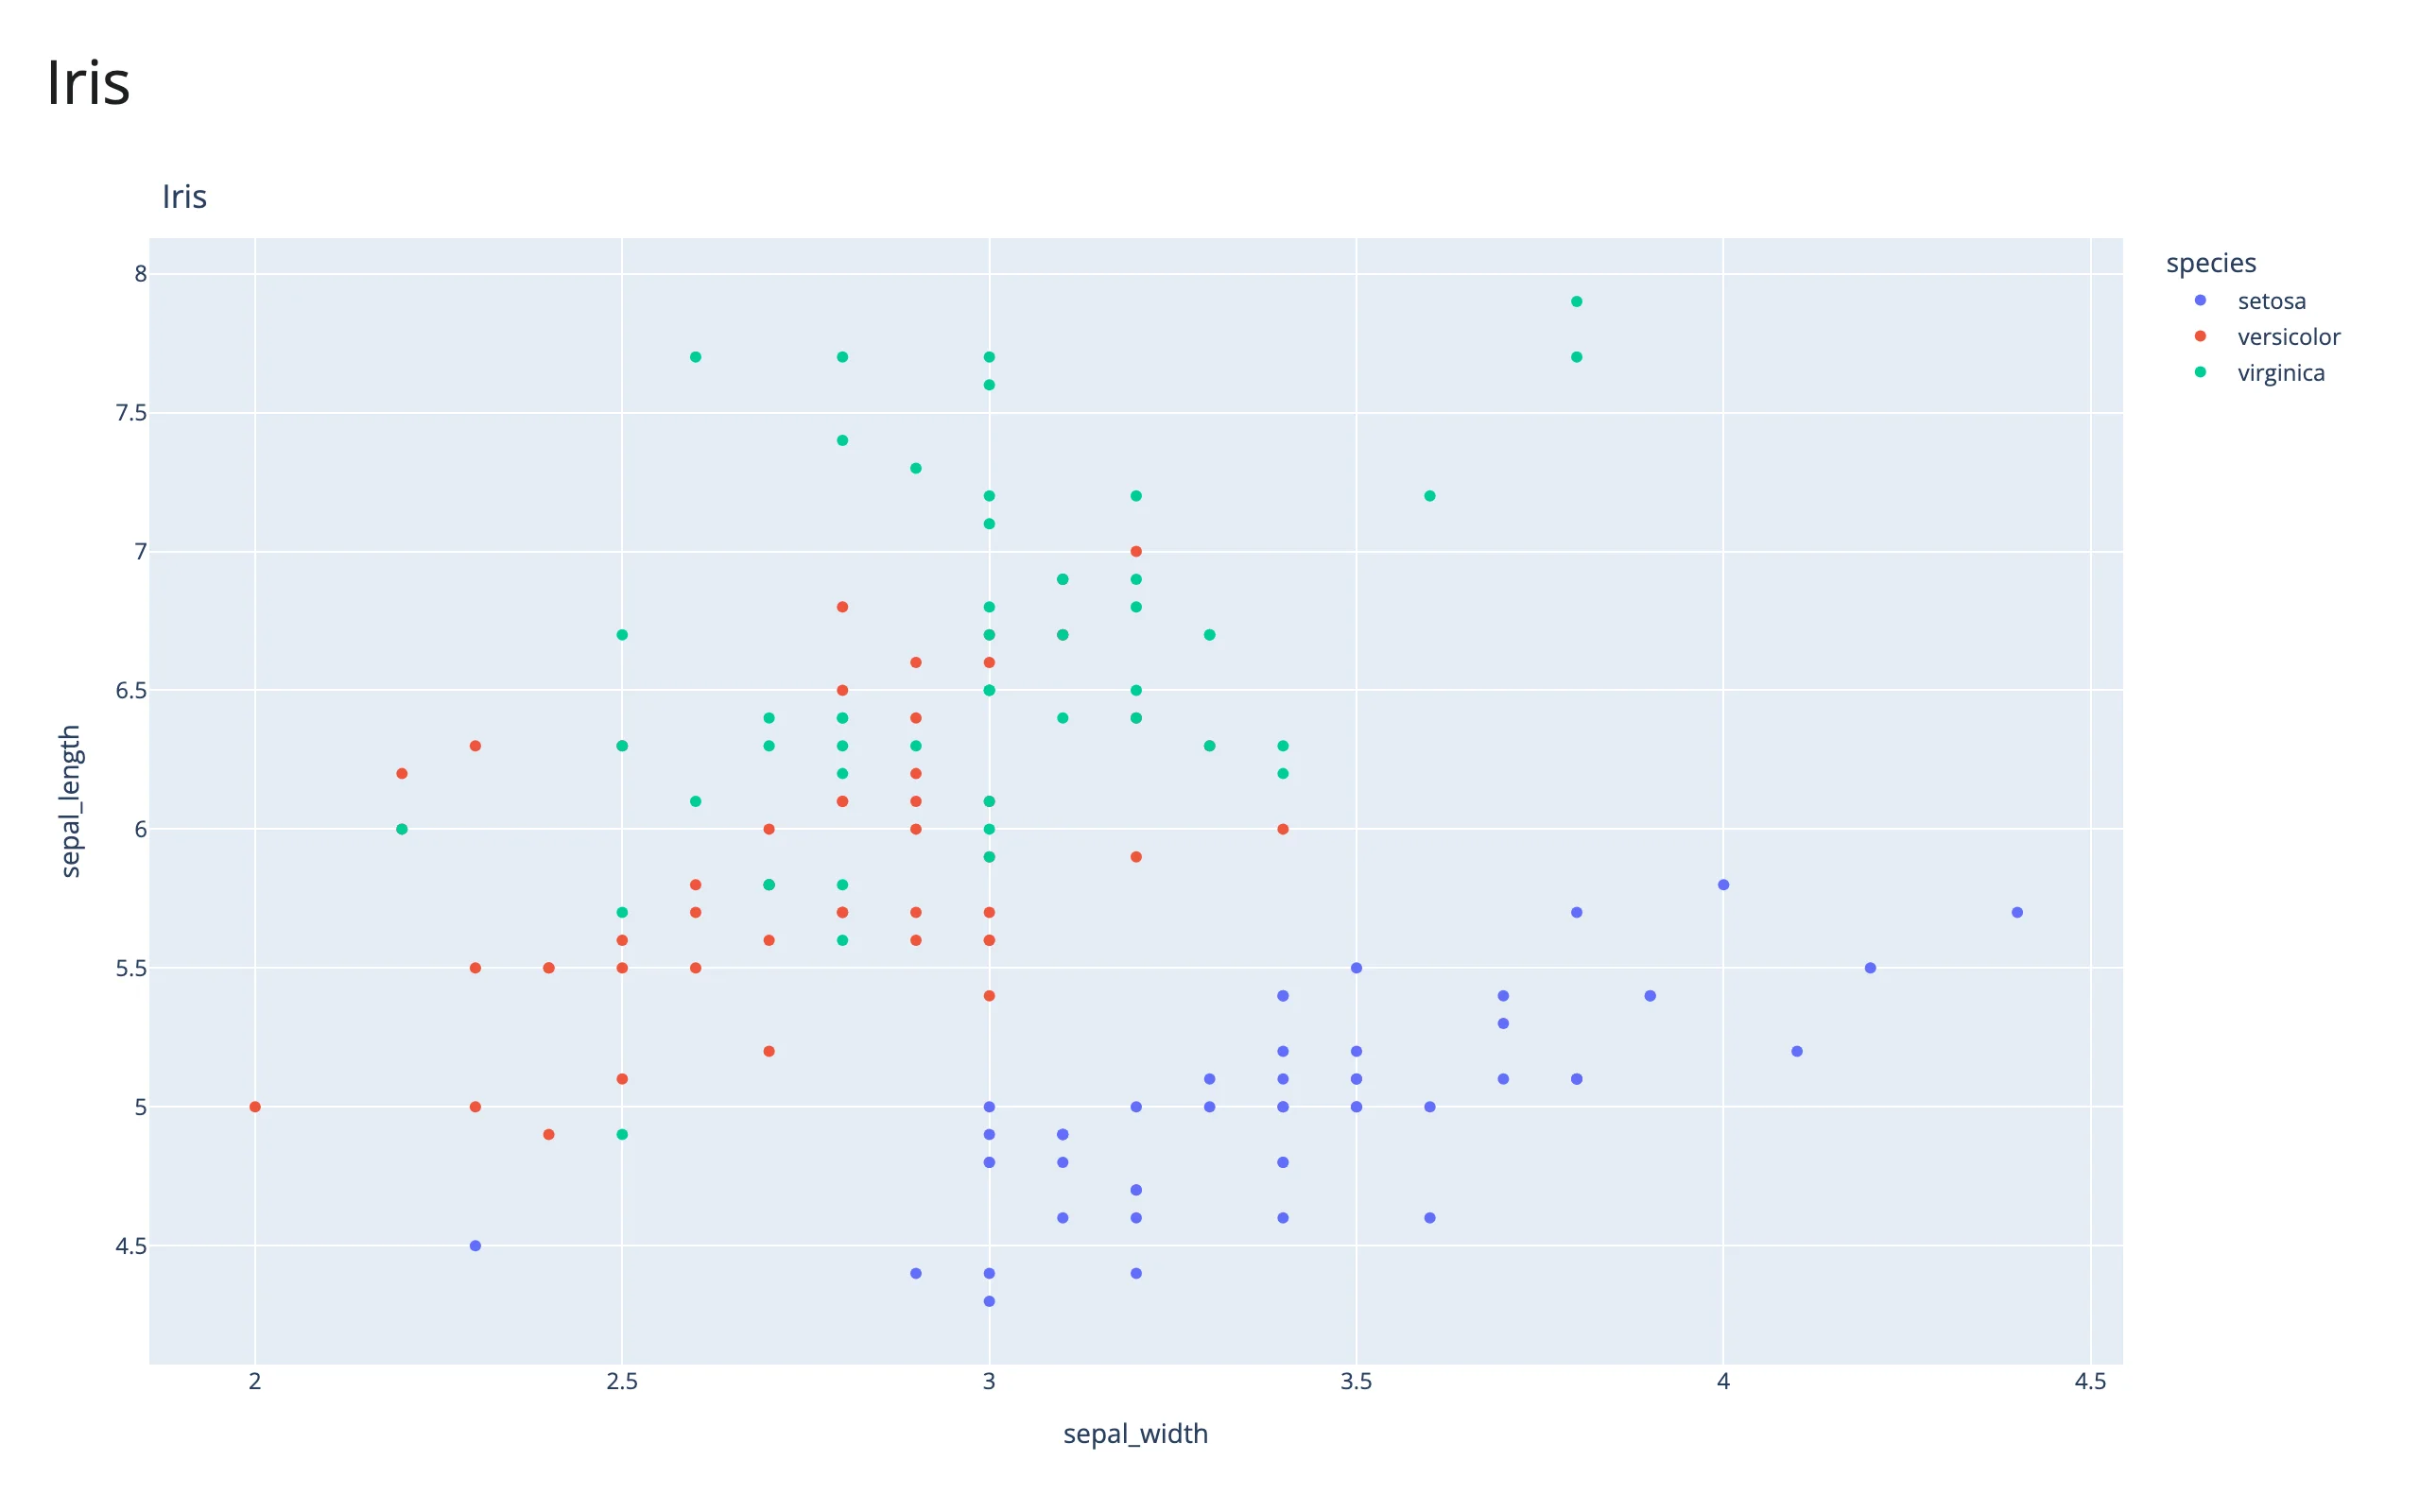
Returning a plotly.express figure (a go.Figure) is enough – @render_plotly coerces it to a FigureWidget for you. The figure fills its output; no layout.height or output_widget(height=...) needed.
What you can build
Plotly’s high-level plotly.express (px) builds whole figures – including subplots, facets, trendlines, and 3D – in one call from a tidy data frame; graph_objects (go) builds or edits a figure trace by trace. Both produce the same Figure/FigureWidget objects, so you can mix them (e.g., px.scatter(...) then fig.add_scatter(...)).
Small multiples from one line. facet_col/facet_row split a figure by a column, each panel still a first-class plot (here with a per-panel OLS trendline):
import plotly.express as px
from shiny.express import ui
from shinywidgets import render_plotly

df = px.data.tips()

ui.page_opts(title="Tips by day", fillable=True)


@render_plotly
def facets():
    fig = px.scatter(
        df,
        x="total_bill",
        y="tip",
        color="sex",
        facet_col="day",
        trendline="ols",
    )
    fig.update_layout(showlegend=False)
    return fig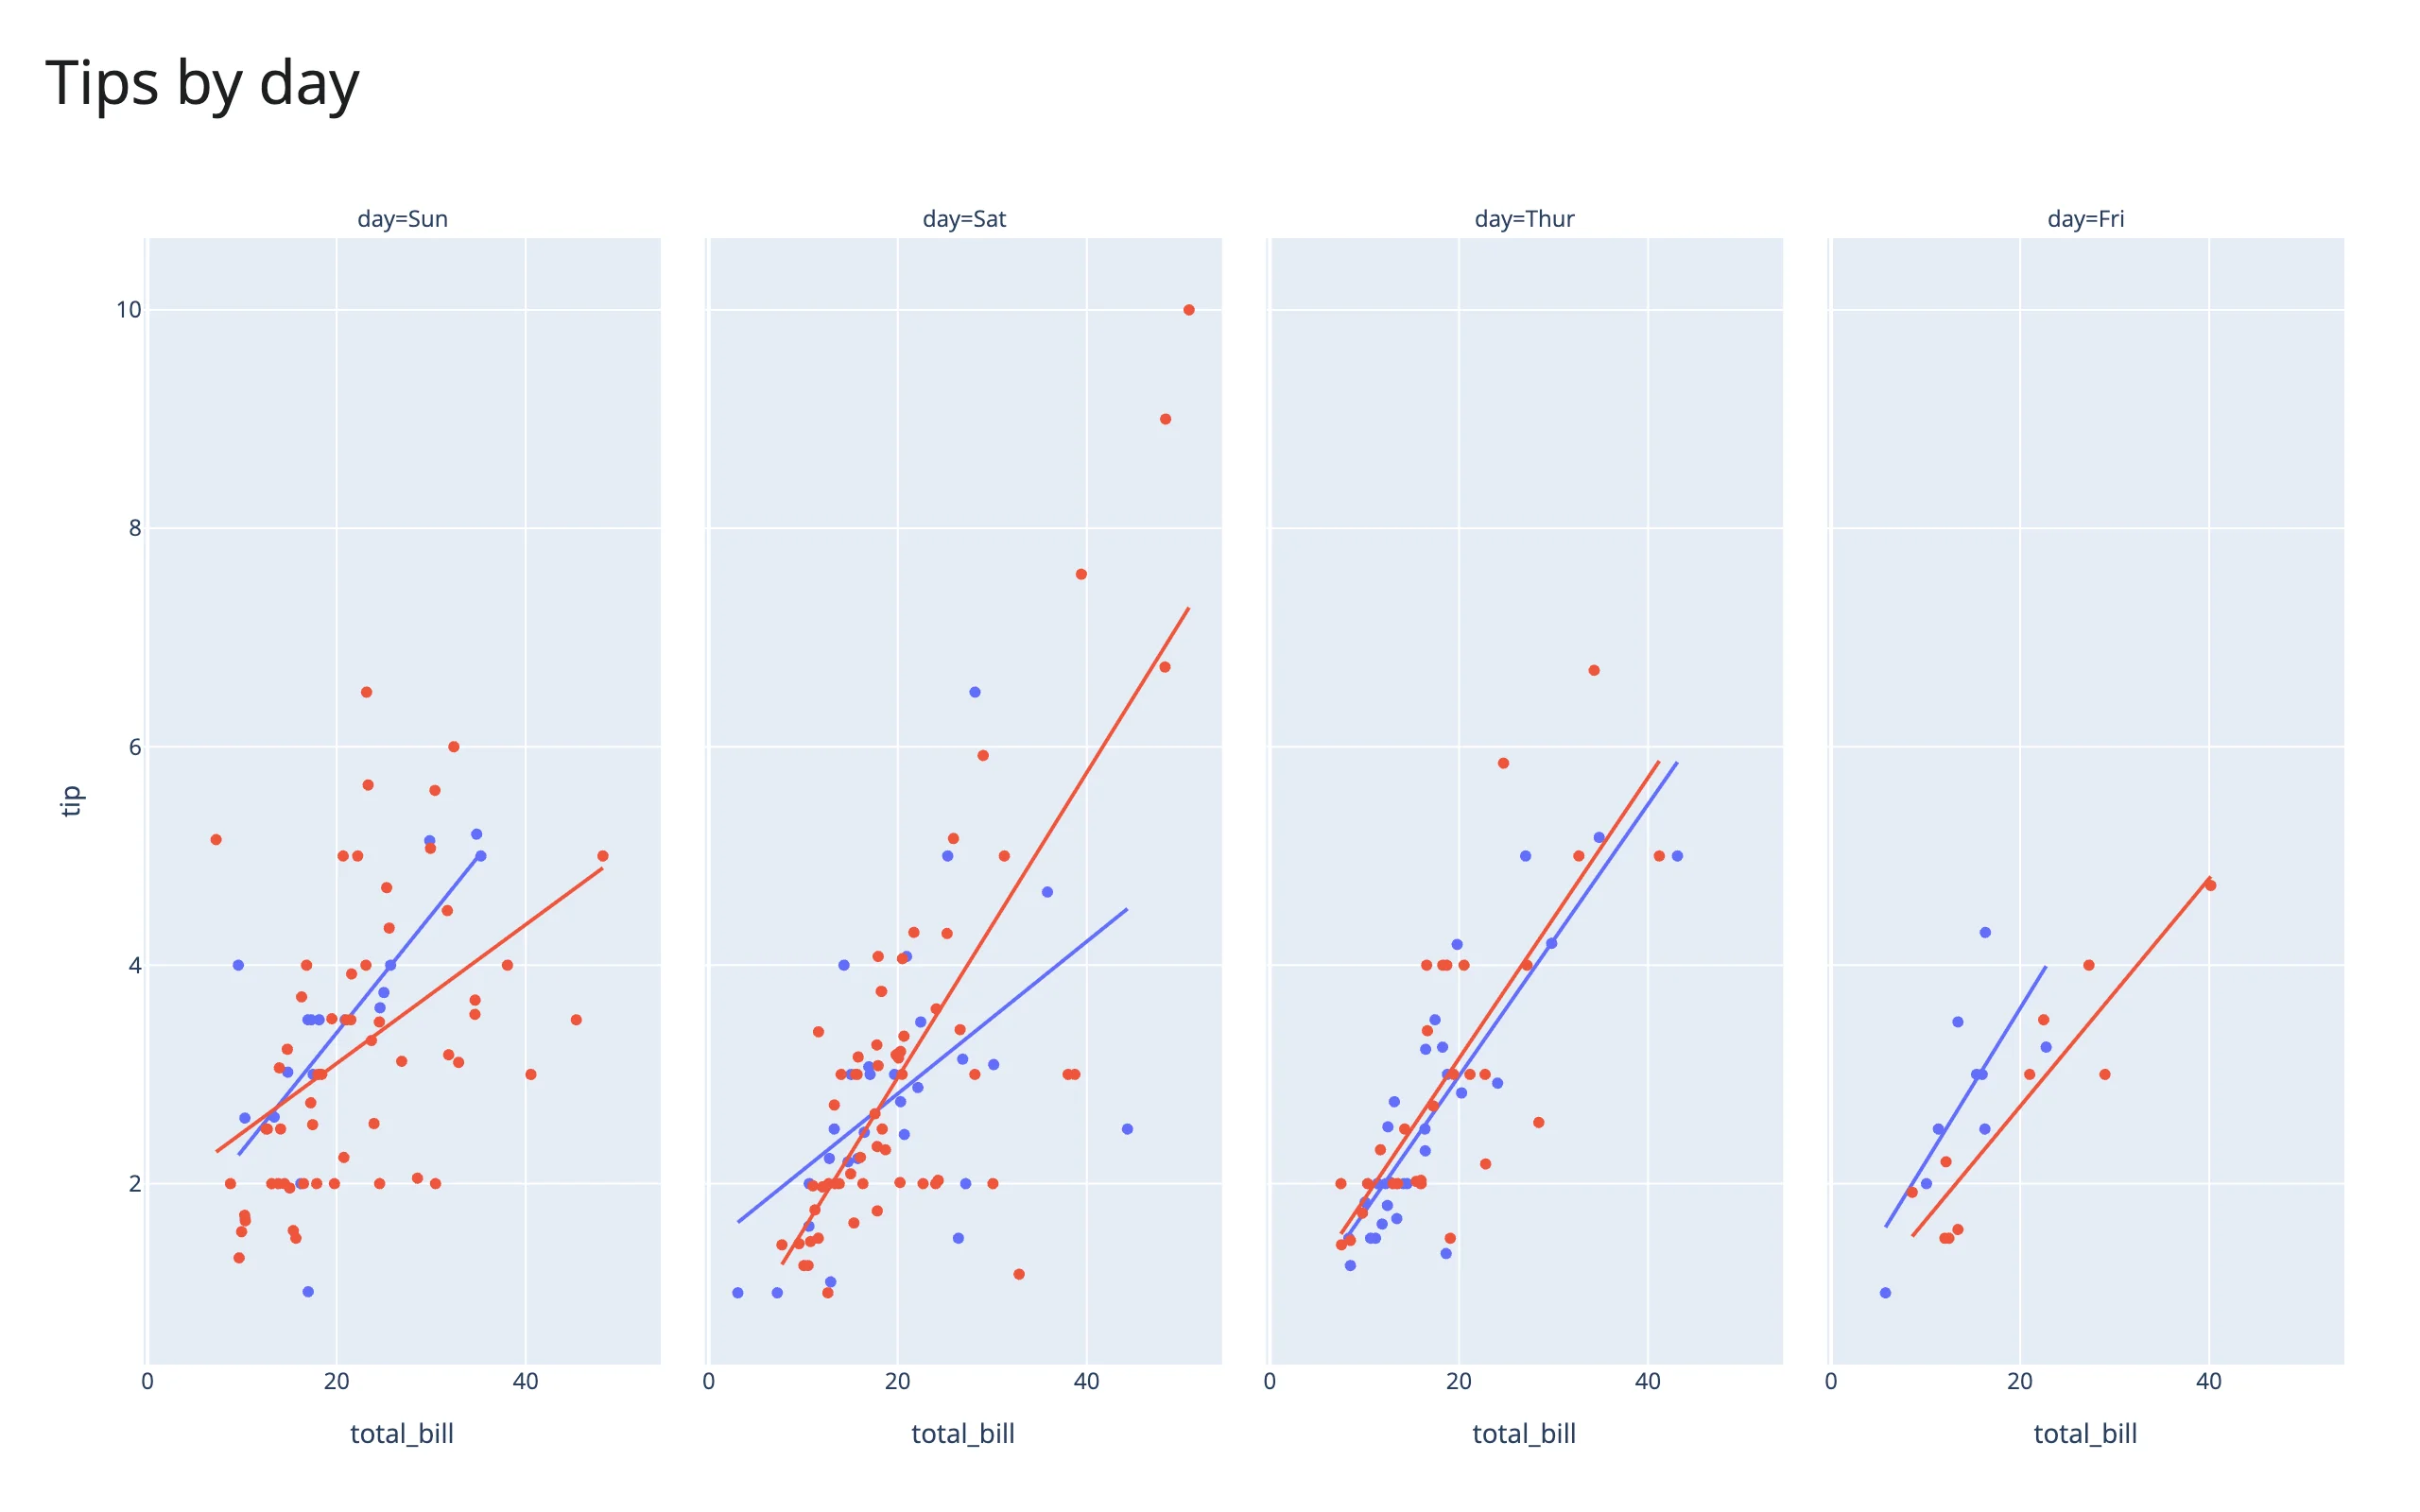
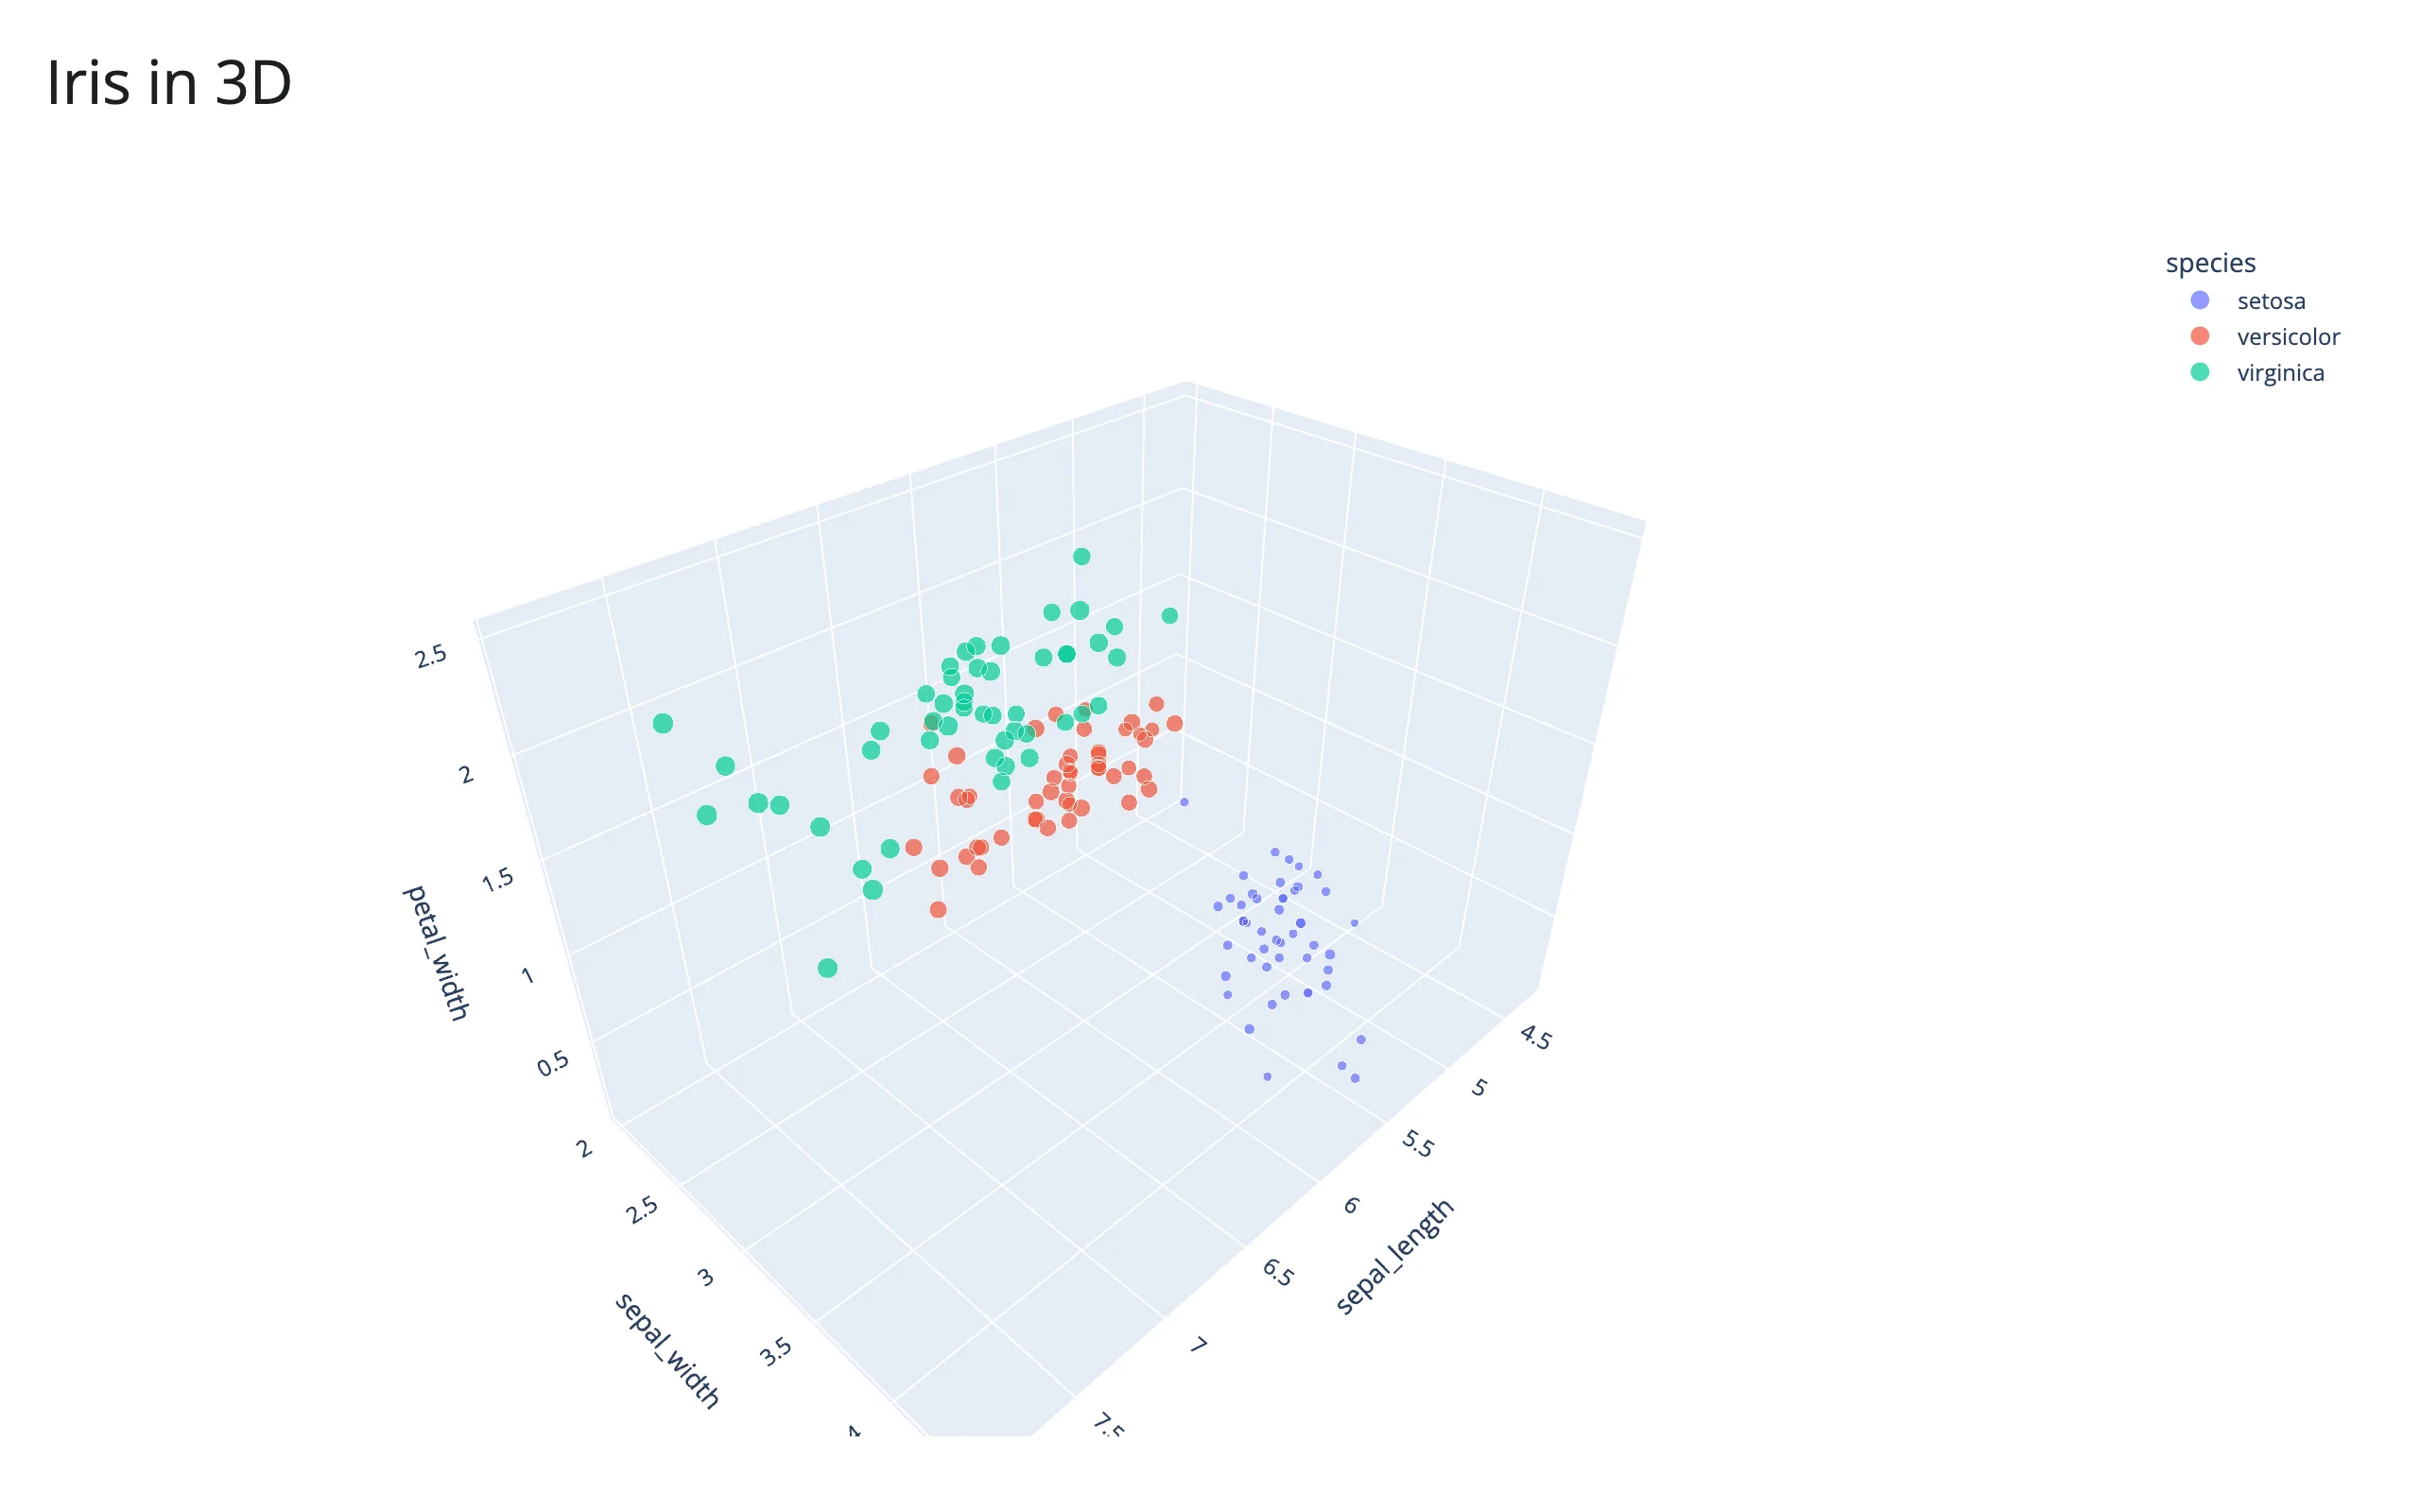
3D scatter, for free. px.scatter_3d gets you an orbitable 3D view with the same API as 2D:
import plotly.express as px
from shiny.express import ui
from shinywidgets import render_plotly

df = px.data.iris()

ui.page_opts(title="Iris in 3D", fillable=True)


@render_plotly
def plot3d():
    return px.scatter_3d(
        df,
        x="sepal_length",
        y="sepal_width",
        z="petal_width",
        color="species",
        size="petal_length",
        size_max=18,
    )
Mixed chart types and dual axes. graph_objects.make_subplots builds layouts px can’t – here a line and a bar sharing an x-axis with independent y-axes:
import plotly.express as px
from plotly.subplots import make_subplots
from shiny.express import ui
from shinywidgets import render_plotly

df = px.data.stocks()

ui.page_opts(title="Stocks", fillable=True)


@render_plotly
def combo():
    fig = make_subplots(specs=[[{"secondary_y": True}]])
    fig.add_scatter(x=df["date"], y=df["GOOG"], name="GOOG", secondary_y=False)
    fig.add_bar(
        x=df["date"],
        y=df["GOOG"].diff(),
        name="day/day change",
        secondary_y=True,
        opacity=0.3,
    )
    fig.update_yaxes(title_text="price (normalized)", secondary_y=False)
    fig.update_yaxes(title_text="change", secondary_y=True)
    return fig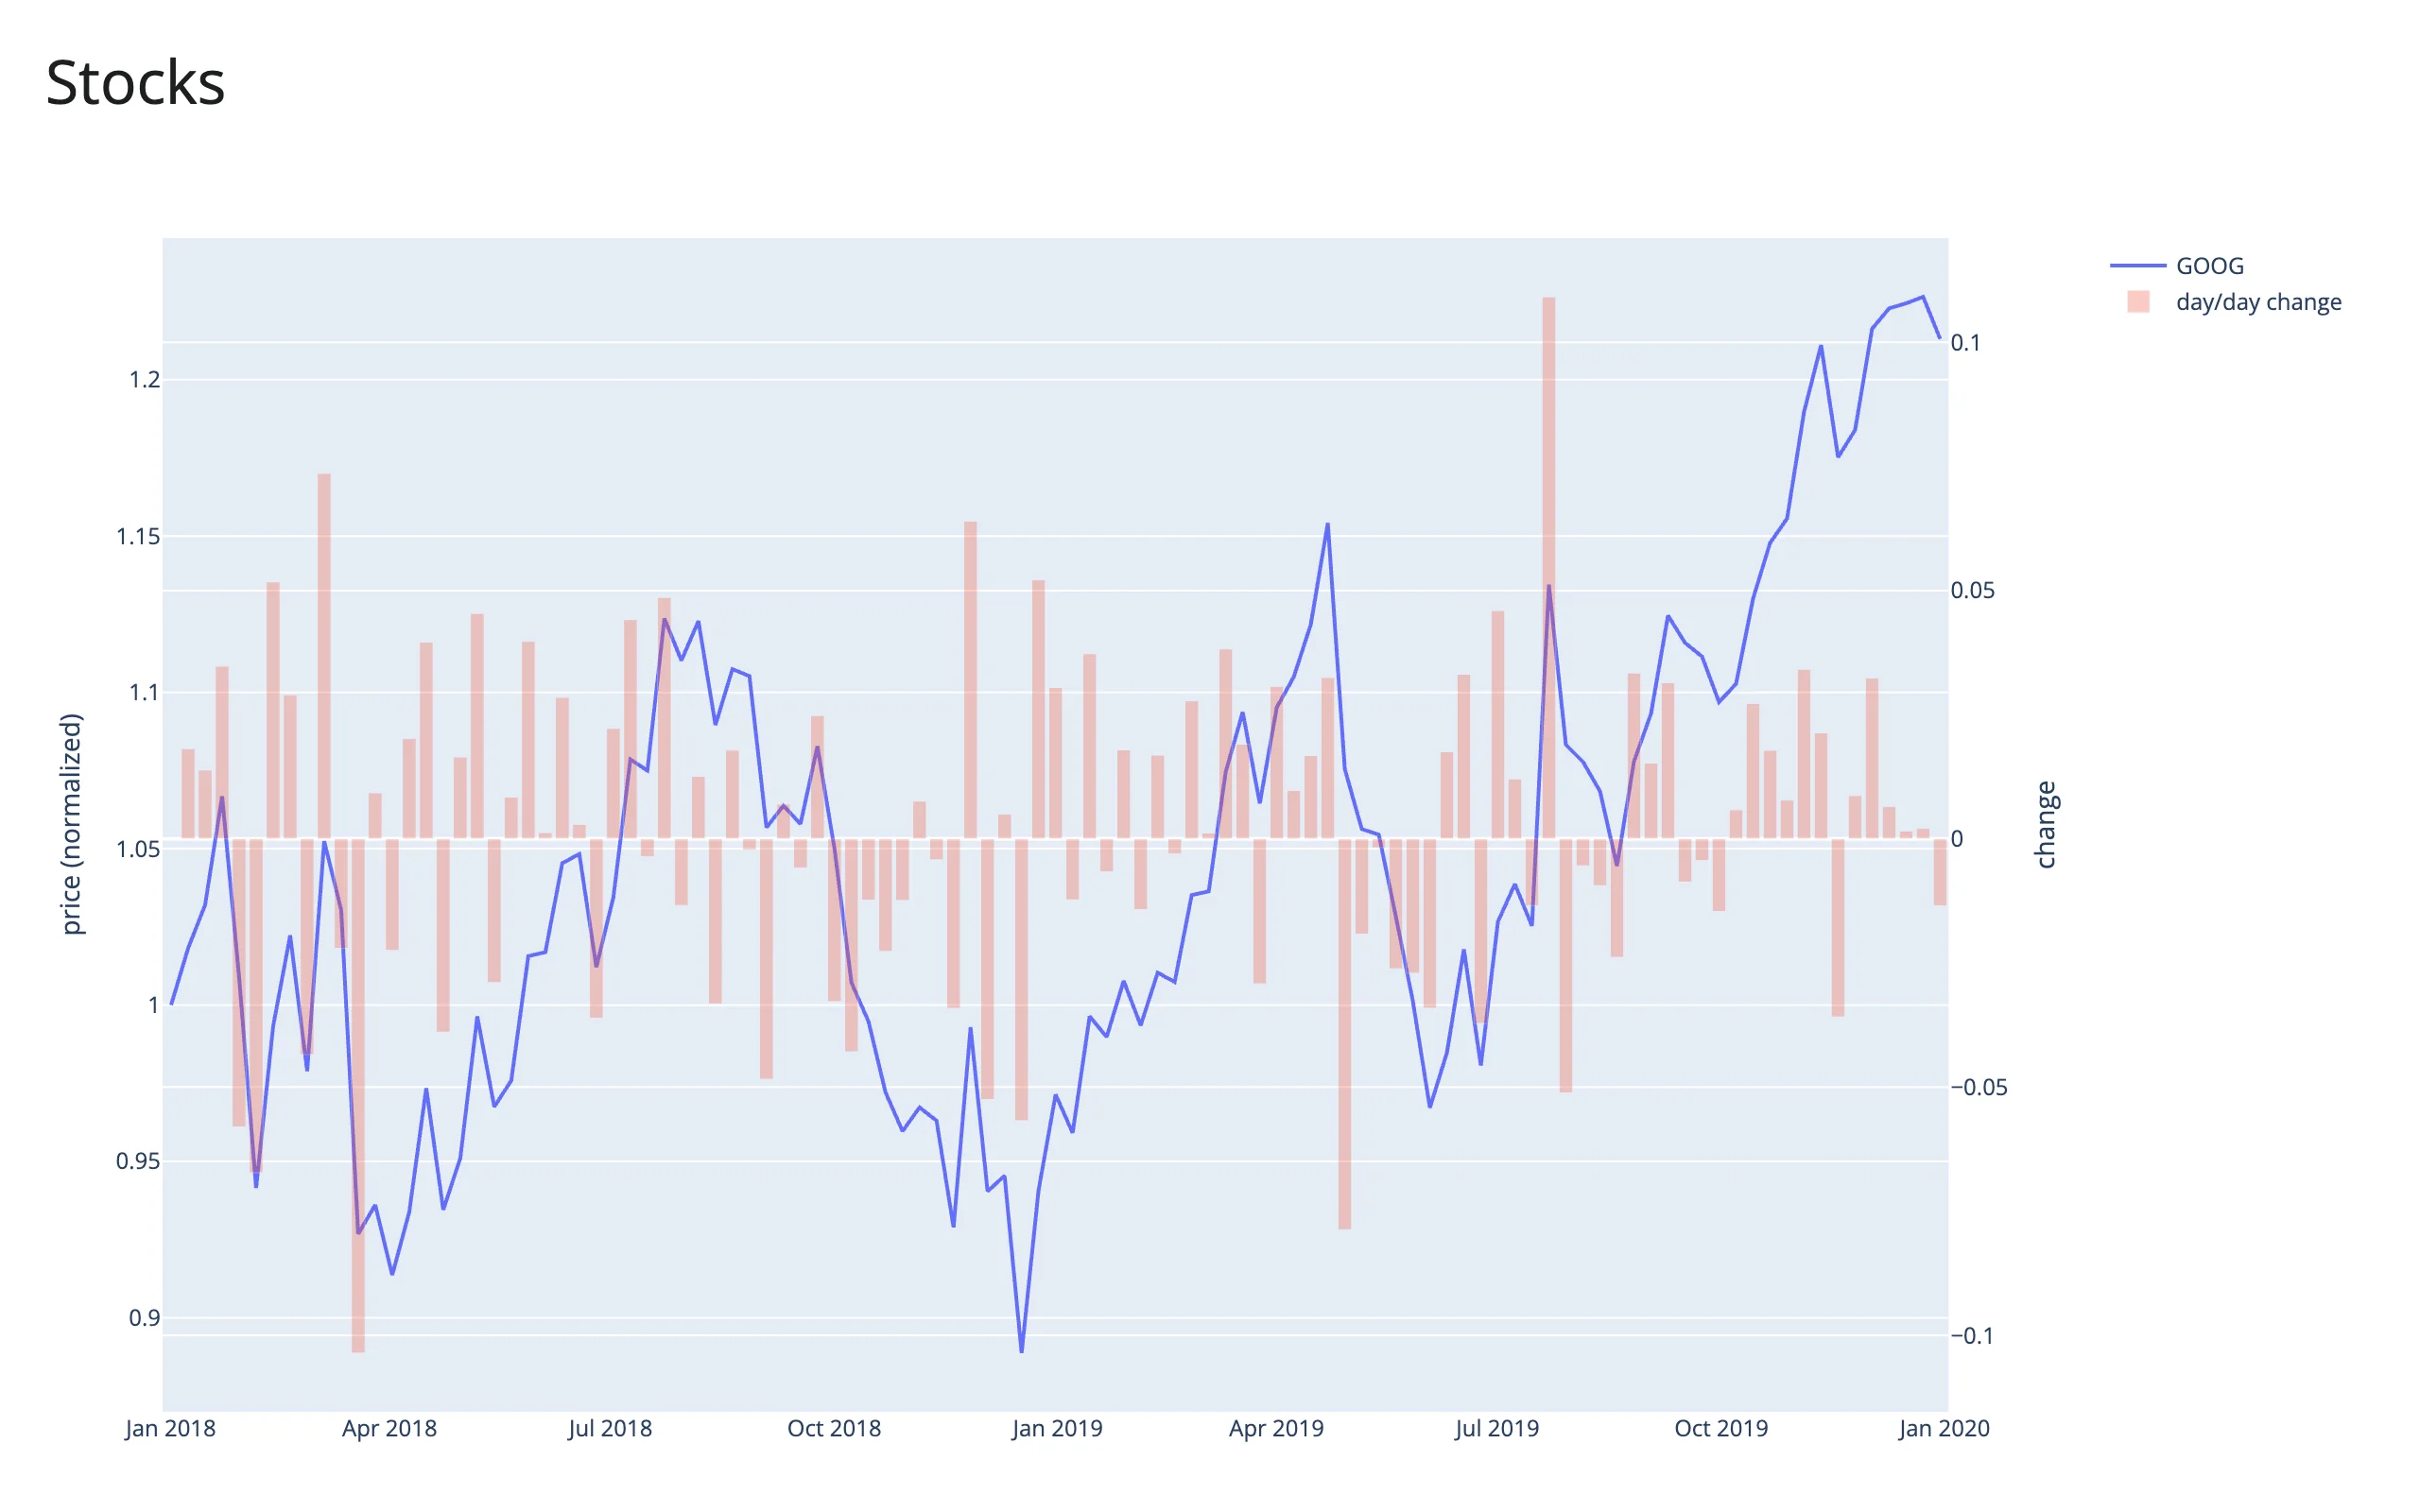
For the rest of plotly.express’s chart types (choropleths, Sankey, violin, treemap, and more), see the plotly.express API reference.
Reacting to user interaction
Return a figure and shinywidgets’ event bridge listens to plotly.js directly (plotly.py’s own widget drops some events and strips customdata), so every accessor below works on a plain px/go figure – no callback registration needed. Call an accessor from any reactive context (a @render.* function, @reactive.calc, or @reactive.effect); it invalidates that context whenever the interaction changes, the same way input.x() does.
Accessors are inputs that remember. Each one attaches the moment the figure renders and records what the user does whether or not anything has read it yet – there’s no “warm-up” read needed to arm it. A re-render gives the user a new figure, but the last interaction isn’t thrown away: clicked(), hover(), selecting(), brushing(), relayout(), double_clicked(), and legend_clicked() keep their value until the user interacts with the new figure, so a payload can briefly describe the previous render’s plot (positional point_index/trace_index can point at a different point after a re-render with new data – key lookups off customdata instead, as selected_rows() does). selected(), brushed(), and visible_traces() instead re-seed from the new figure at every render, since plotly.js tracks selection and trace visibility as state on the graph div, not just as events – they report what the new figure actually shows (initially nothing selected, so they go back to None/empty once it reports).
Accessor reference
| Accessor | Returns | Before any interaction | Across a re-render | Default rate policy |
|---|---|---|---|---|
clicked() |
points DataFrame |
None |
kept | none |
hover() |
points DataFrame |
None |
kept | debounce 250 ms |
selected() |
points DataFrame |
None |
re-seeded | none |
selecting() |
points DataFrame |
None |
kept | debounce 250 ms |
brushed() |
region dict (range or lassoPoints) |
None |
re-seeded | none |
brushing() |
region dict |
None |
kept | debounce 250 ms |
relayout() |
axis-range dict |
None |
kept | none |
double_clicked() |
True (a pulse) |
None |
kept | none |
legend_clicked() |
traces DataFrame |
None |
kept | none |
visible_traces() |
traces DataFrame |
seeded from the figure | re-seeded | none |
selected_rows(df, key=None) |
rows of df |
empty frame | re-seeded (follows selected()) |
follows selected() |
Points frames have columns trace_index, point_index, x, y, and z/customdata when the figure has them. point_index is a point’s position within its trace, not a row of your data – for px figures with color=, each color group is its own trace, so match rows via customdata (see selected_rows() below), not point_index.
Clearing semantics, verified on current main: a double-click clears clicked(), but only when the second click of the double-click lands on empty plot background. If it lands on a marker, that click’s own plotly_click event fires after the clear and repopulates clicked() with that point – so double-clicking a point leaves clicked() unchanged, not None. A deselect (double-click after a box/lasso selection) does reliably clear selected()/selecting()/brushed()/brushing() to None. Separately: a plain click, when dragmode is "select" or "lasso", is itself a (zero-area) selection gesture, so it also resets selected()/brushed() to None – clicking and lassoing on the same figure will interact (see the gallery template below, which calls this out in its UI).
Since a double-click on the background both clears clicked() and pulses double_clicked(), reading clicked() alone can’t tell a double-click-reset apart from a deselect – read double_clicked() when you need to know specifically that the user double-clicked. One exception, verified on current main: with dragmode="select"/"lasso", a background double-click deselects without pulsing double_clicked() – plotly.js only emits the reset event where it means resetting the view (see double_clicked() below for which subplot types that covers).
clicked()
import plotly.express as px
from shiny.express import render, ui
from shinywidgets import render_plotly

df = px.data.gapminder().query("year == 2007").reset_index(drop=True)

ui.page_opts(title="Click a bubble", fillable=True)

with ui.layout_columns(col_widths=[7, 5]):
    with ui.card(full_screen=True):

        @render_plotly
        def plot():
            fig = px.scatter(
                df,
                x="gdpPercap",
                y="lifeExp",
                color="continent",
                log_x=True,
                custom_data=[df.index],
            )
            return fig

    with ui.card():
        ui.card_header("plot.clicked()")

        @render.code
        def clicked_out():
            pts = plot.clicked()
            if pts is None:
                return "None (click a bubble)"
            return pts.round(1).to_string(index=False)
Before (no click yet) and after clicking a bubble:
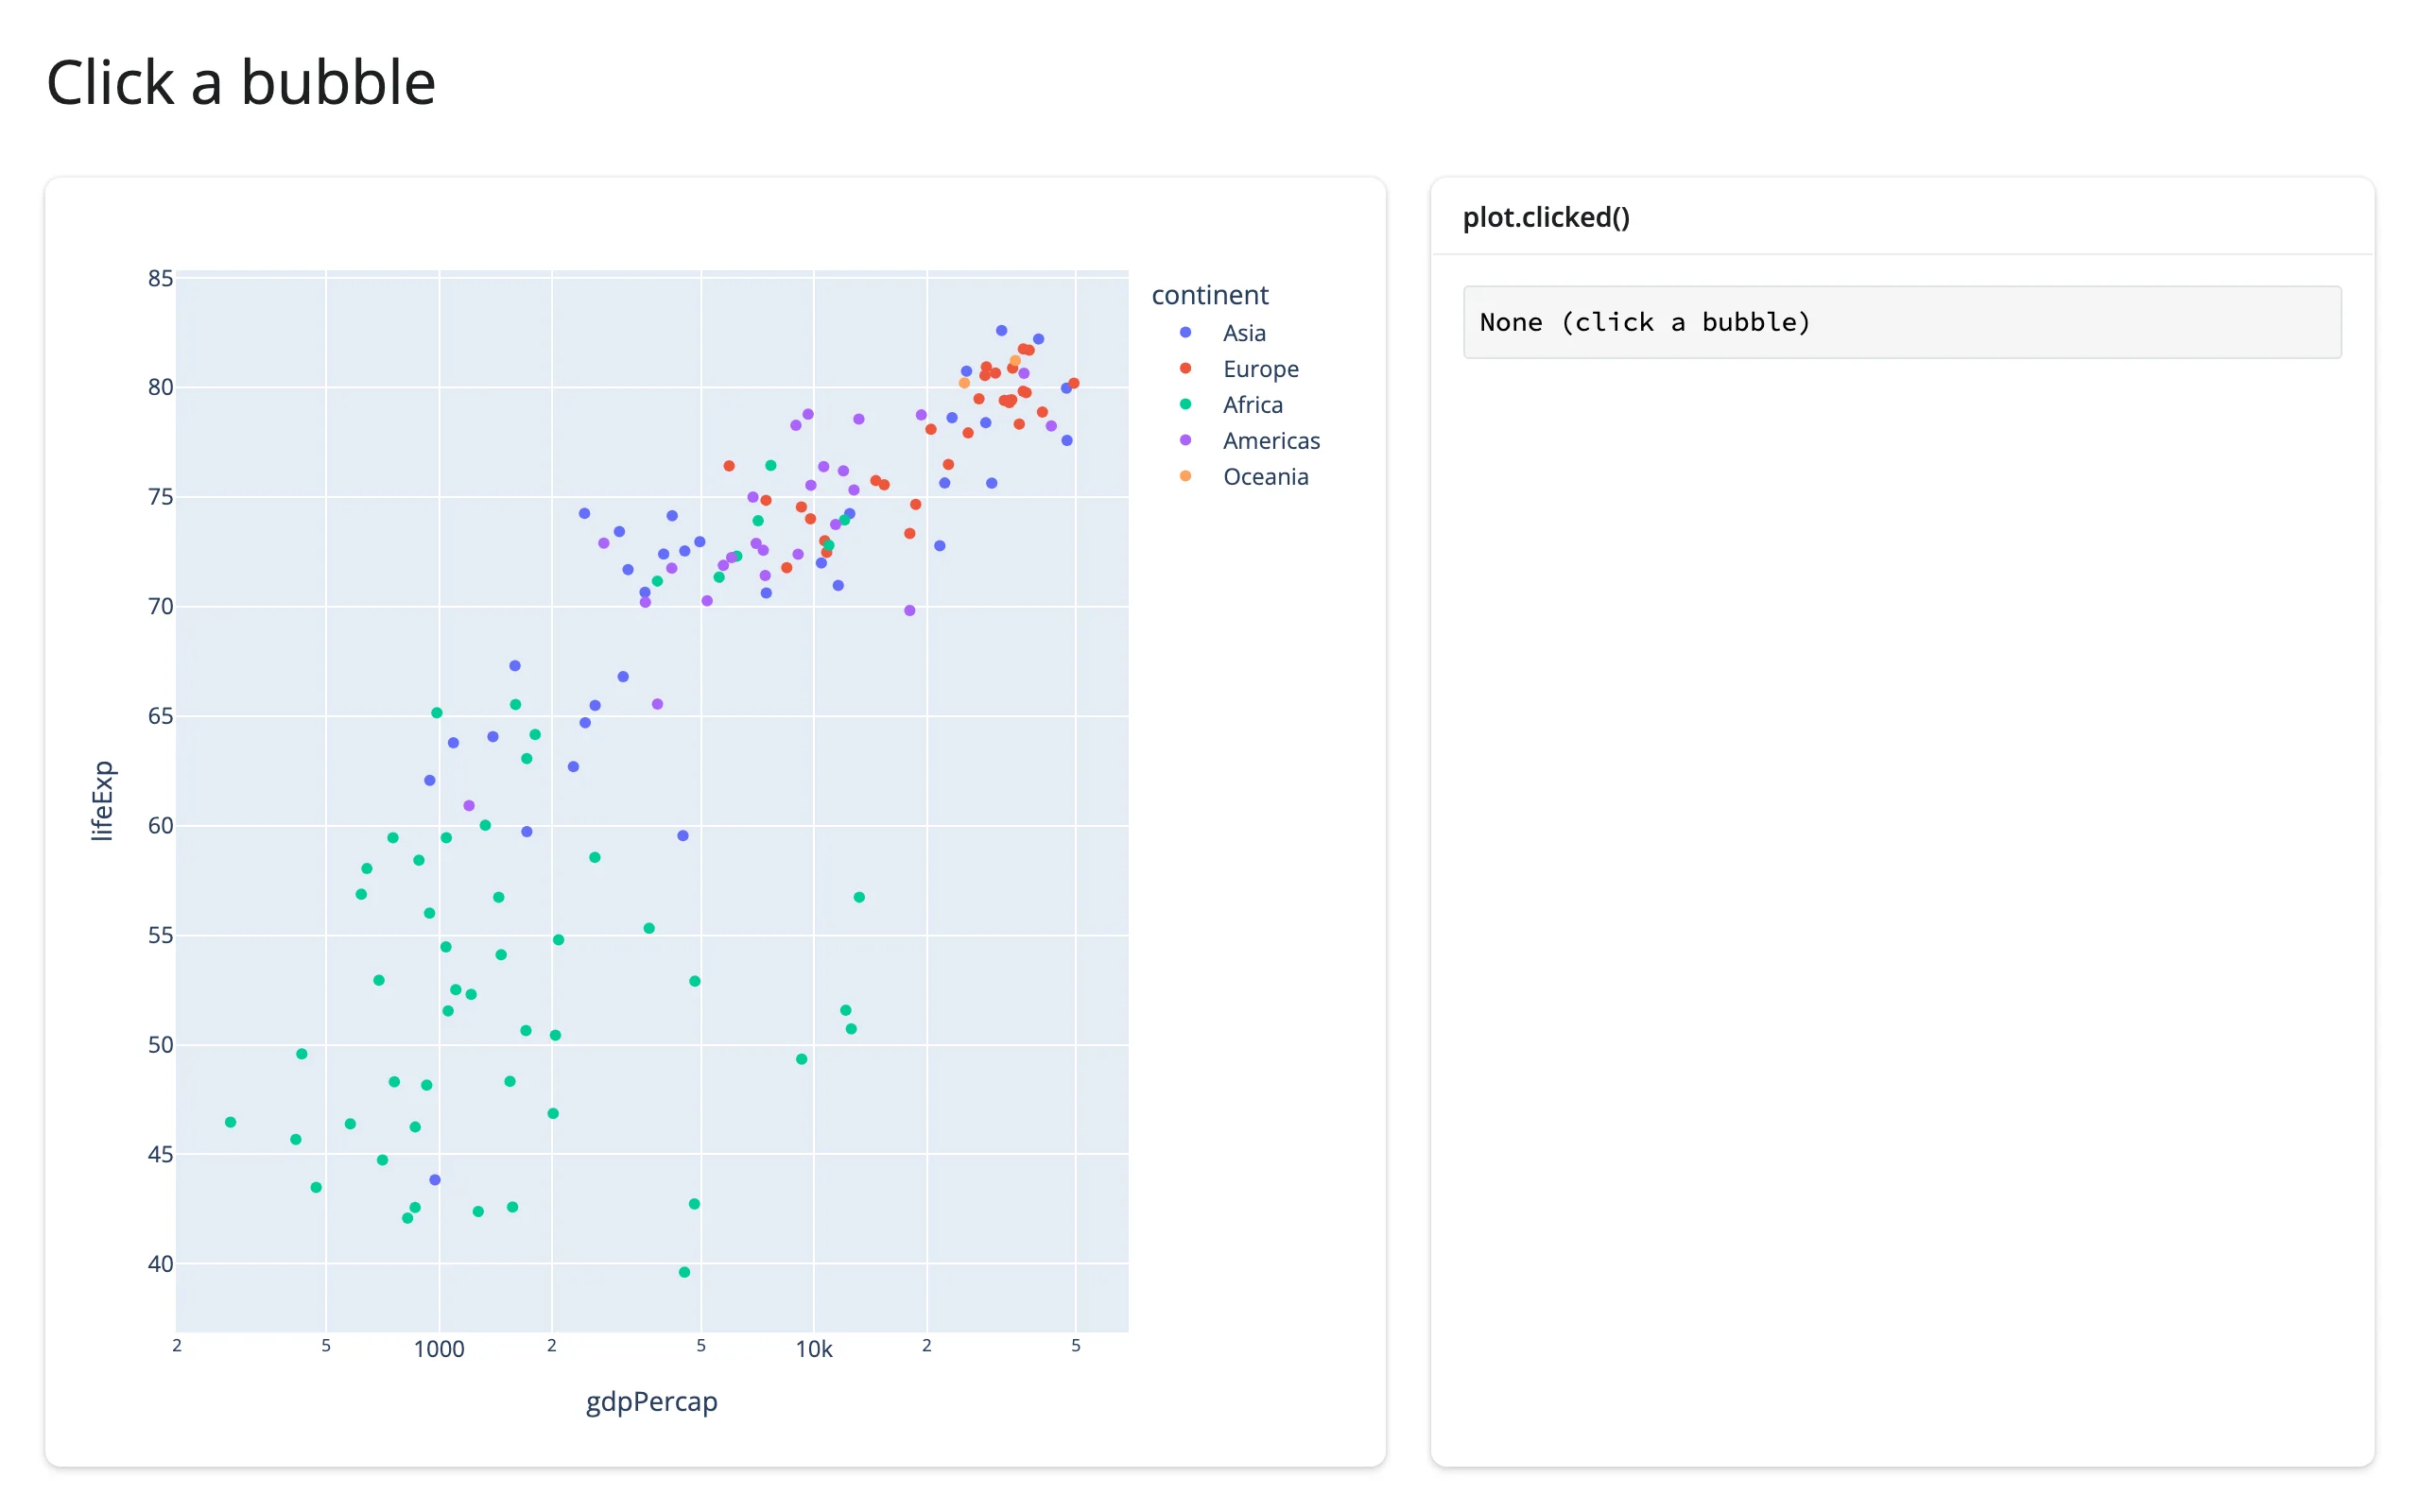
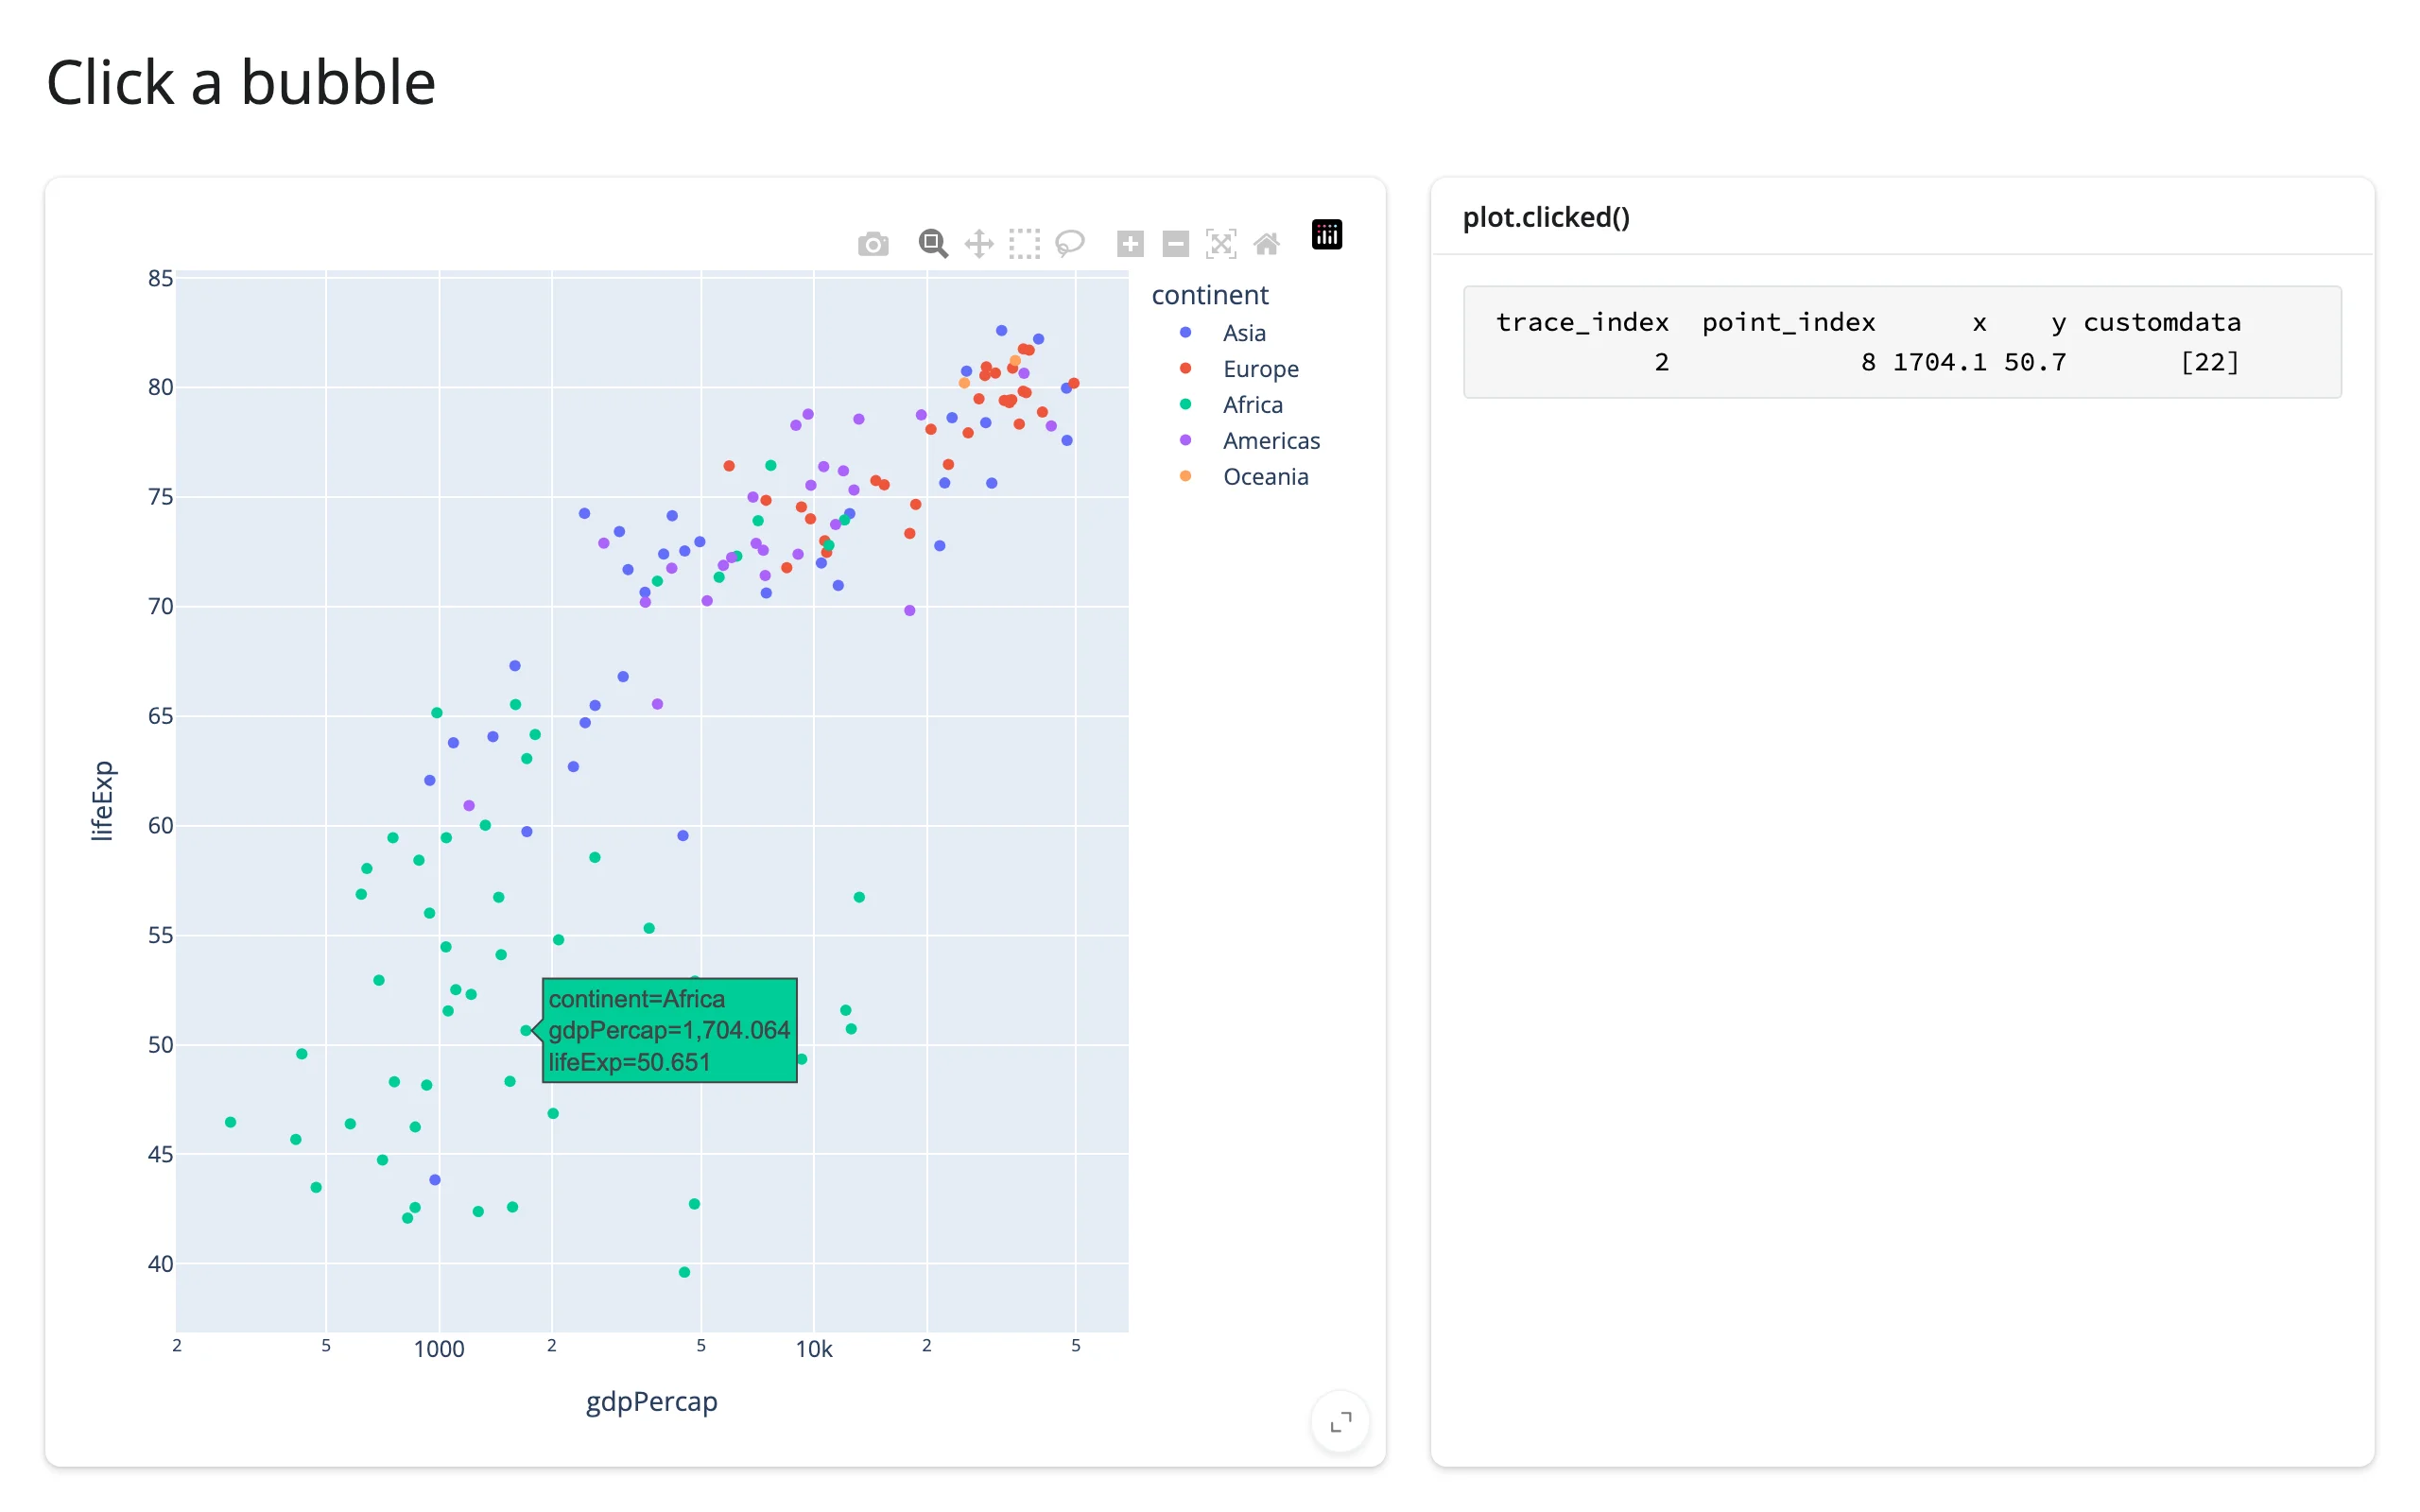
clicked() is kept across a re-render – the click still happened – so a reader can describe the previous render’s figure until the user clicks the new one. That’s safe here because selected_rows()/customdata keys off a stable row identity rather than point_index, but a raw point_index would be worth re-checking after a re-render that reshuffles the data.
selected() and selecting()
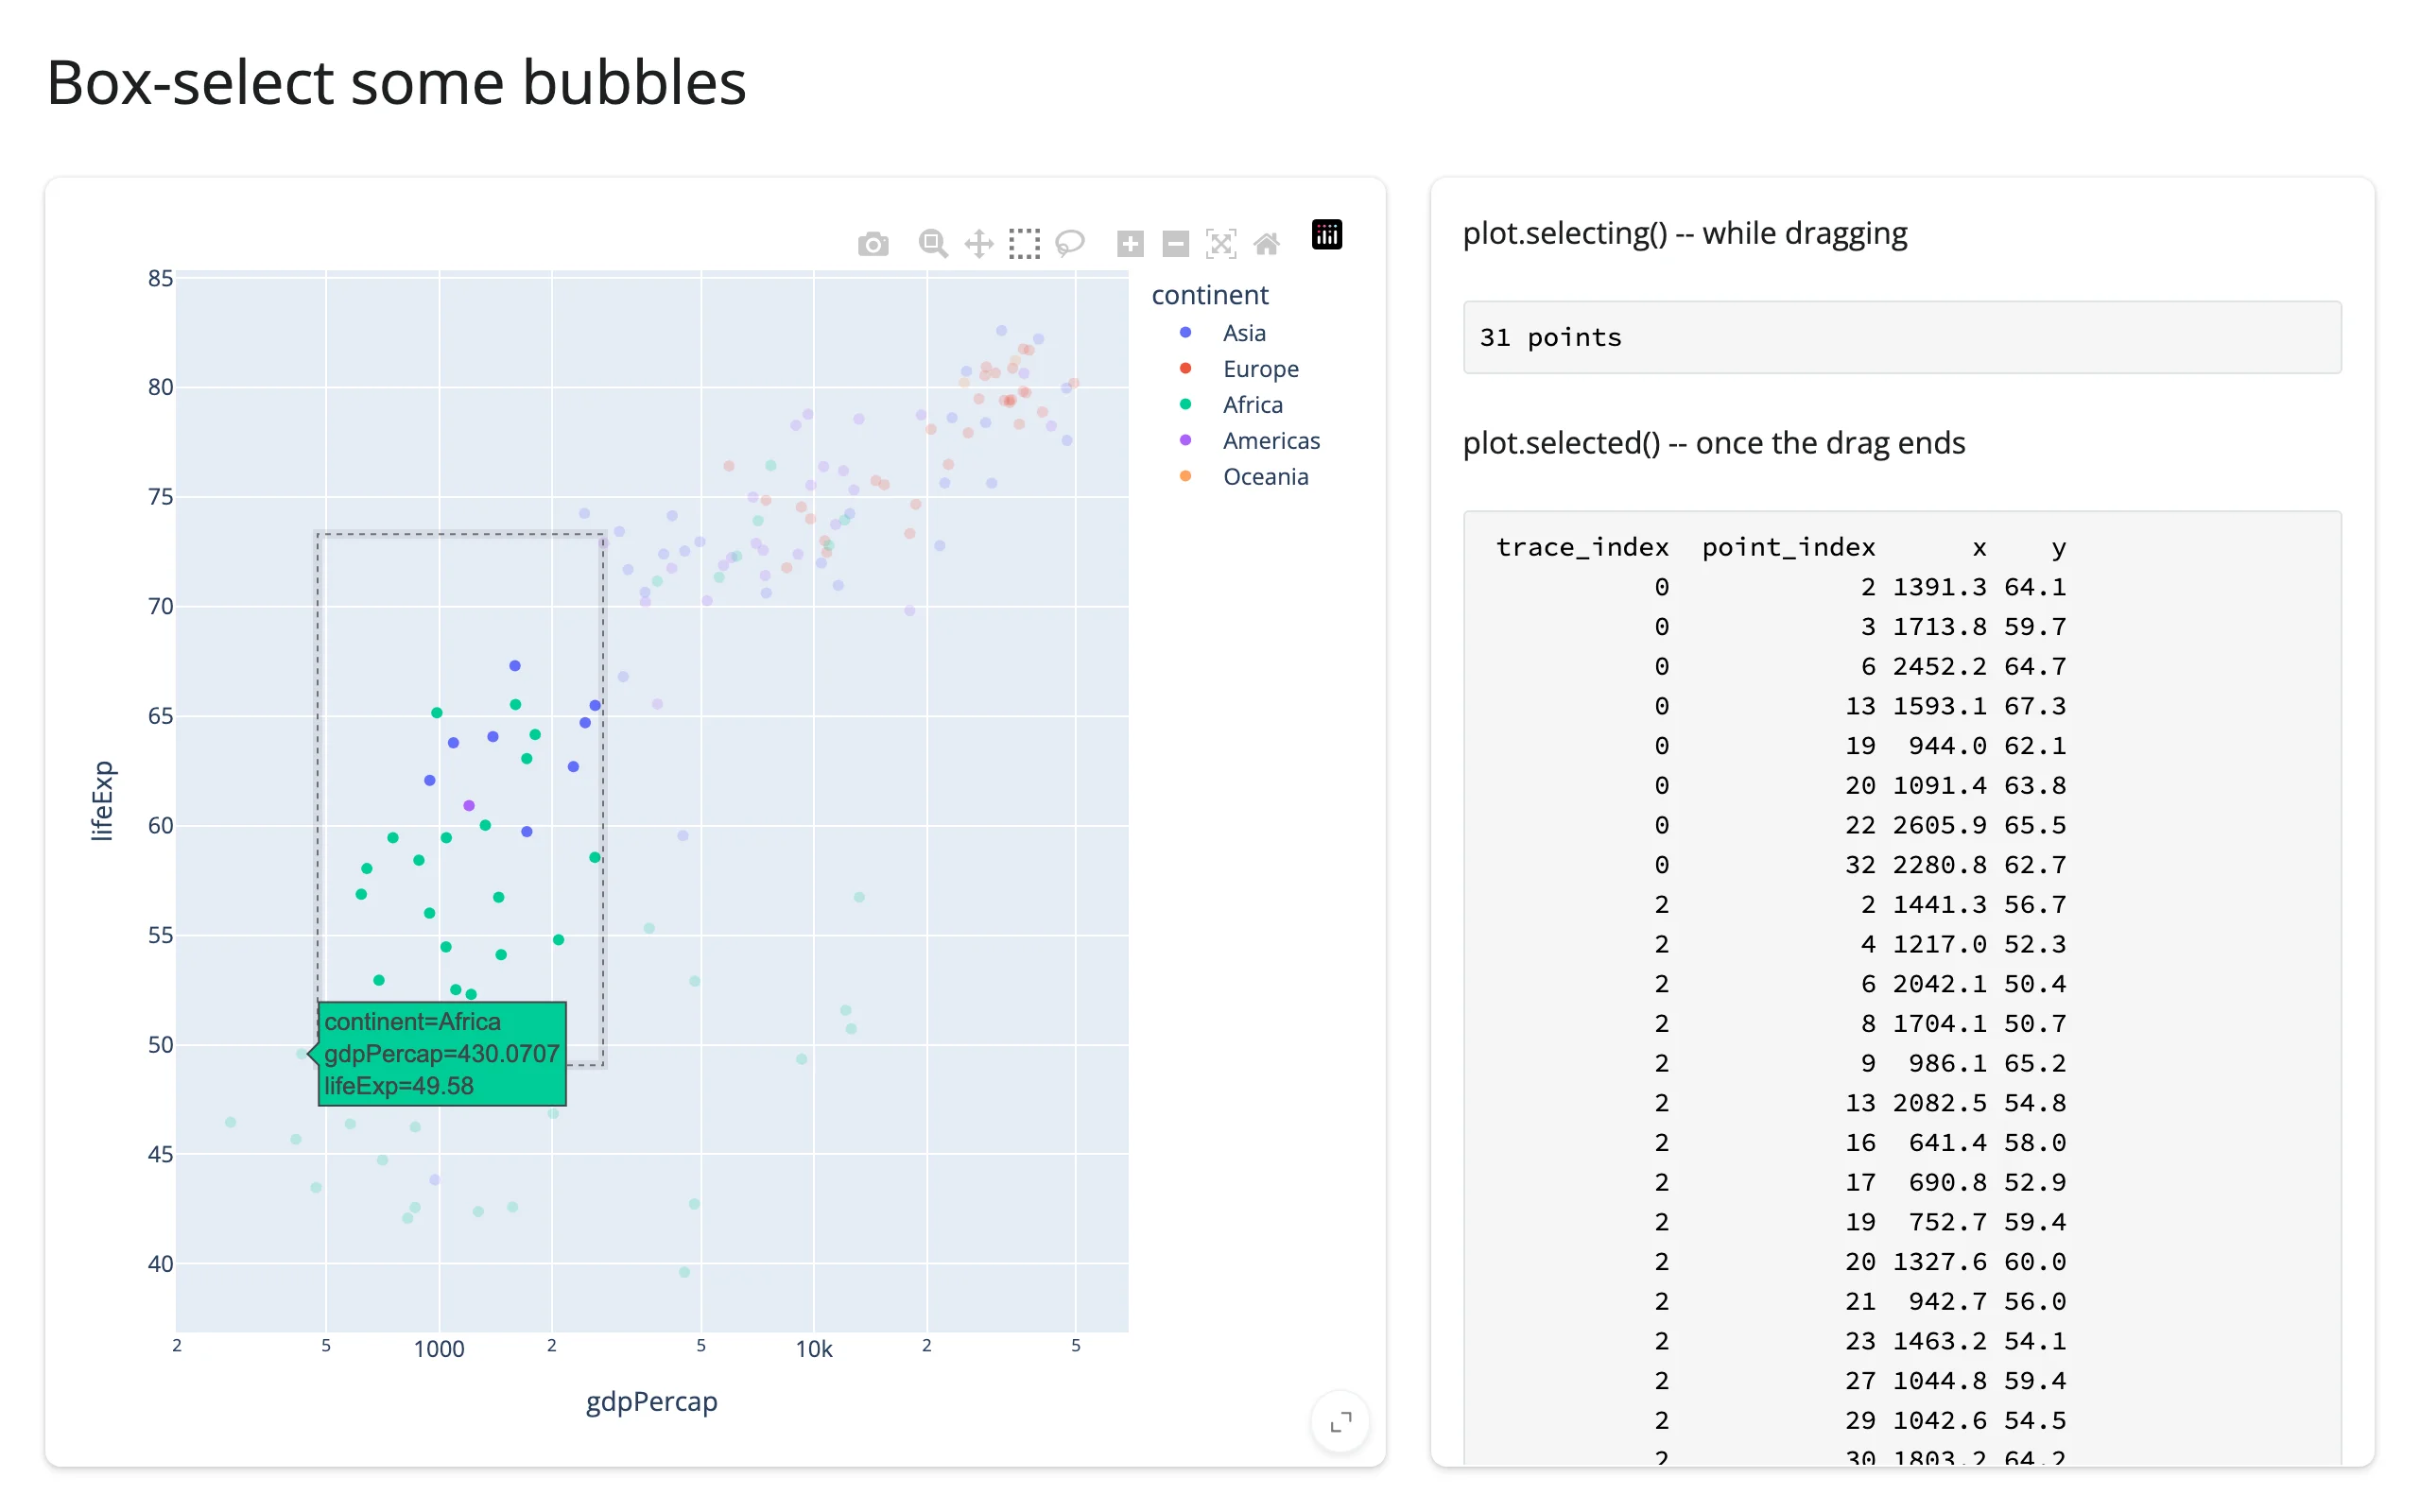
selecting() streams the same columns while the user drags; selected() reports once at the end of the gesture. Both reset on a deselect. Unlike clicked(), selected() is re-seeded at every render: plotly.js tracks the current selection as state on the figure itself, so a freshly rendered figure’s “current selection” is genuinely nothing, and selected() (and selected_rows()) reports that – it doesn’t carry over the previous figure’s selection the way clicked() carries over the previous click. selecting(), the drag stream, behaves like clicked() here and keeps its last value.
import plotly.express as px
from shiny.express import render, ui
from shinywidgets import render_plotly

df = px.data.gapminder().query("year == 2007").reset_index(drop=True)

ui.page_opts(title="Box-select some bubbles", fillable=True)

with ui.layout_columns(col_widths=[7, 5]):
    with ui.card(full_screen=True):

        @render_plotly
        def plot():
            fig = px.scatter(
                df,
                x="gdpPercap",
                y="lifeExp",
                color="continent",
                log_x=True,
                custom_data=[df.index],
            )
            fig.update_layout(dragmode="select")
            return fig

    with ui.card():
        "plot.selecting() -- while dragging"

        @render.code
        def selecting_out():
            pts = plot.selecting()
            return "None" if pts is None else f"{len(pts)} points"

        "plot.selected() -- once the drag ends"

        @render.code
        def selected_out():
            pts = plot.selected()
            if pts is None:
                return "None (drag a box)"
            cols = pts[["trace_index", "point_index", "x", "y"]]
            return cols.round(1).to_string(index=False)
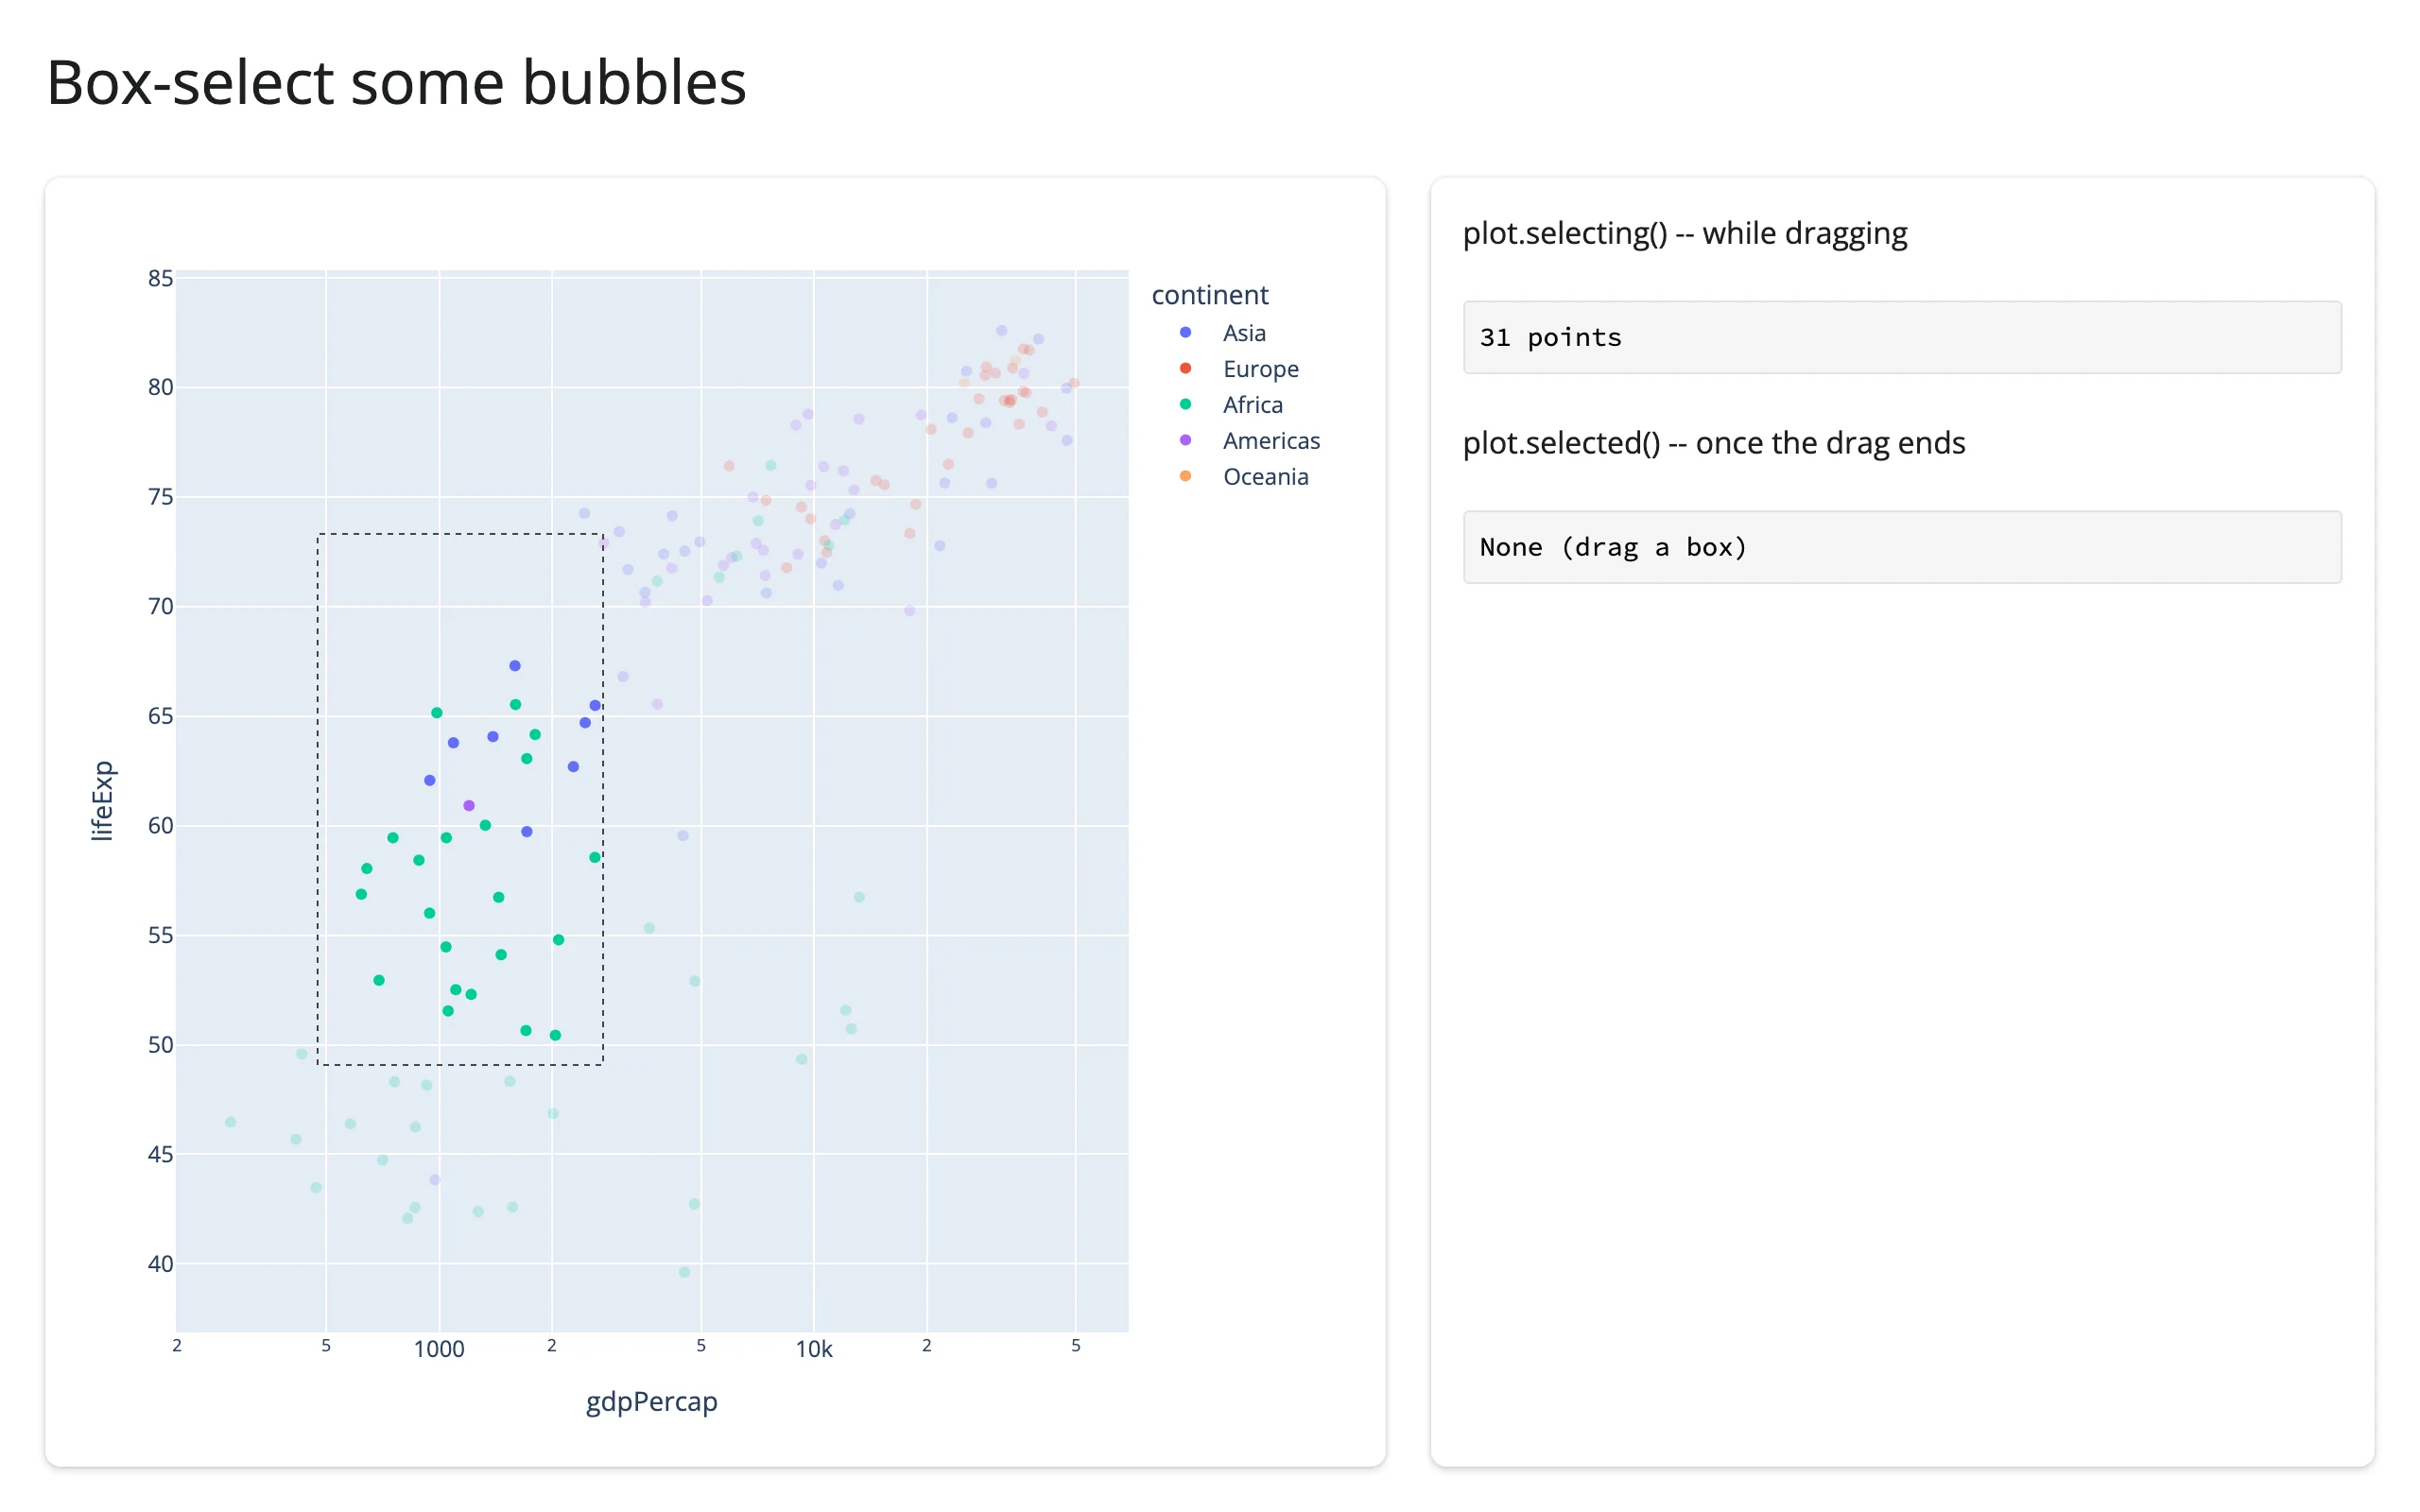
Mid-drag (selecting() already has 31 points; selected() hasn’t fired yet), and after release:
brushed() and brushing()
Where selected()/selecting() report points, brushed()/brushing() report the selection region itself – a box as {"range": {"x": [...], "y": [...]}}, a lasso as {"lassoPoints": {"x": [...], "y": [...]}} – in plotly.js’s native, data-space coordinates (verified: on a log-x axis, lassoPoints["x"] are the raw gdpPercap values, not their log10). Reach for this when you need the shape (e.g., to draw it on another plot or test arbitrary points against it) rather than the points plotly happened to catch.
import plotly.express as px
from shiny.express import render, ui
from shinywidgets import render_plotly

df = px.data.gapminder().query("year == 2007").reset_index(drop=True)

ui.page_opts(title="Lasso some bubbles", fillable=True)

with ui.layout_columns(col_widths=[7, 5]):
    with ui.card(full_screen=True):

        @render_plotly
        def plot():
            fig = px.scatter(df, x="gdpPercap", y="lifeExp", color="continent", log_x=True)
            fig.update_layout(dragmode="lasso")
            return fig

    with ui.card():
        "plot.brushing() -- while dragging"

        @render.code
        def brushing_out():
            region = plot.brushing()
            return "None" if region is None else list(region.keys())[0]

        "plot.brushed() -- once the drag ends"

        @render.code
        def brushed_out():
            region = plot.brushed()
            if region is None:
                return "None (drag a lasso)"
            shape, coords = next(iter(region.items()))
            rounded = {axis: [round(v, 1) for v in vs] for axis, vs in coords.items()}
            return f"{shape}: {rounded}"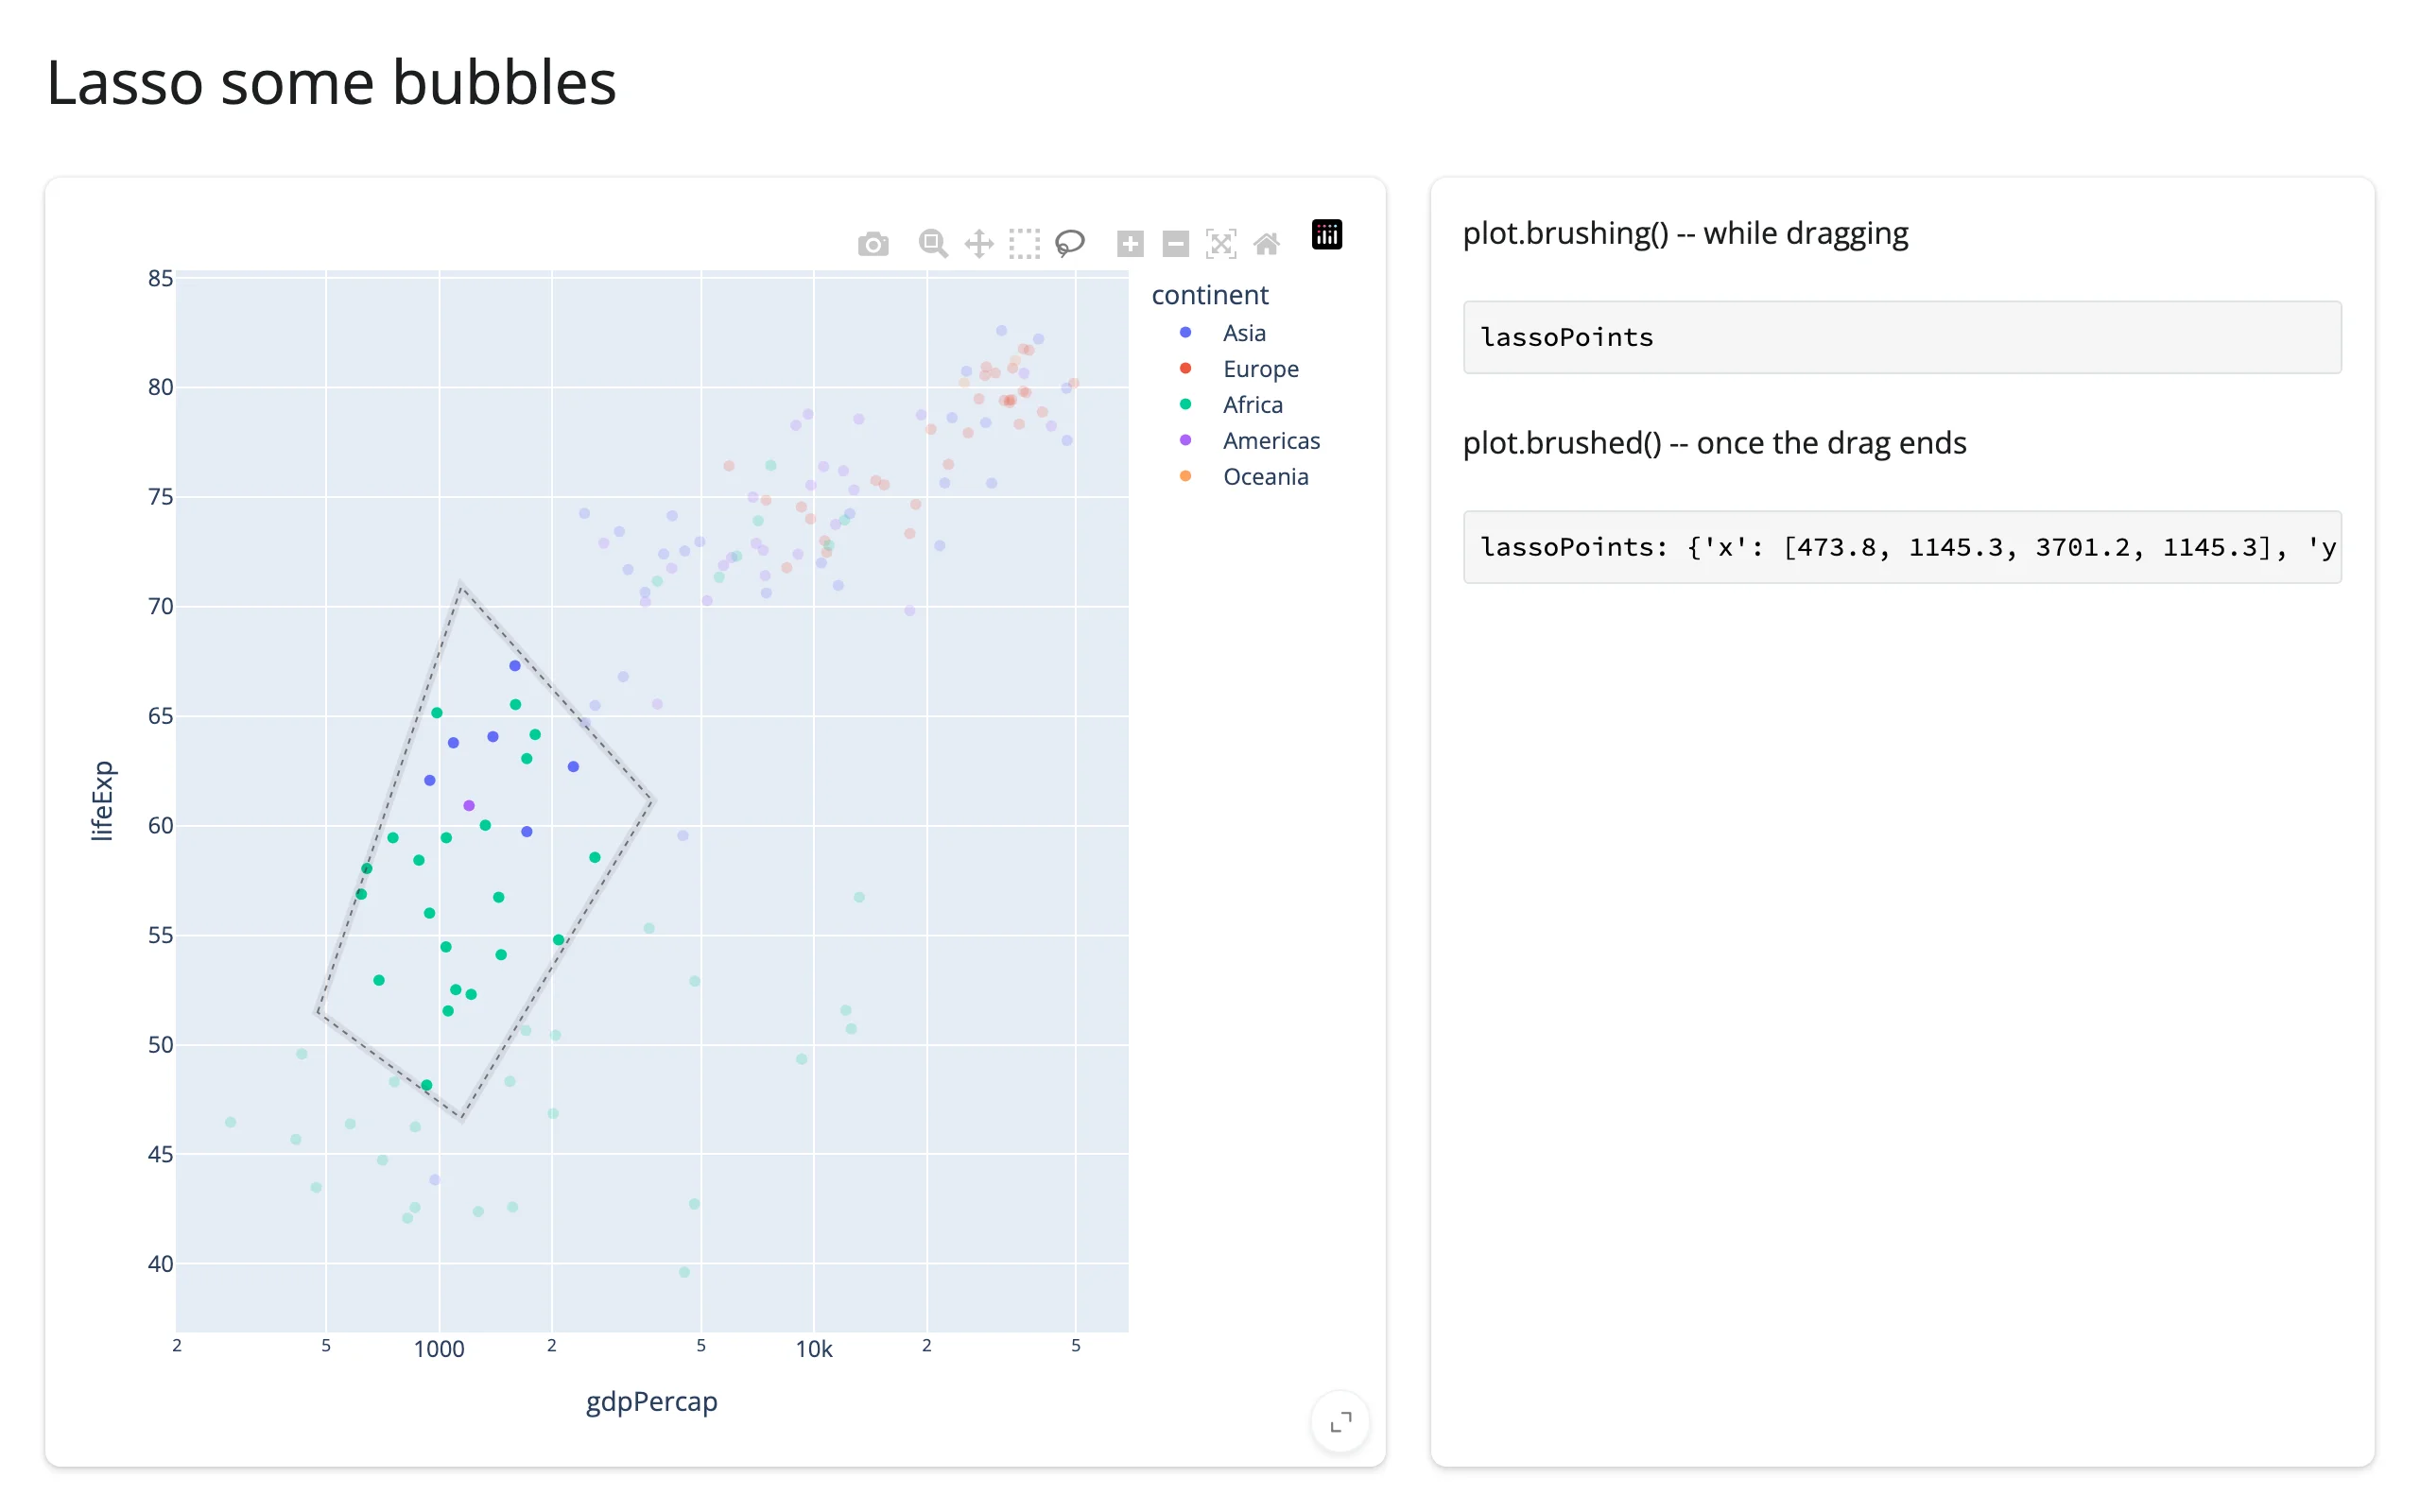
Like selected(), brushed() is re-seeded at every render (plotly.js’s selection state, not an event history), while brushing()’s drag stream is kept.
relayout()
Reports the axis ranges after a zoom, pan, or autoscale (e.g. double-click-to-reset), filtered to just the range/autorange keys – the raw plotly.js relayout event also fires on every render (autosize) and every modebar click (dragmode), which relayout() deliberately ignores.
import plotly.express as px
from shiny.express import render, ui
from shinywidgets import render_plotly

df = px.data.gapminder().query("year == 2007").reset_index(drop=True)


def fmt(v: object) -> str:
    return f"{v:.1f}" if isinstance(v, float) else str(v)


ui.page_opts(title="Zoom in", fillable=True)

with ui.layout_columns(col_widths=[7, 5]):
    with ui.card(full_screen=True):

        @render_plotly
        def plot():
            return px.scatter(df, x="lifeExp", y="gdpPercap", color="continent")

    with ui.card():
        ui.card_header("plot.relayout()")

        @render.code
        def relayout_out():
            axes = plot.relayout()
            if axes is None:
                return "None (zoom or pan)"
            return "\n".join(f"{k}: {fmt(v)}" for k, v in axes.items())
After a zoom-drag, and after double-clicking to reset (autorange):
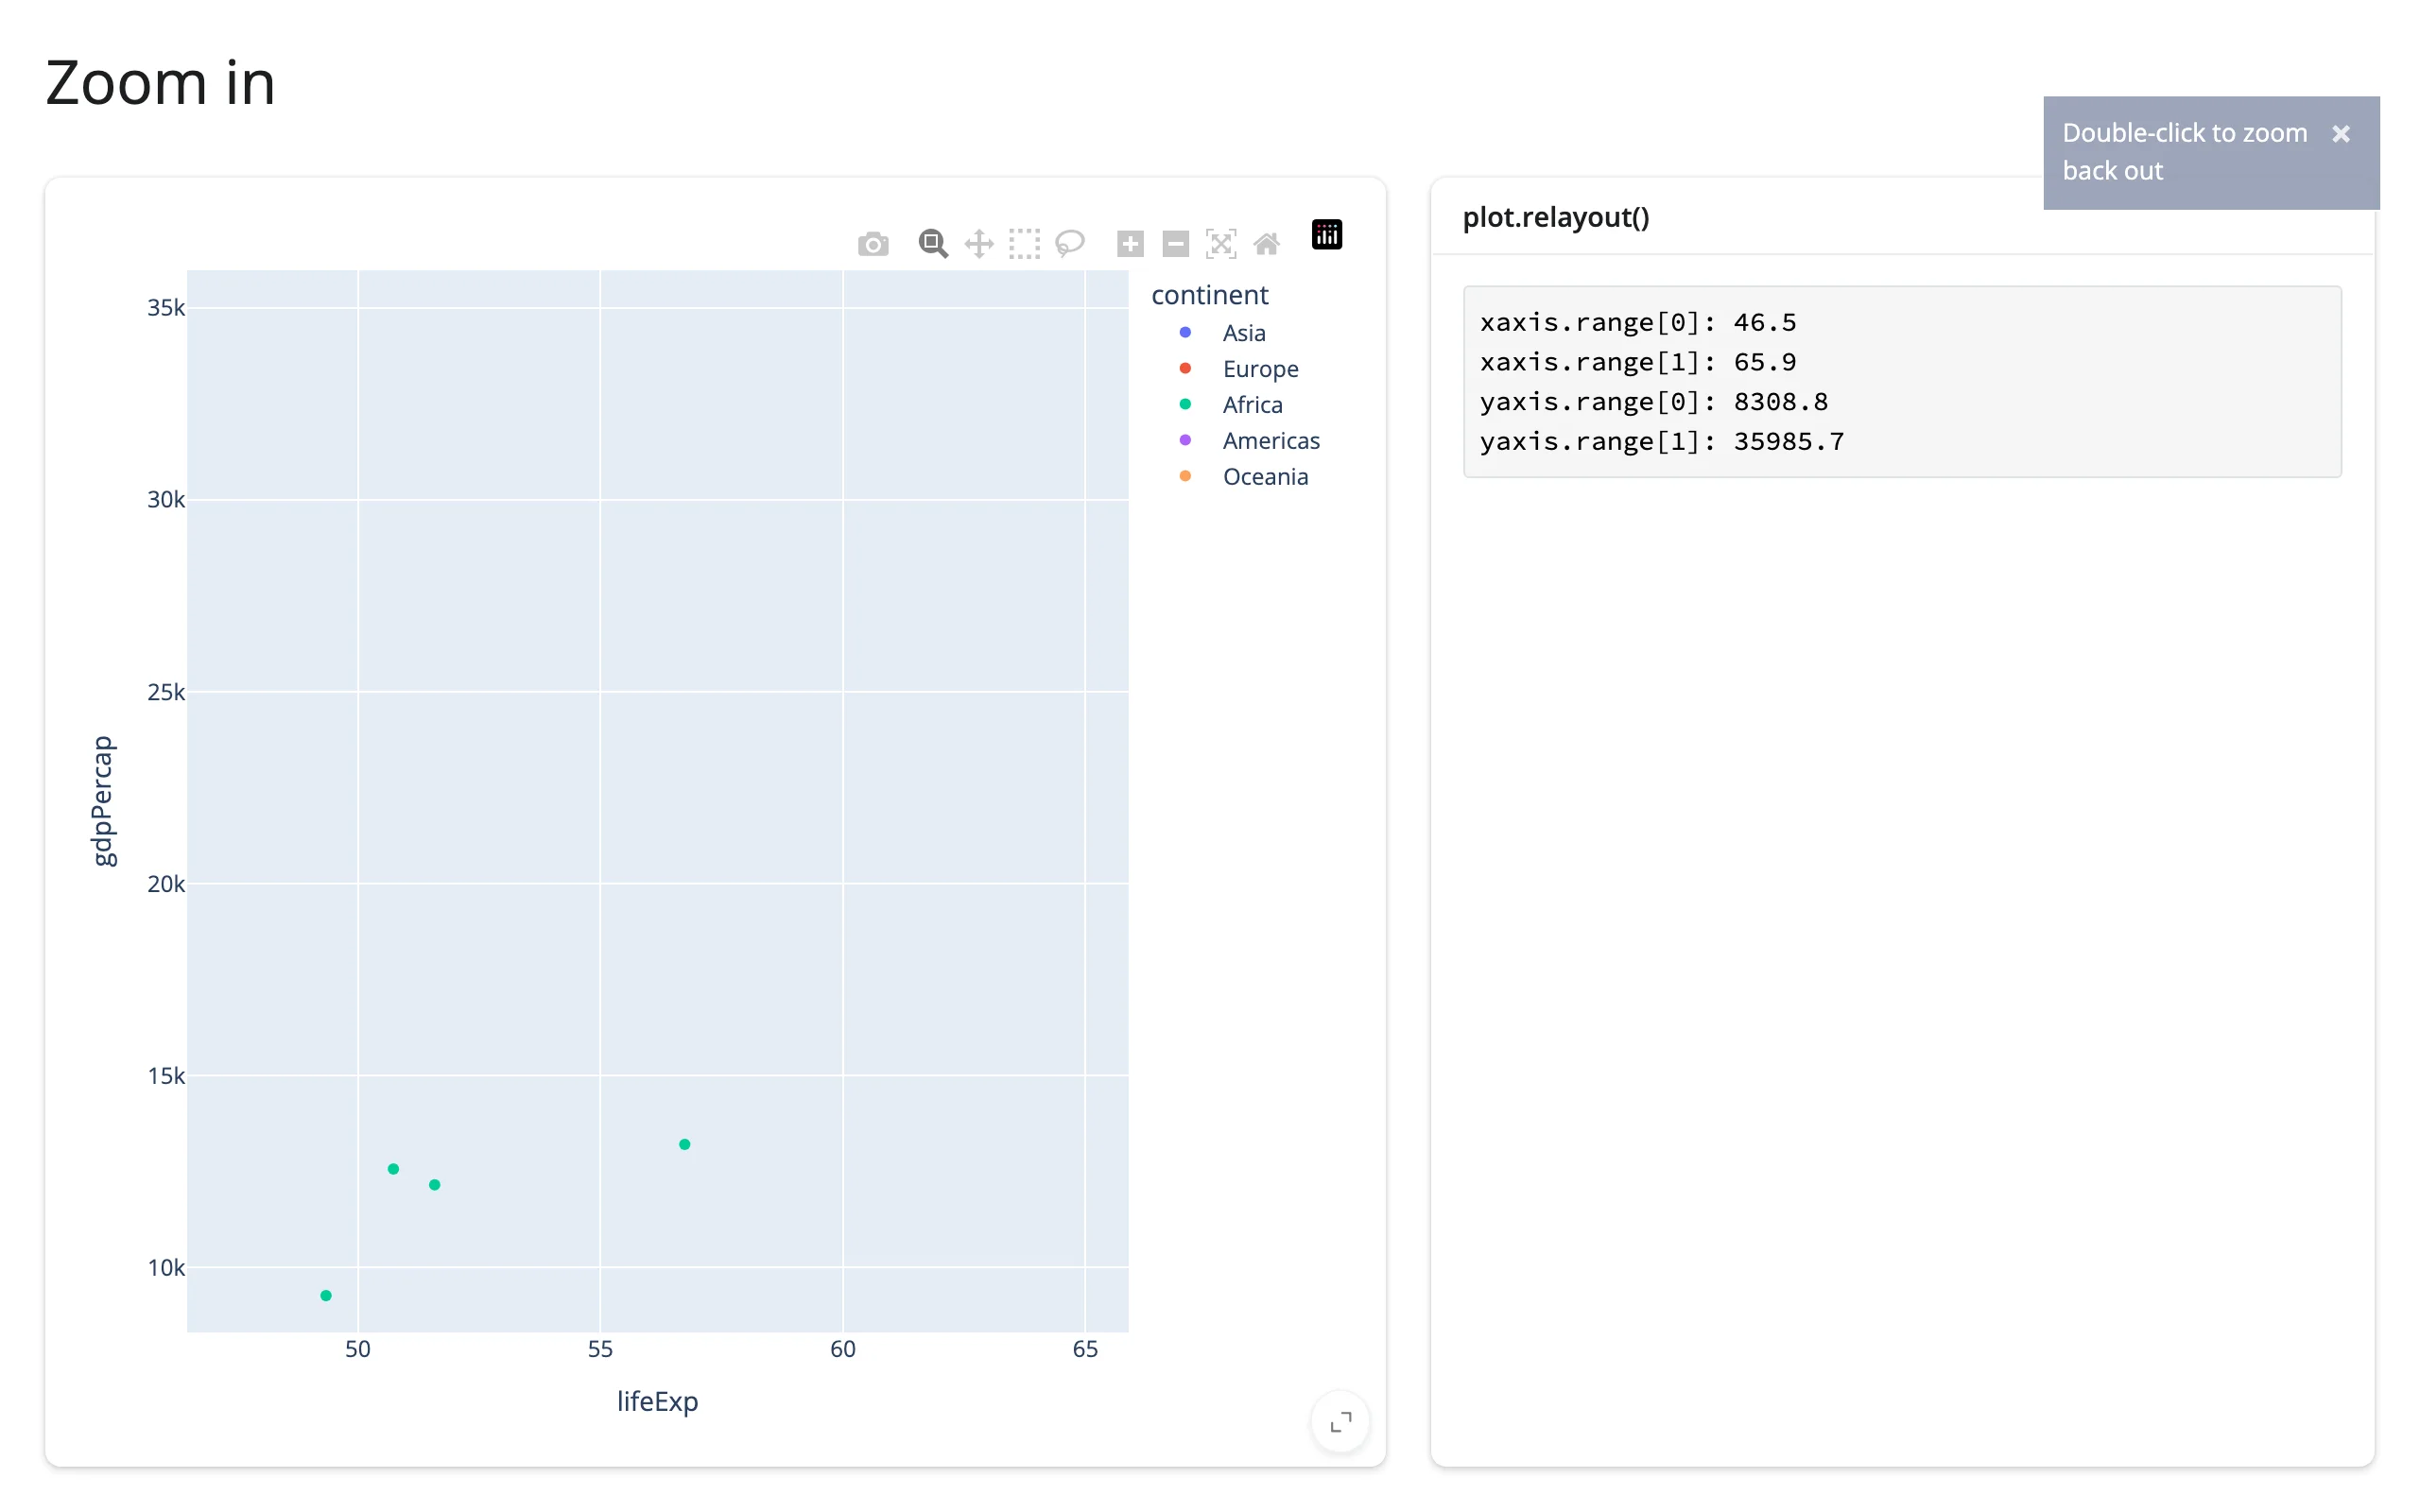
A double-click reset reports {"xaxis.autorange": True, "yaxis.autorange": True}, not the new numeric range – treat autorange: True as “back to full extent” rather than reading stale range values.
On a log axis, relayout()’s range values are log10 of the data (e.g. 2.8 for gdpPercap≈630), because that’s what plotly.js reports natively – unlike brushed()’s region, which is always in data units. If you filter data with a relayout() range from a log axis, apply 10 ** value first.
relayout() is kept across a re-render, not re-seeded – R plotly’s event_data("plotly_relayout") behaves the same way. Its payload is a delta (only the keys the gesture changed), so after a re-render it may describe axis ranges on a figure that no longer exists; read plot.widget.layout for the displayed figure’s current ranges (relayout() is a good trigger for that read, since plotly.py keeps .widget.layout synced to every zoom and pan).
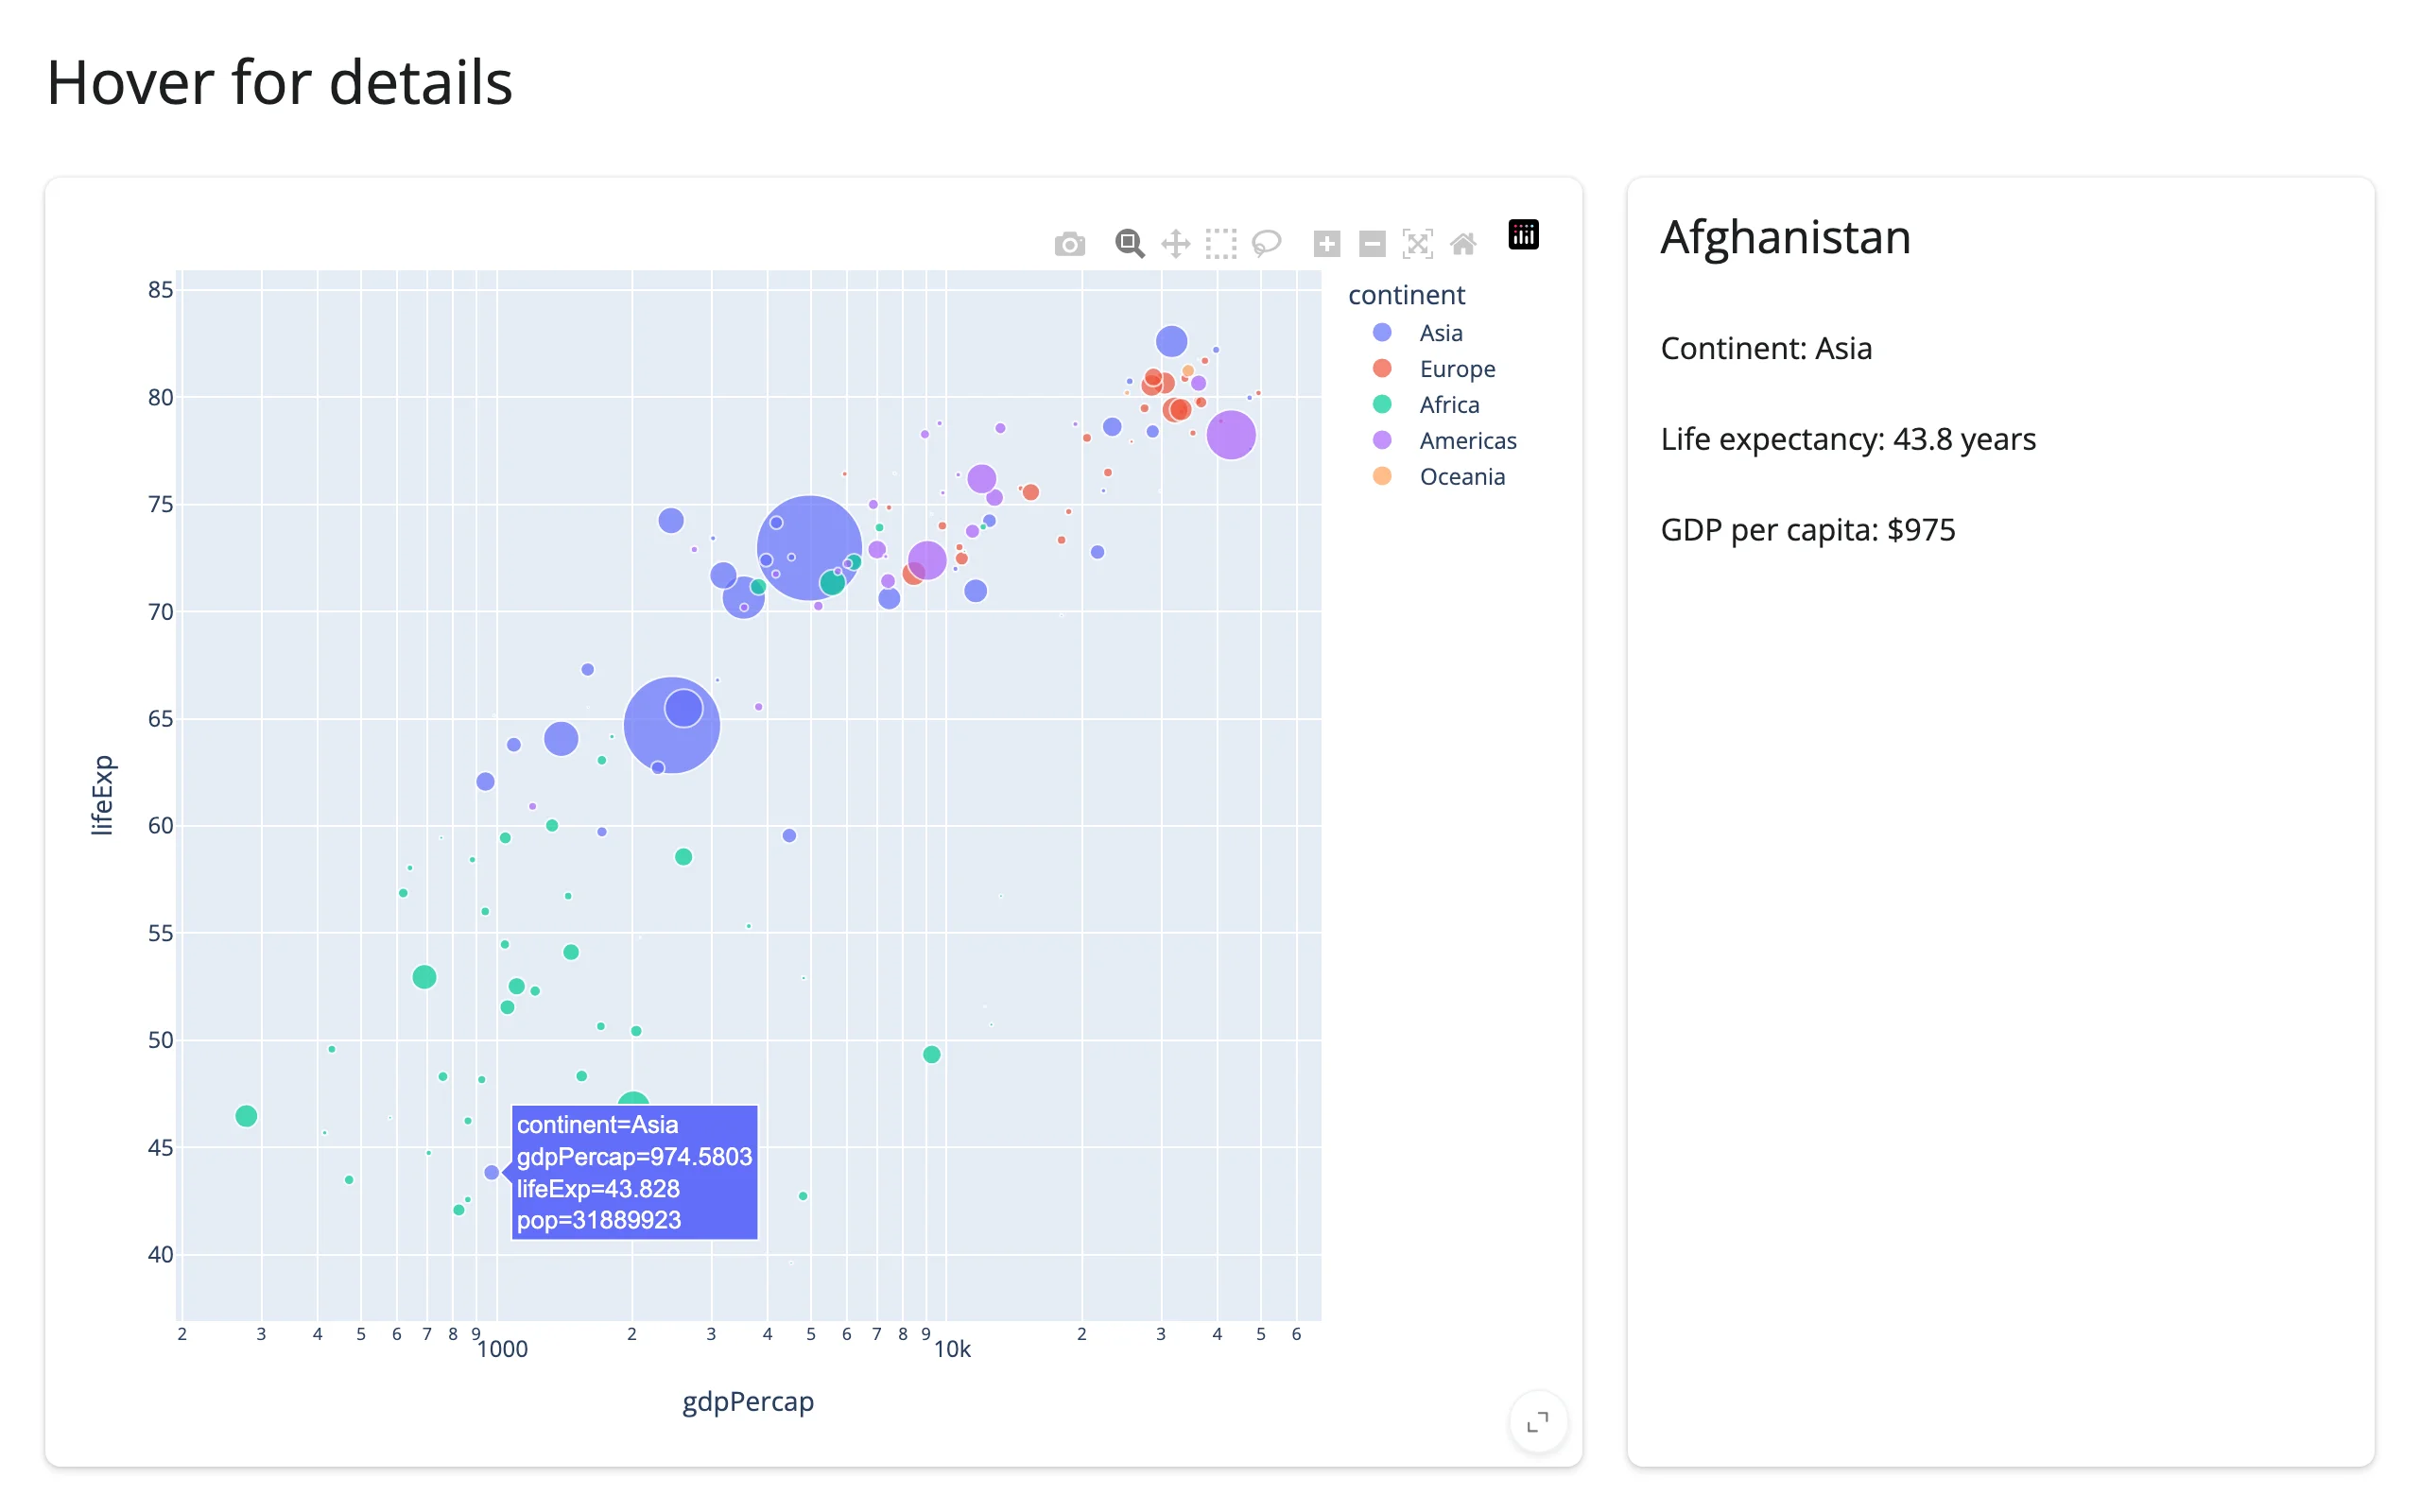
hover()
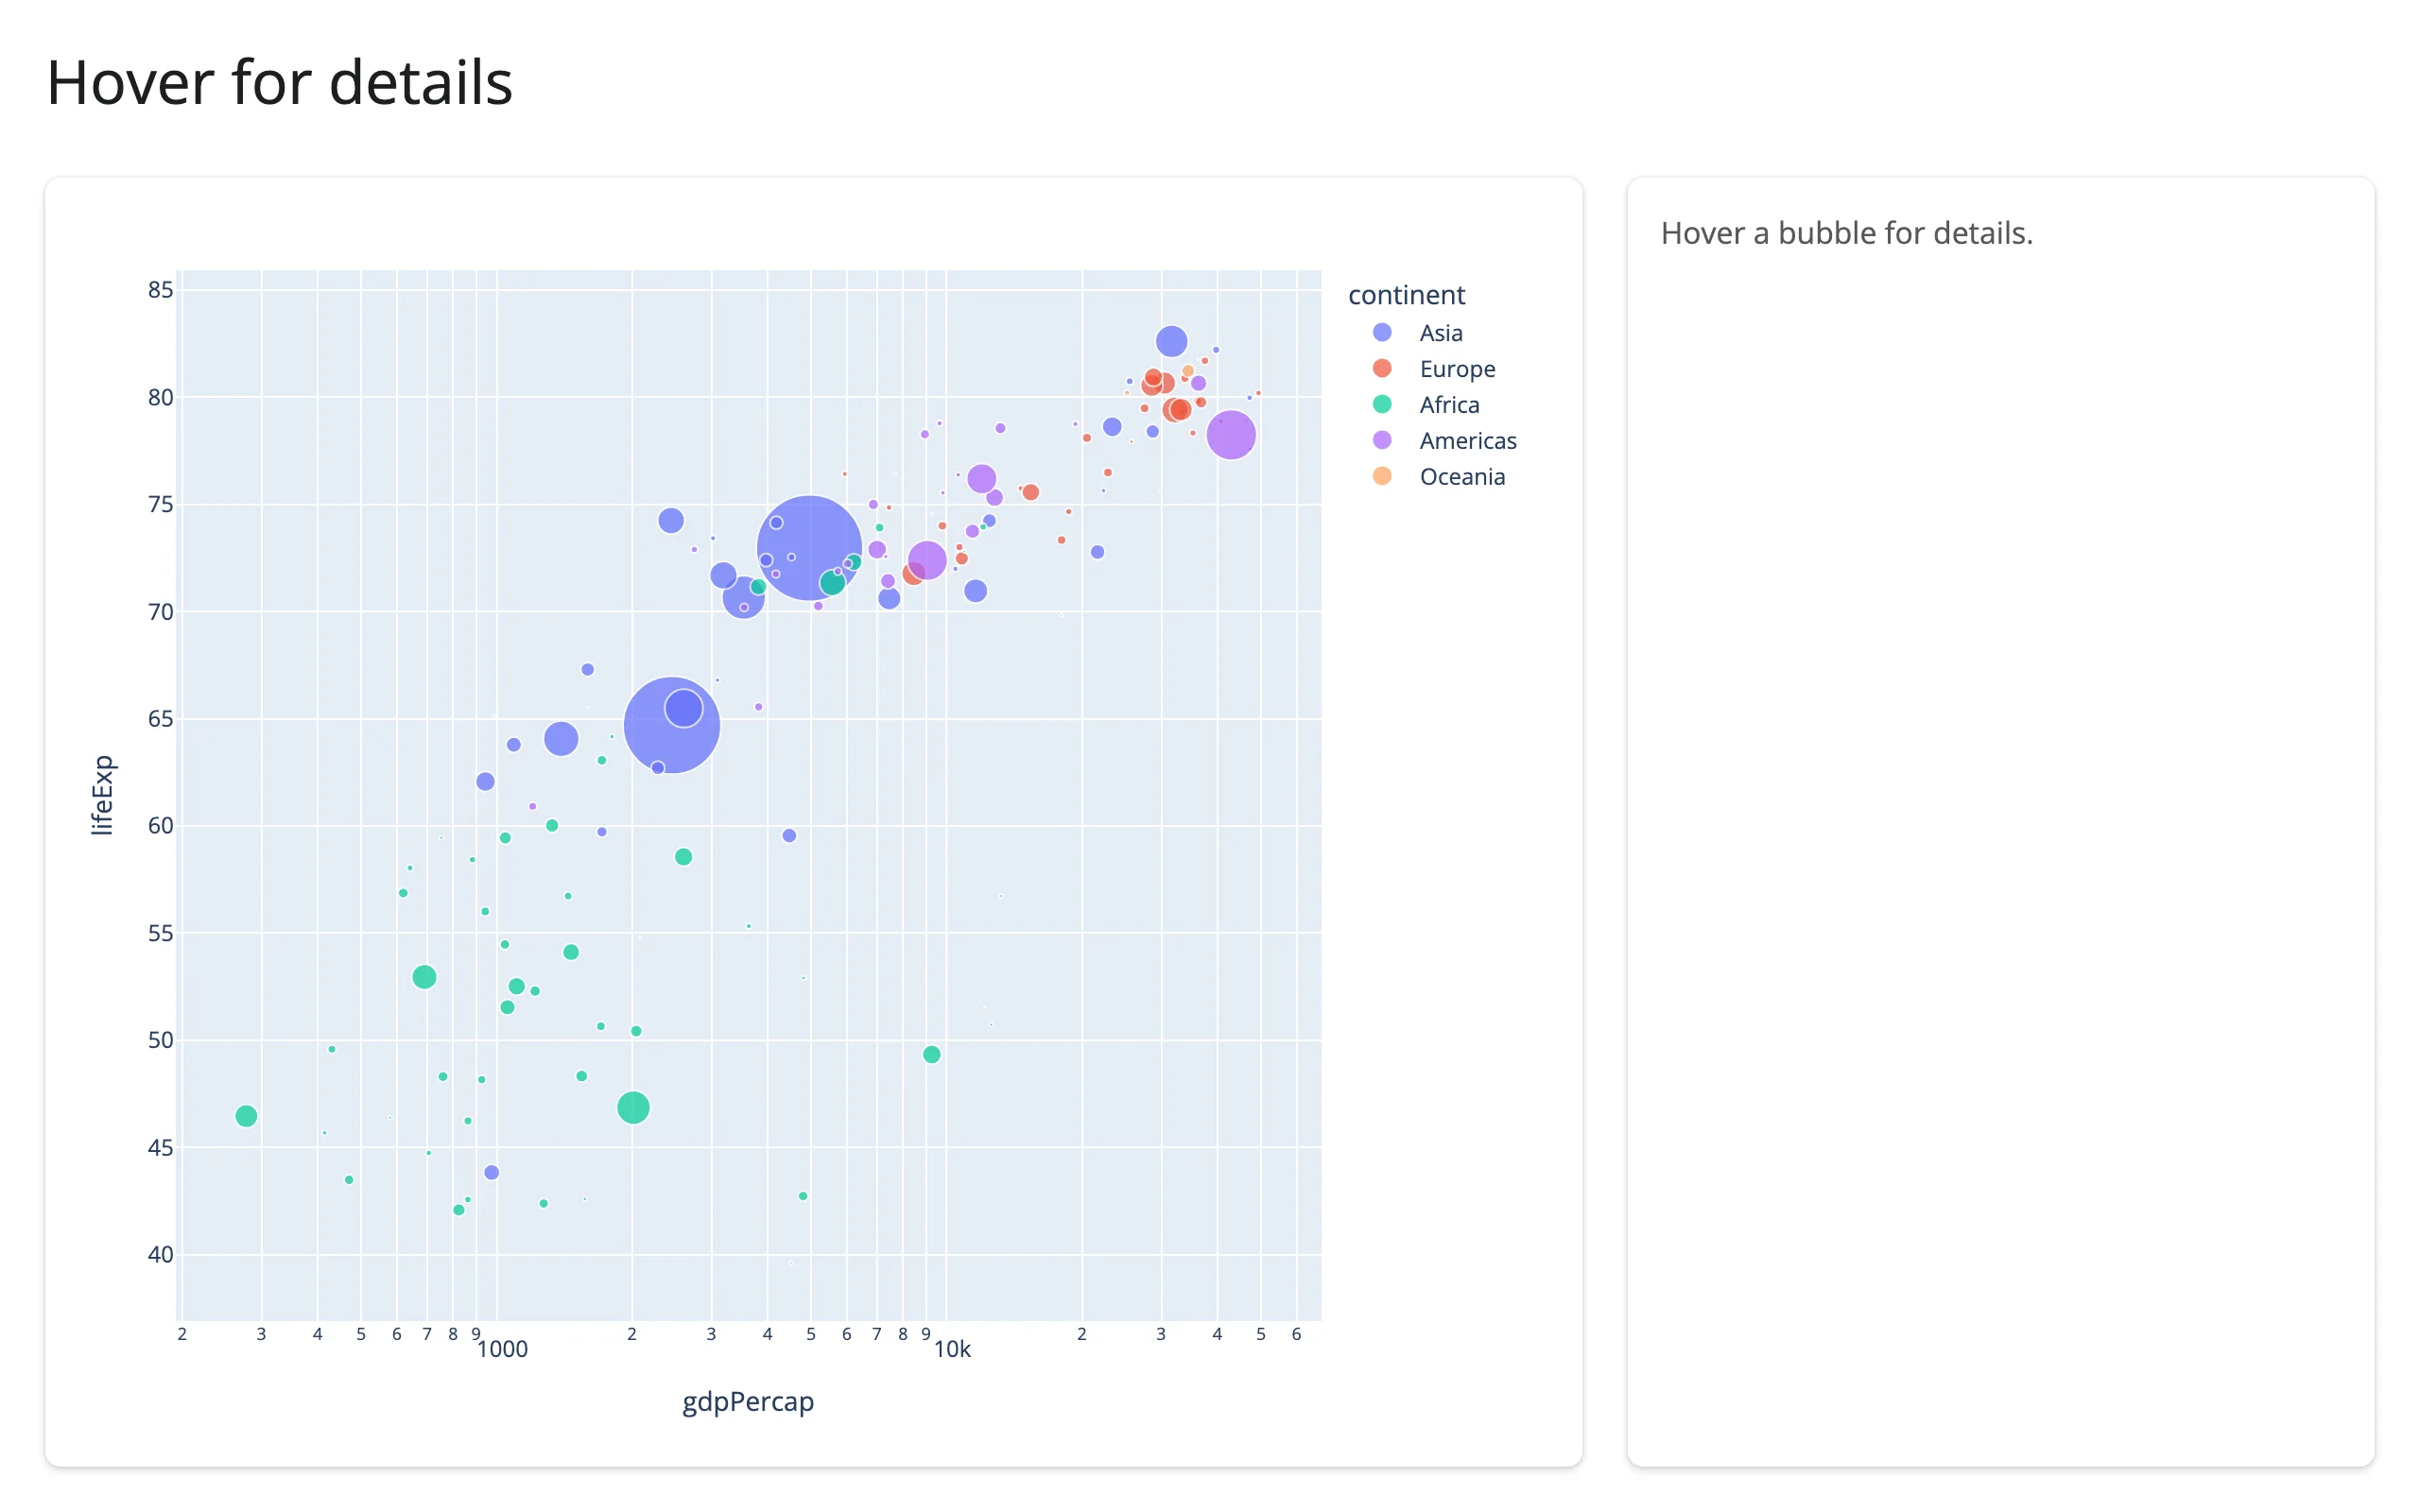
Same columns as clicked(), but fires continuously as the mouse moves over points and clears to None when it leaves them – debounced 250 ms by default, so a reader updates once the mouse settles rather than on every pixel of movement. A natural fit for a detail card that previews a point without requiring a click:
import plotly.express as px
from shiny.express import render, ui
from shinywidgets import render_plotly

df = px.data.gapminder().query("year == 2007").reset_index(drop=True)

ui.page_opts(title="Hover for details", fillable=True)

with ui.layout_columns(col_widths=[8, 4]):
    with ui.card(full_screen=True):

        @render_plotly
        def plot():
            return px.scatter(
                df,
                x="gdpPercap",
                y="lifeExp",
                color="continent",
                log_x=True,
                size="pop",
                size_max=40,
                custom_data=[df.index],
            )

    with ui.card():

        @render.ui
        def detail():
            pts = plot.hover()
            if pts is None:
                return ui.p("Hover a bubble for details.", class_="text-muted")
            row = df.loc[pts["customdata"].iloc[0][0]]
            return ui.TagList(
                ui.h4(row["country"]),
                ui.p(f"Continent: {row['continent']}"),
                ui.p(f"Life expectancy: {row['lifeExp']:.1f} years"),
                ui.p(f"GDP per capita: ${row['gdpPercap']:,.0f}"),
            )
Before hovering, and hovering Afghanistan:
double_clicked()
A pulse, not a state: None until the first double-click, then True, re-firing readers on every later double-click even though the value itself stays True. It’s the general “the user reset the view” signal – useful because clicked() clearing to None on the same gesture only tells that accessor’s own readers, not a different widget that also needs to react.
import plotly.express as px
import plotly.graph_objects as go
from shiny import reactive, req
from shiny.express import ui
from shinywidgets import render_plotly

df = px.data.gapminder().query("year == 2007").reset_index(drop=True)
top15 = df.nlargest(15, "pop").sort_values("pop")

ui.page_opts(title="Click a bubble, double-click to reset", fillable=True)

with ui.layout_columns(col_widths=[7, 5]):
    with ui.card(full_screen=True):

        @render_plotly
        def scatter():
            return px.scatter(
                df,
                x="gdpPercap",
                y="lifeExp",
                color="continent",
                log_x=True,
                custom_data=[df.index],
            )

    with ui.card(full_screen=True):

        @render_plotly
        def bars():
            fig = go.Figure(go.Bar(x=top15["pop"], y=top15["country"], orientation="h"))
            fig.update_traces(marker_color="lightgray")
            return fig


@reactive.effect
def _highlight():
    pts = scatter.clicked()
    req(pts is not None)
    country = df.loc[pts["customdata"].iloc[0][0], "country"]
    with bars.widget.batch_update():
        for trace in bars.widget.data:
            trace.marker.color = [
                "#1f77b4" if c == country else "lightgray" for c in top15["country"]
            ]


# clicked() already clears itself on a background double-click, but that only
# resets scatter's own reader. double_clicked() is the general "the user
# reset the view" pulse -- reach for it when a *different* widget needs to
# react to a reset, including on subplot types (mapbox, ternary) where
# relayout()'s axis-range filter never reports one.
@reactive.effect
def _reset_bars():
    req(scatter.double_clicked())
    with reactive.isolate(), bars.widget.batch_update():
        for trace in bars.widget.data:
            trace.marker.color = "lightgray"
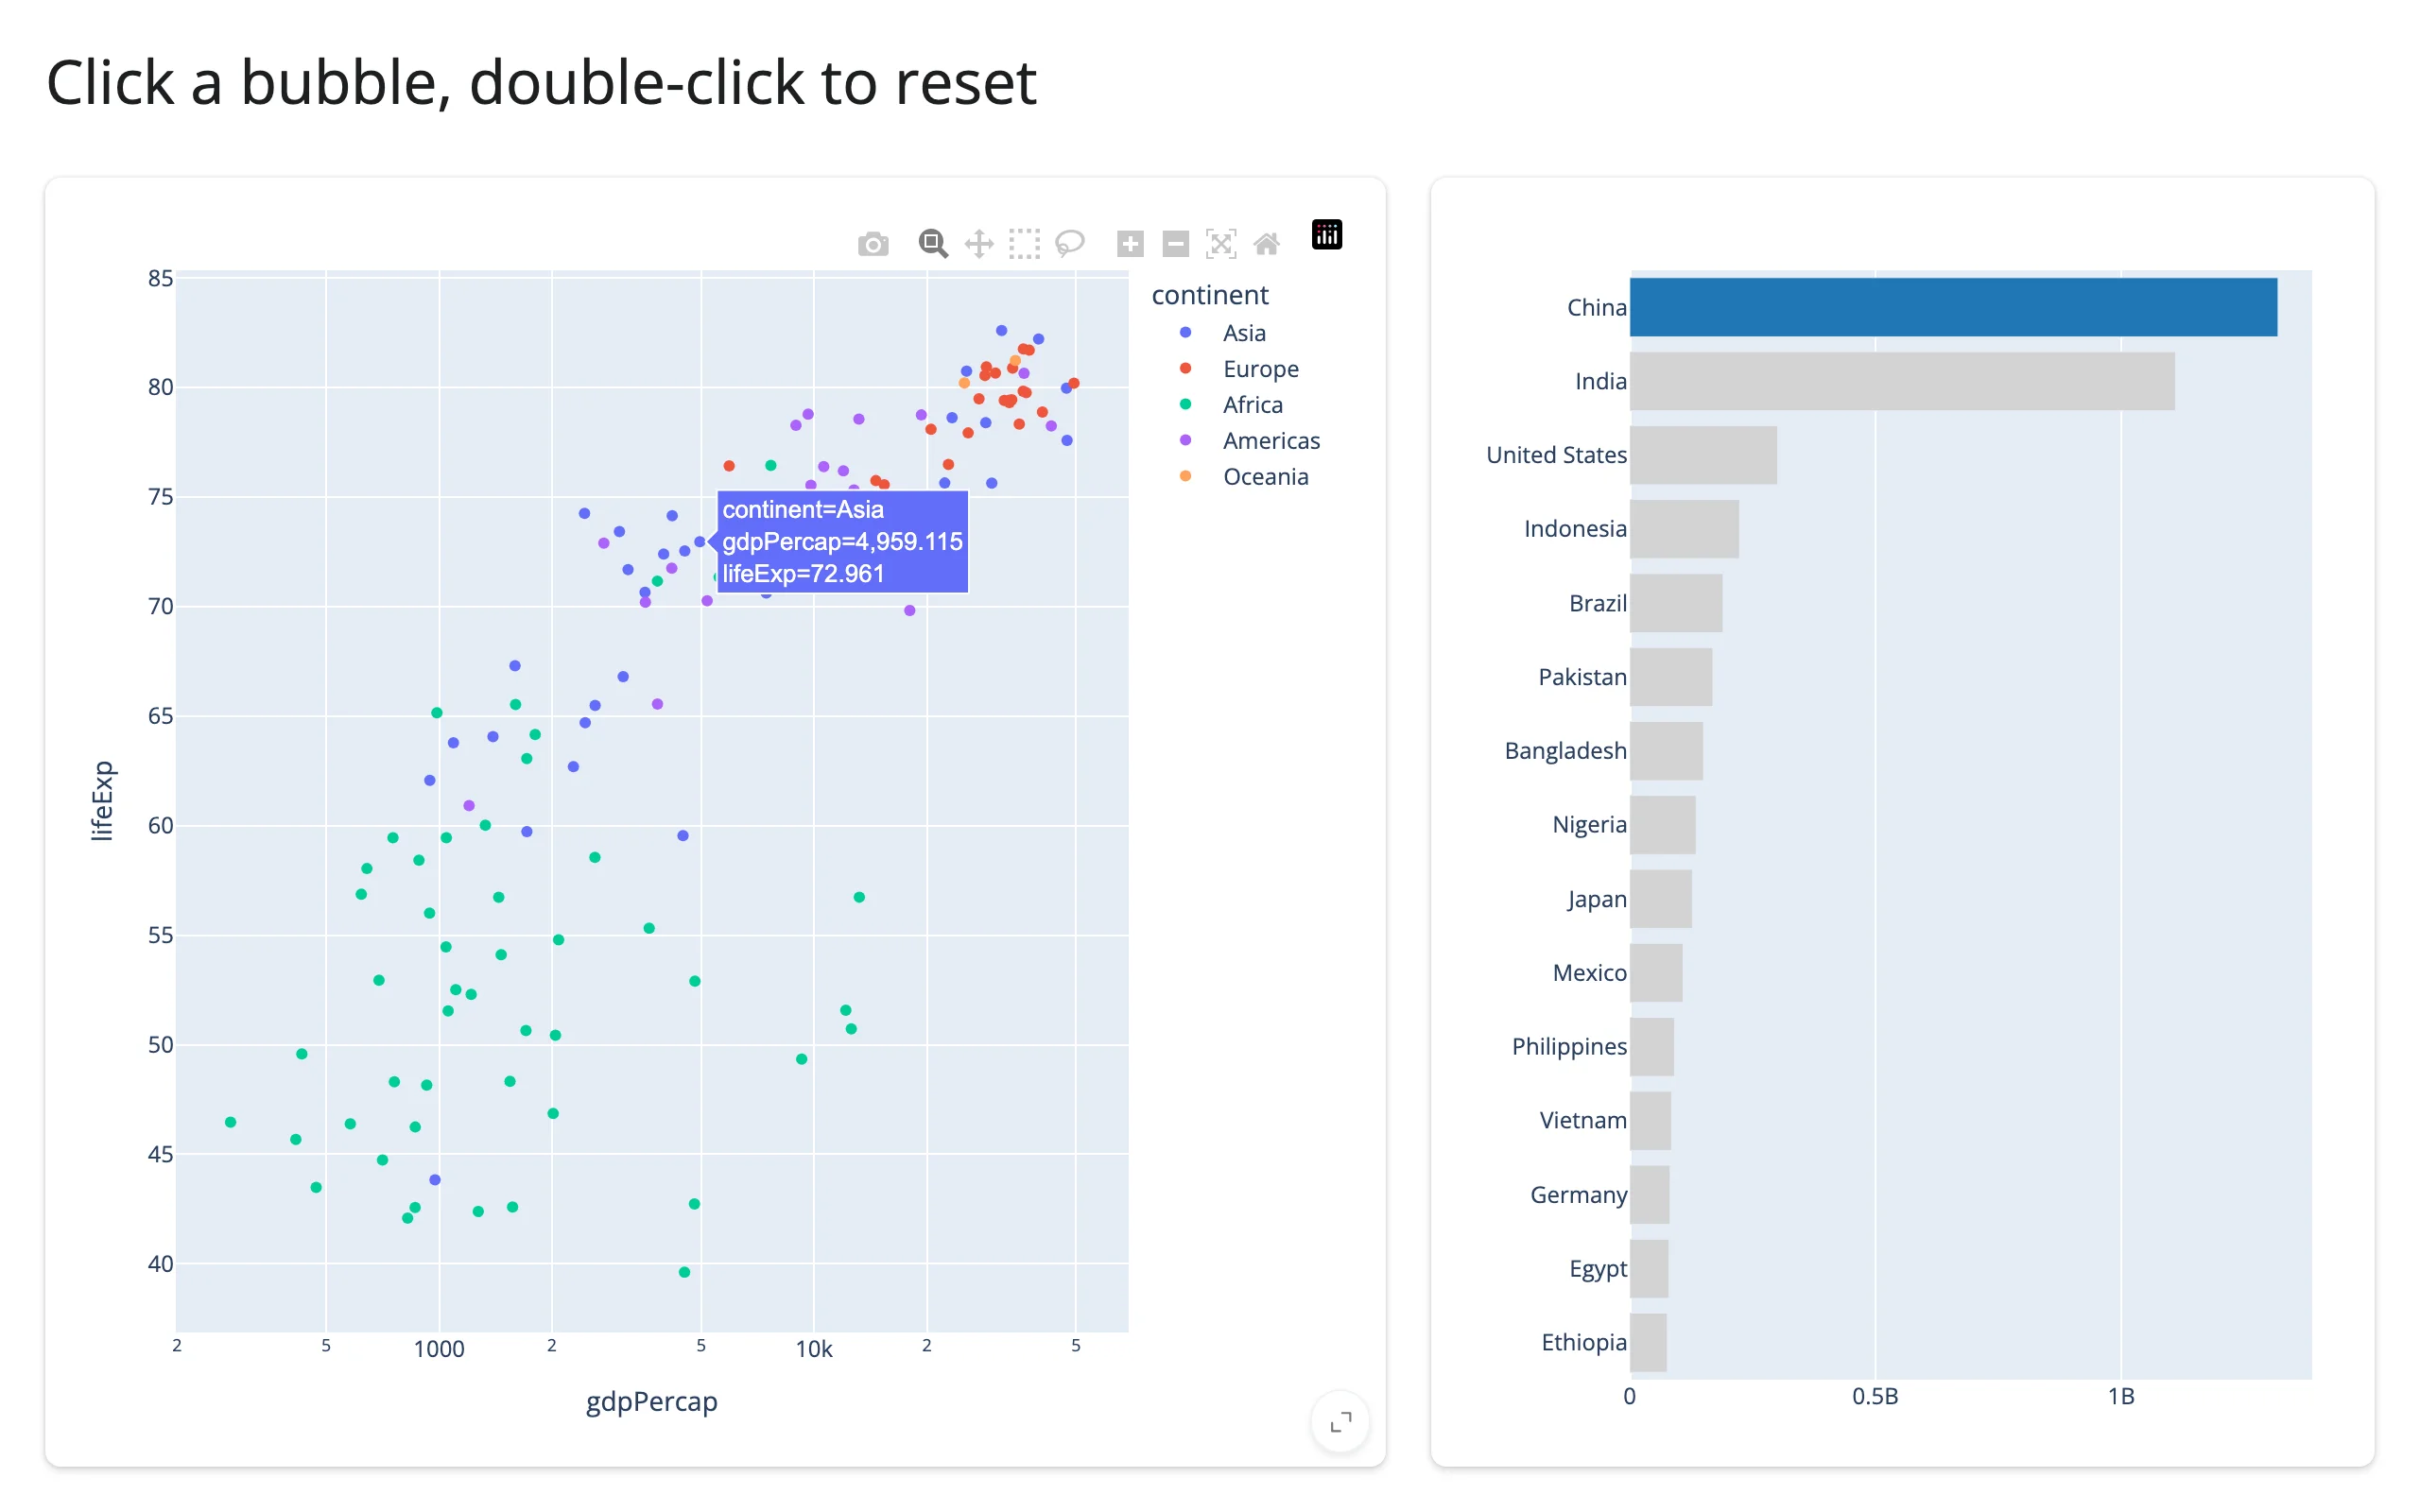
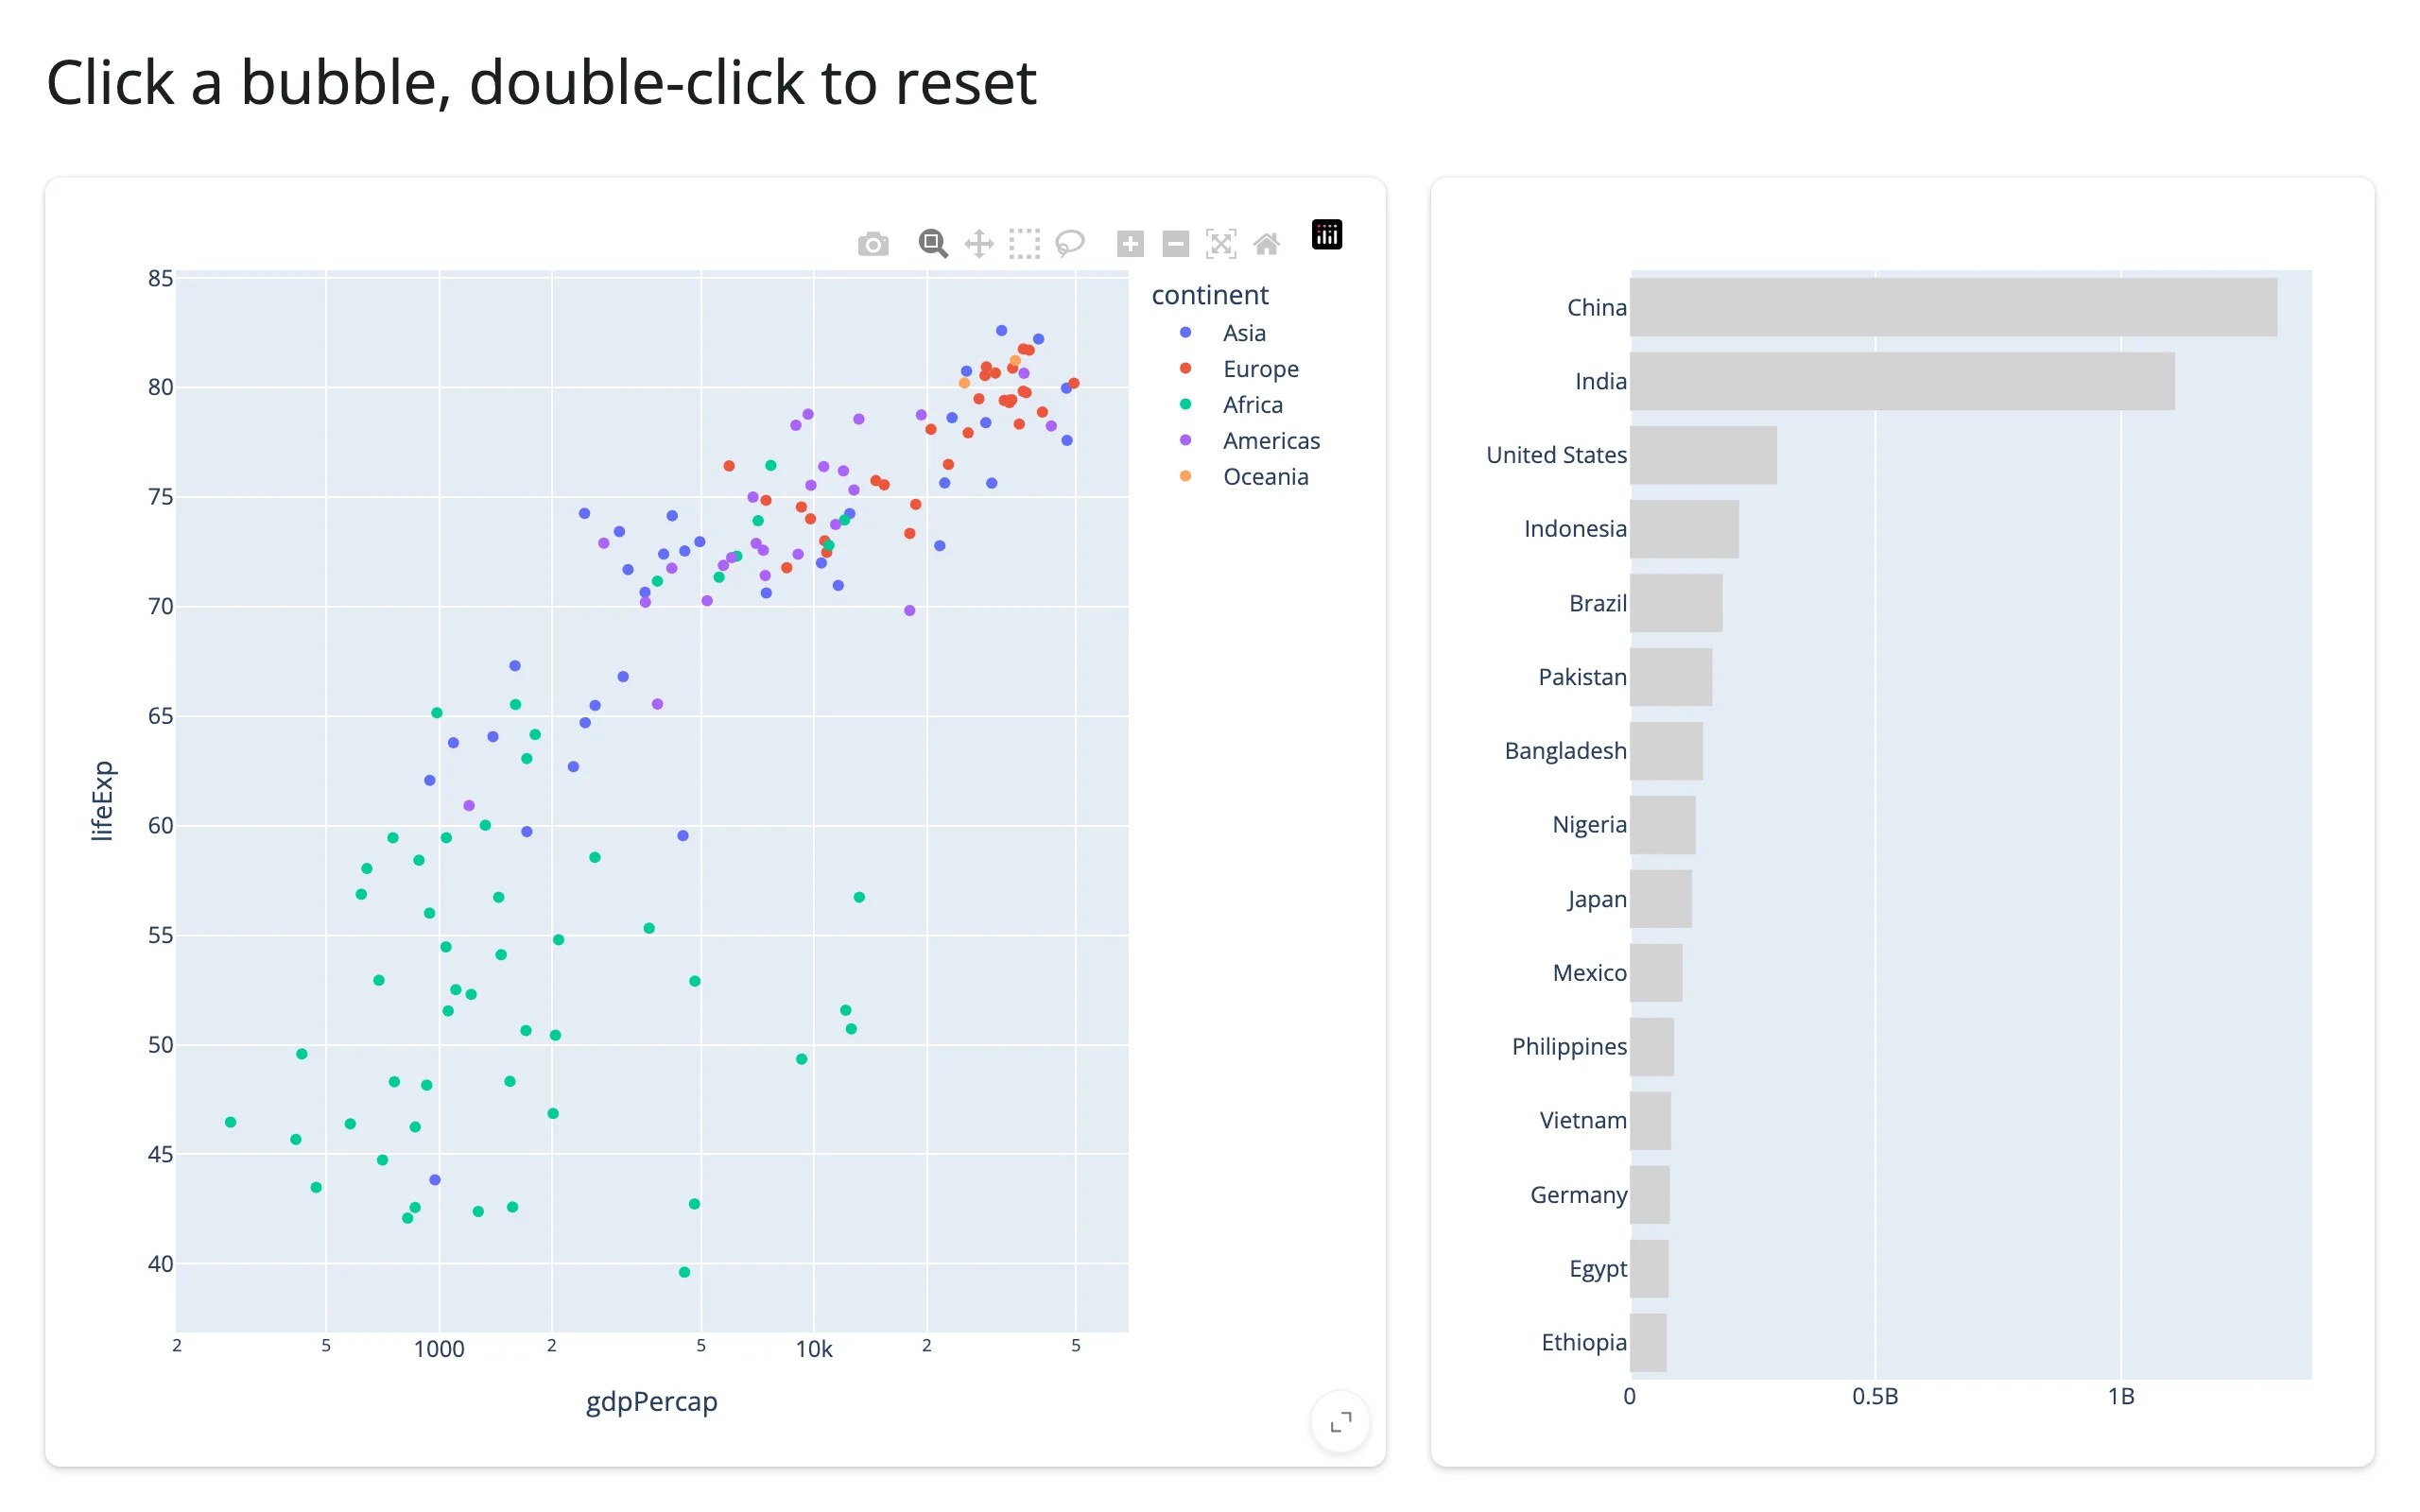
Click a bubble to highlight its bar, then double-click the background to reset it:
Verified on current main: double-clicking a cartesian plot’s background (as above) fires double_clicked(), as does double-clicking a scattermap/mapbox-family or ternary chart – the subplot types the docstring calls out as needing this accessor, since their view reset (map center/zoom, ternary axis extents) doesn’t match relayout()’s xaxis/yaxis filter. The exception, called out in the docstring, is 3D: on the plotly 6.9.0 bundled here, double-clicking a scatter_3d scene’s background does not fire plotly_doubleclick at all (confirmed with a direct JS listener; the gesture just registers as two tiny camera-orbit relayout events), so a 3D view reset isn’t observable this way.
legend_clicked() and visible_traces()
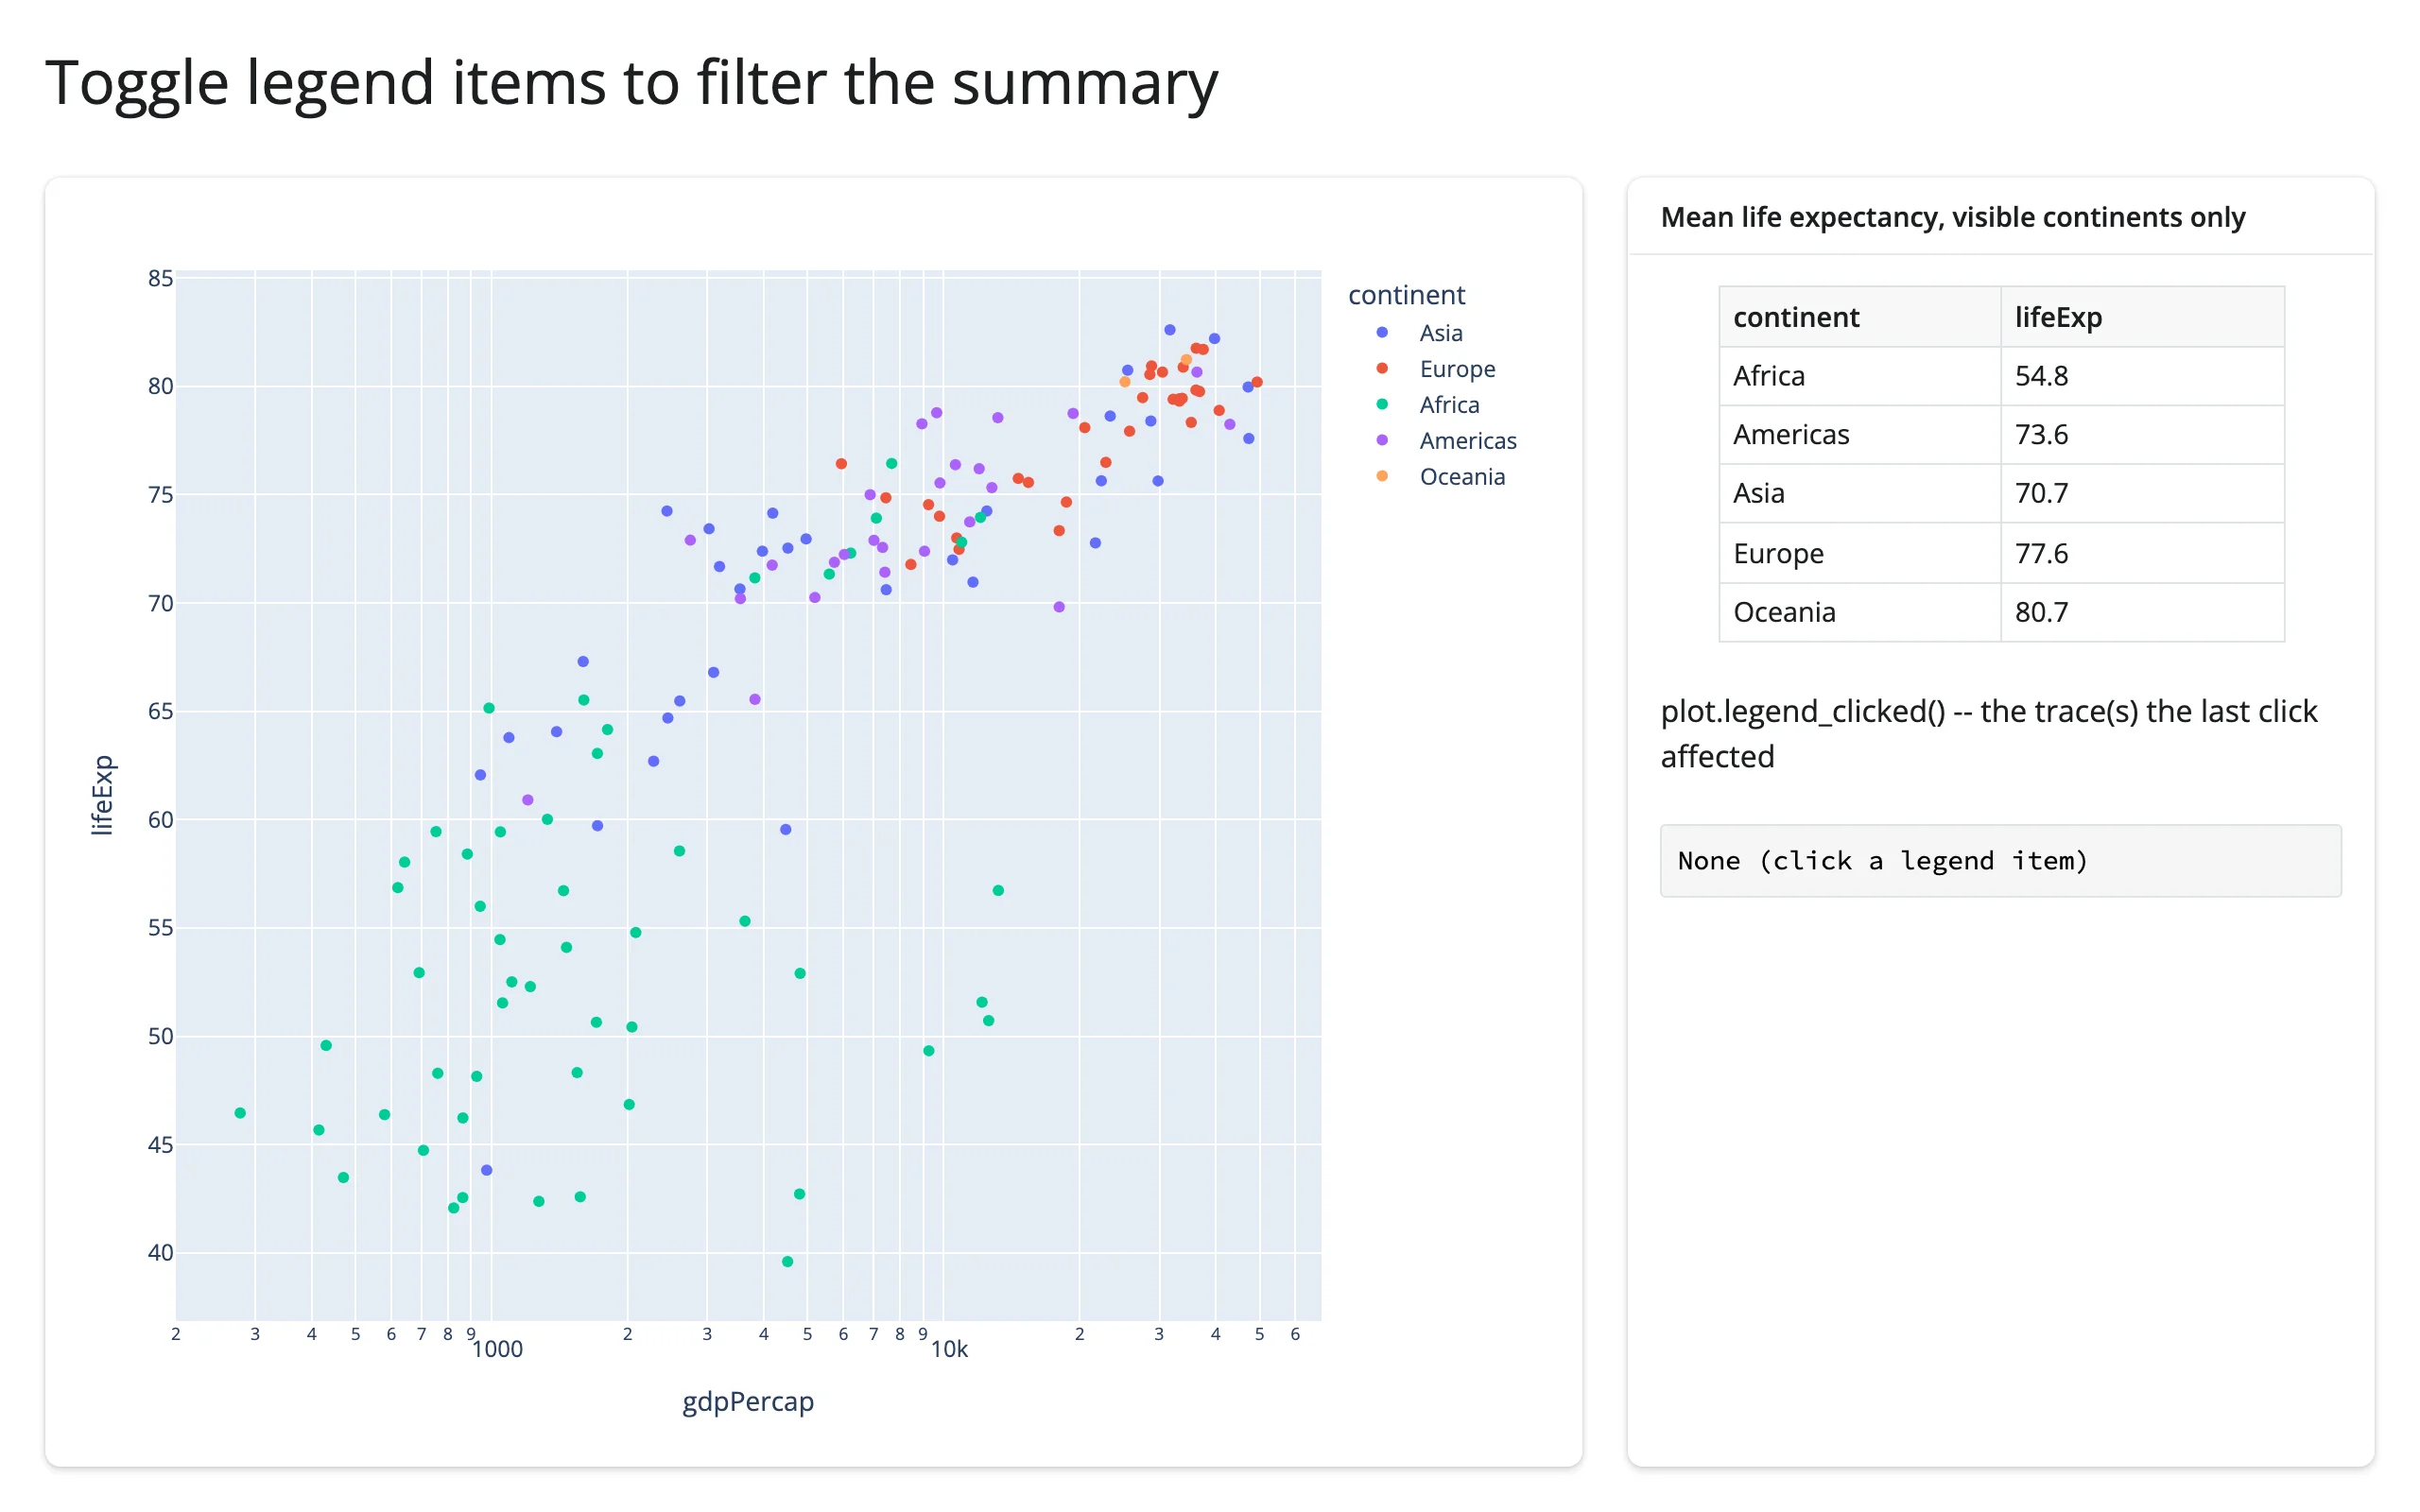
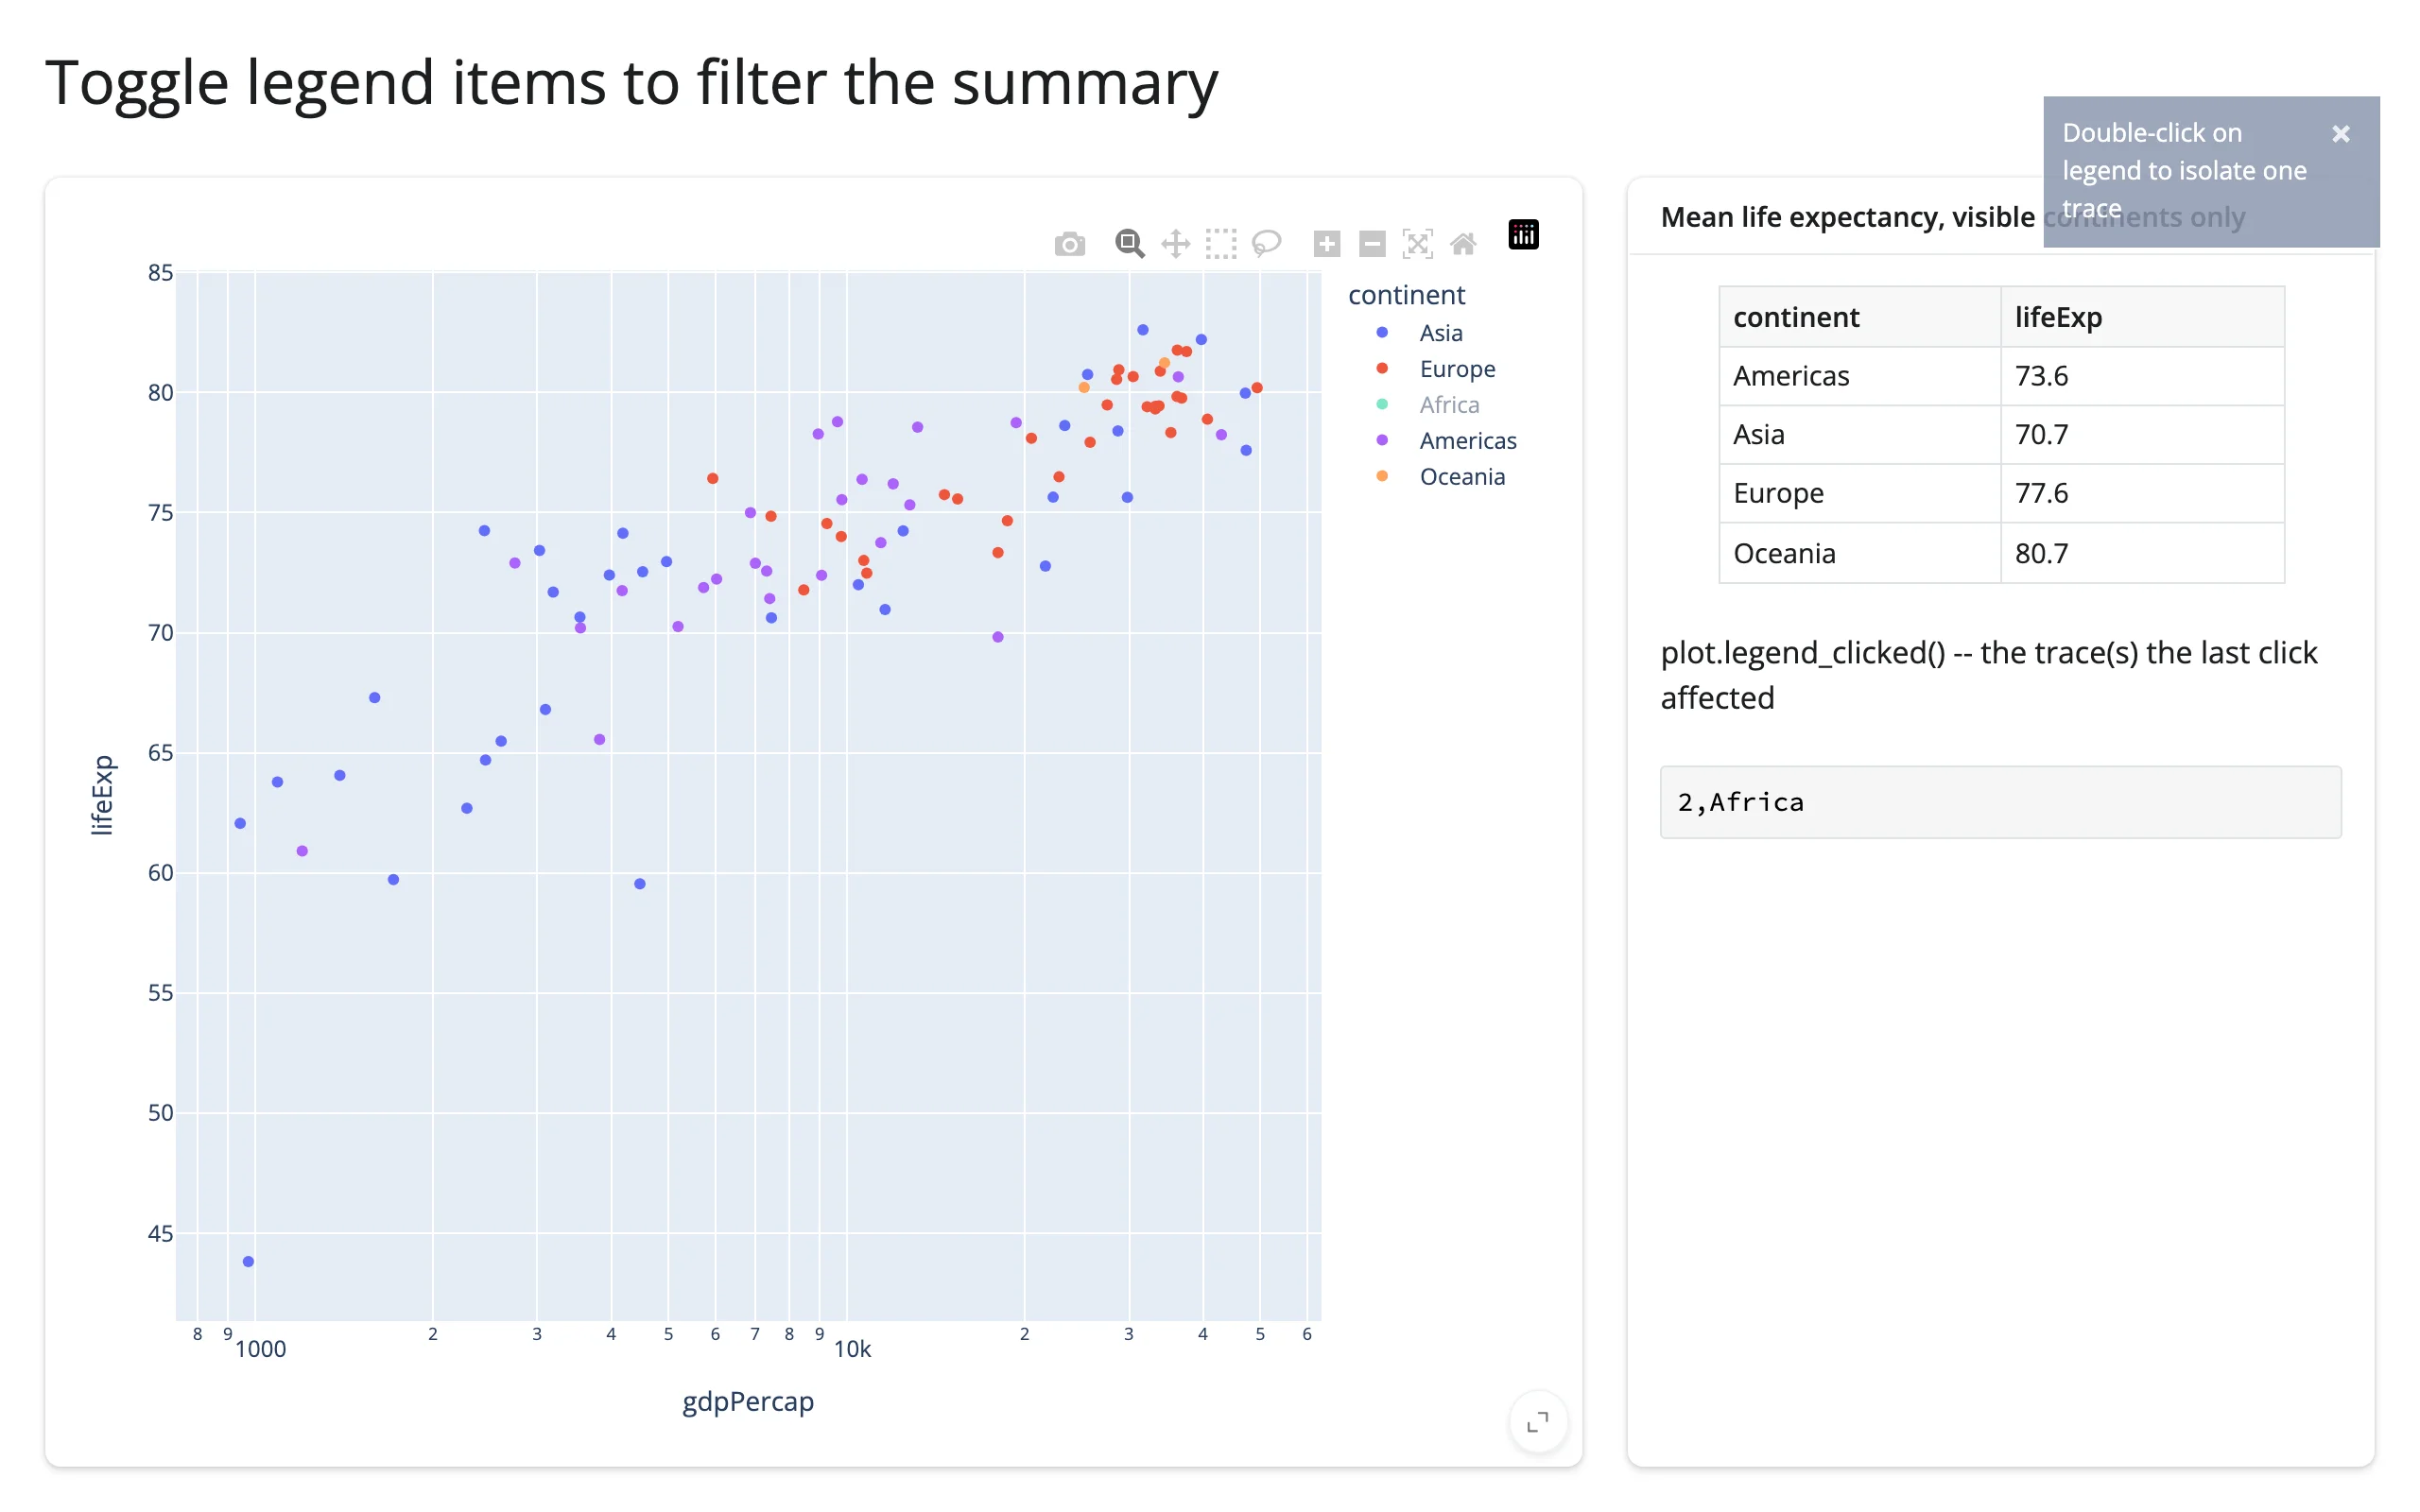
legend_clicked() reports the trace(s) affected by the most recent legend click: the clicked trace first, then its legendgroup mates if the click toggled the whole group. visible_traces() reports the current visibility of every trace – seeded from the figure as drawn, then updated after every legend click, double-click-to-isolate, or .widget visibility change (update_traces(visible=...), add_trace, delete_traces). Reach for visible_traces() to answer “what’s on screen right now,” rather than trying to derive it by replaying every legend_clicked() event yourself:
import plotly.express as px
from shiny import req
from shiny.express import render, ui
from shinywidgets import render_plotly

df = px.data.gapminder().query("year == 2007").reset_index(drop=True)

ui.page_opts(title="Toggle legend items to filter the summary", fillable=True)

with ui.layout_columns(col_widths=[8, 4]):
    with ui.card(full_screen=True):

        @render_plotly
        def plot():
            return px.scatter(df, x="gdpPercap", y="lifeExp", color="continent", log_x=True)

    with ui.card():
        ui.card_header("Mean life expectancy, visible continents only")

        @render.data_frame
        def summary():
            vis = plot.visible_traces()
            # None until the browser reports the seed just after first draw
            req(vis is not None)
            shown = set(vis.loc[vis["visible"], "name"])
            subset = df[df["continent"].isin(shown)]
            agg = subset.groupby("continent", as_index=False)["lifeExp"].mean().round(1)
            return render.DataGrid(agg)

        "plot.legend_clicked() -- the trace(s) the last click affected"

        @render.code
        def last_click():
            traces = plot.legend_clicked()
            if traces is None:
                return "None (click a legend item)"
            return ";".join(f"{r.trace_index},{r.name}" for r in traces.itertuples())
Click “Africa” in the legend to hide it: legend_clicked() reports 2,Africa (its trace index and name) and the summary table drops that row:
selected_rows(df, key=None)
Plotly reports points of the plot (trace index + position within the trace); selected_rows() turns that into rows of your data frame by matching each point’s customdata – so the figure must carry one:
- pandas, no
key:custom_data=[df.index]carries each row’s index label. Matches are done againstdf.index, so this is safe even ifdfis filtered or sorted relative to the frame the figure was built from. - Any frame (including polars), with
key:custom_data=["some_column"]pluskey="some_column"matches that column’s values. Pick an id column, or add one withdf.with_row_index("id").
Calling it without customdata on the figure raises a clear ValueError pointing at custom_data=. It returns an empty frame (not None) while nothing is selected, so you can pass it straight to @render.data_frame.
Pandas, matched by index:
import plotly.express as px
from shiny.express import render, ui
from shinywidgets import render_plotly

df = px.data.gapminder().query("year == 2007").reset_index(drop=True)

ui.page_opts(title="Lasso-select countries", fillable=True)

with ui.layout_columns(col_widths=[7, 5]):
    with ui.card(full_screen=True):

        @render_plotly
        def plot():
            fig = px.scatter(
                df,
                x="gdpPercap",
                y="lifeExp",
                color="continent",
                log_x=True,
                custom_data=[df.index],
            )
            fig.update_layout(dragmode="lasso")
            return fig

    with ui.card(full_screen=True):
        ui.card_header("plot.selected_rows(df)")

        @render.data_frame
        def rows():
            cols = ["country", "lifeExp", "gdpPercap"]
            return render.DataGrid(plot.selected_rows(df)[cols].round(1))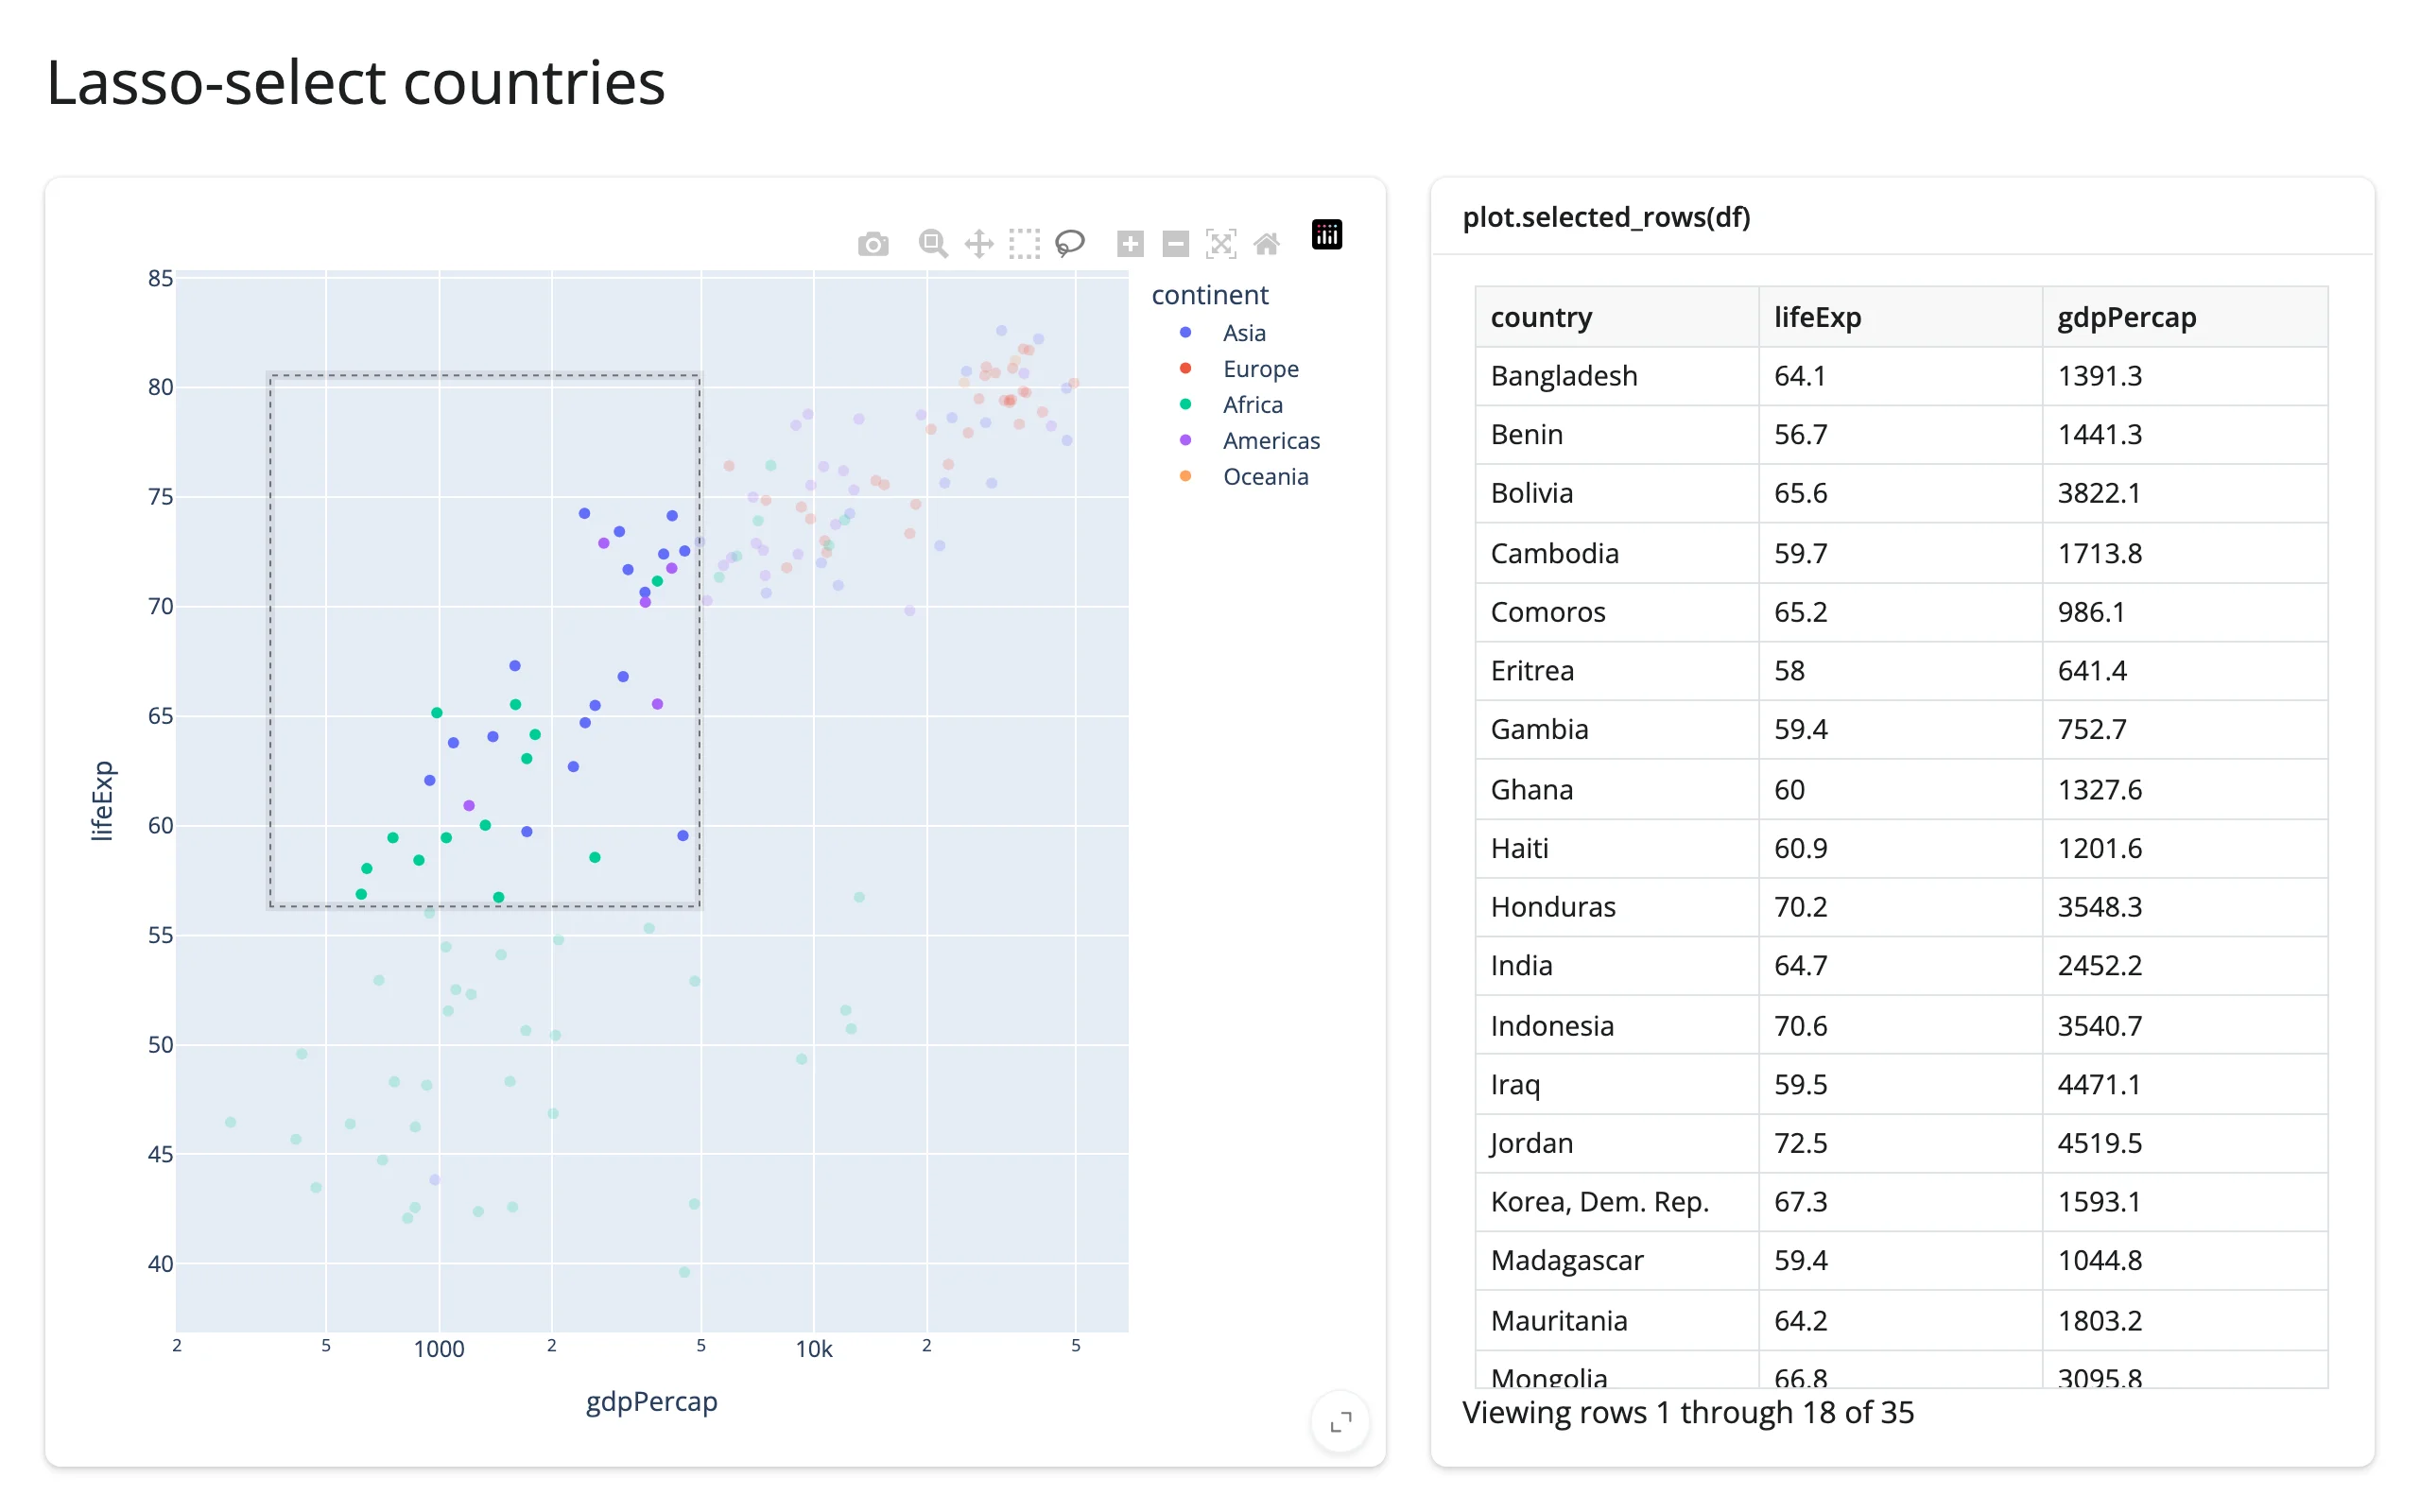
Polars, matched by a key column (here, country itself – any column with unique, stable values works):
import plotly.express as px
import polars as pl
from shiny.express import render, ui
from shinywidgets import render_plotly

pdf = px.data.gapminder().query("year == 2007")
df = pl.from_pandas(pdf[["country", "continent", "gdpPercap", "lifeExp"]])

ui.page_opts(title="Lasso-select countries (polars)", fillable=True)

with ui.layout_columns(col_widths=[7, 5]):
    with ui.card(full_screen=True):

        @render_plotly
        def plot():
            fig = px.scatter(
                df,
                x="gdpPercap",
                y="lifeExp",
                color="continent",
                log_x=True,
                custom_data=["country"],
            )
            fig.update_layout(dragmode="lasso")
            return fig

    with ui.card(full_screen=True):
        ui.card_header("plot.selected_rows(df, key='country')")

        @render.data_frame
        def rows():
            rows = plot.selected_rows(df, key="country")
            rows = rows.with_columns(pl.col("gdpPercap", "lifeExp").round(1))
            return render.DataGrid(rows.to_pandas())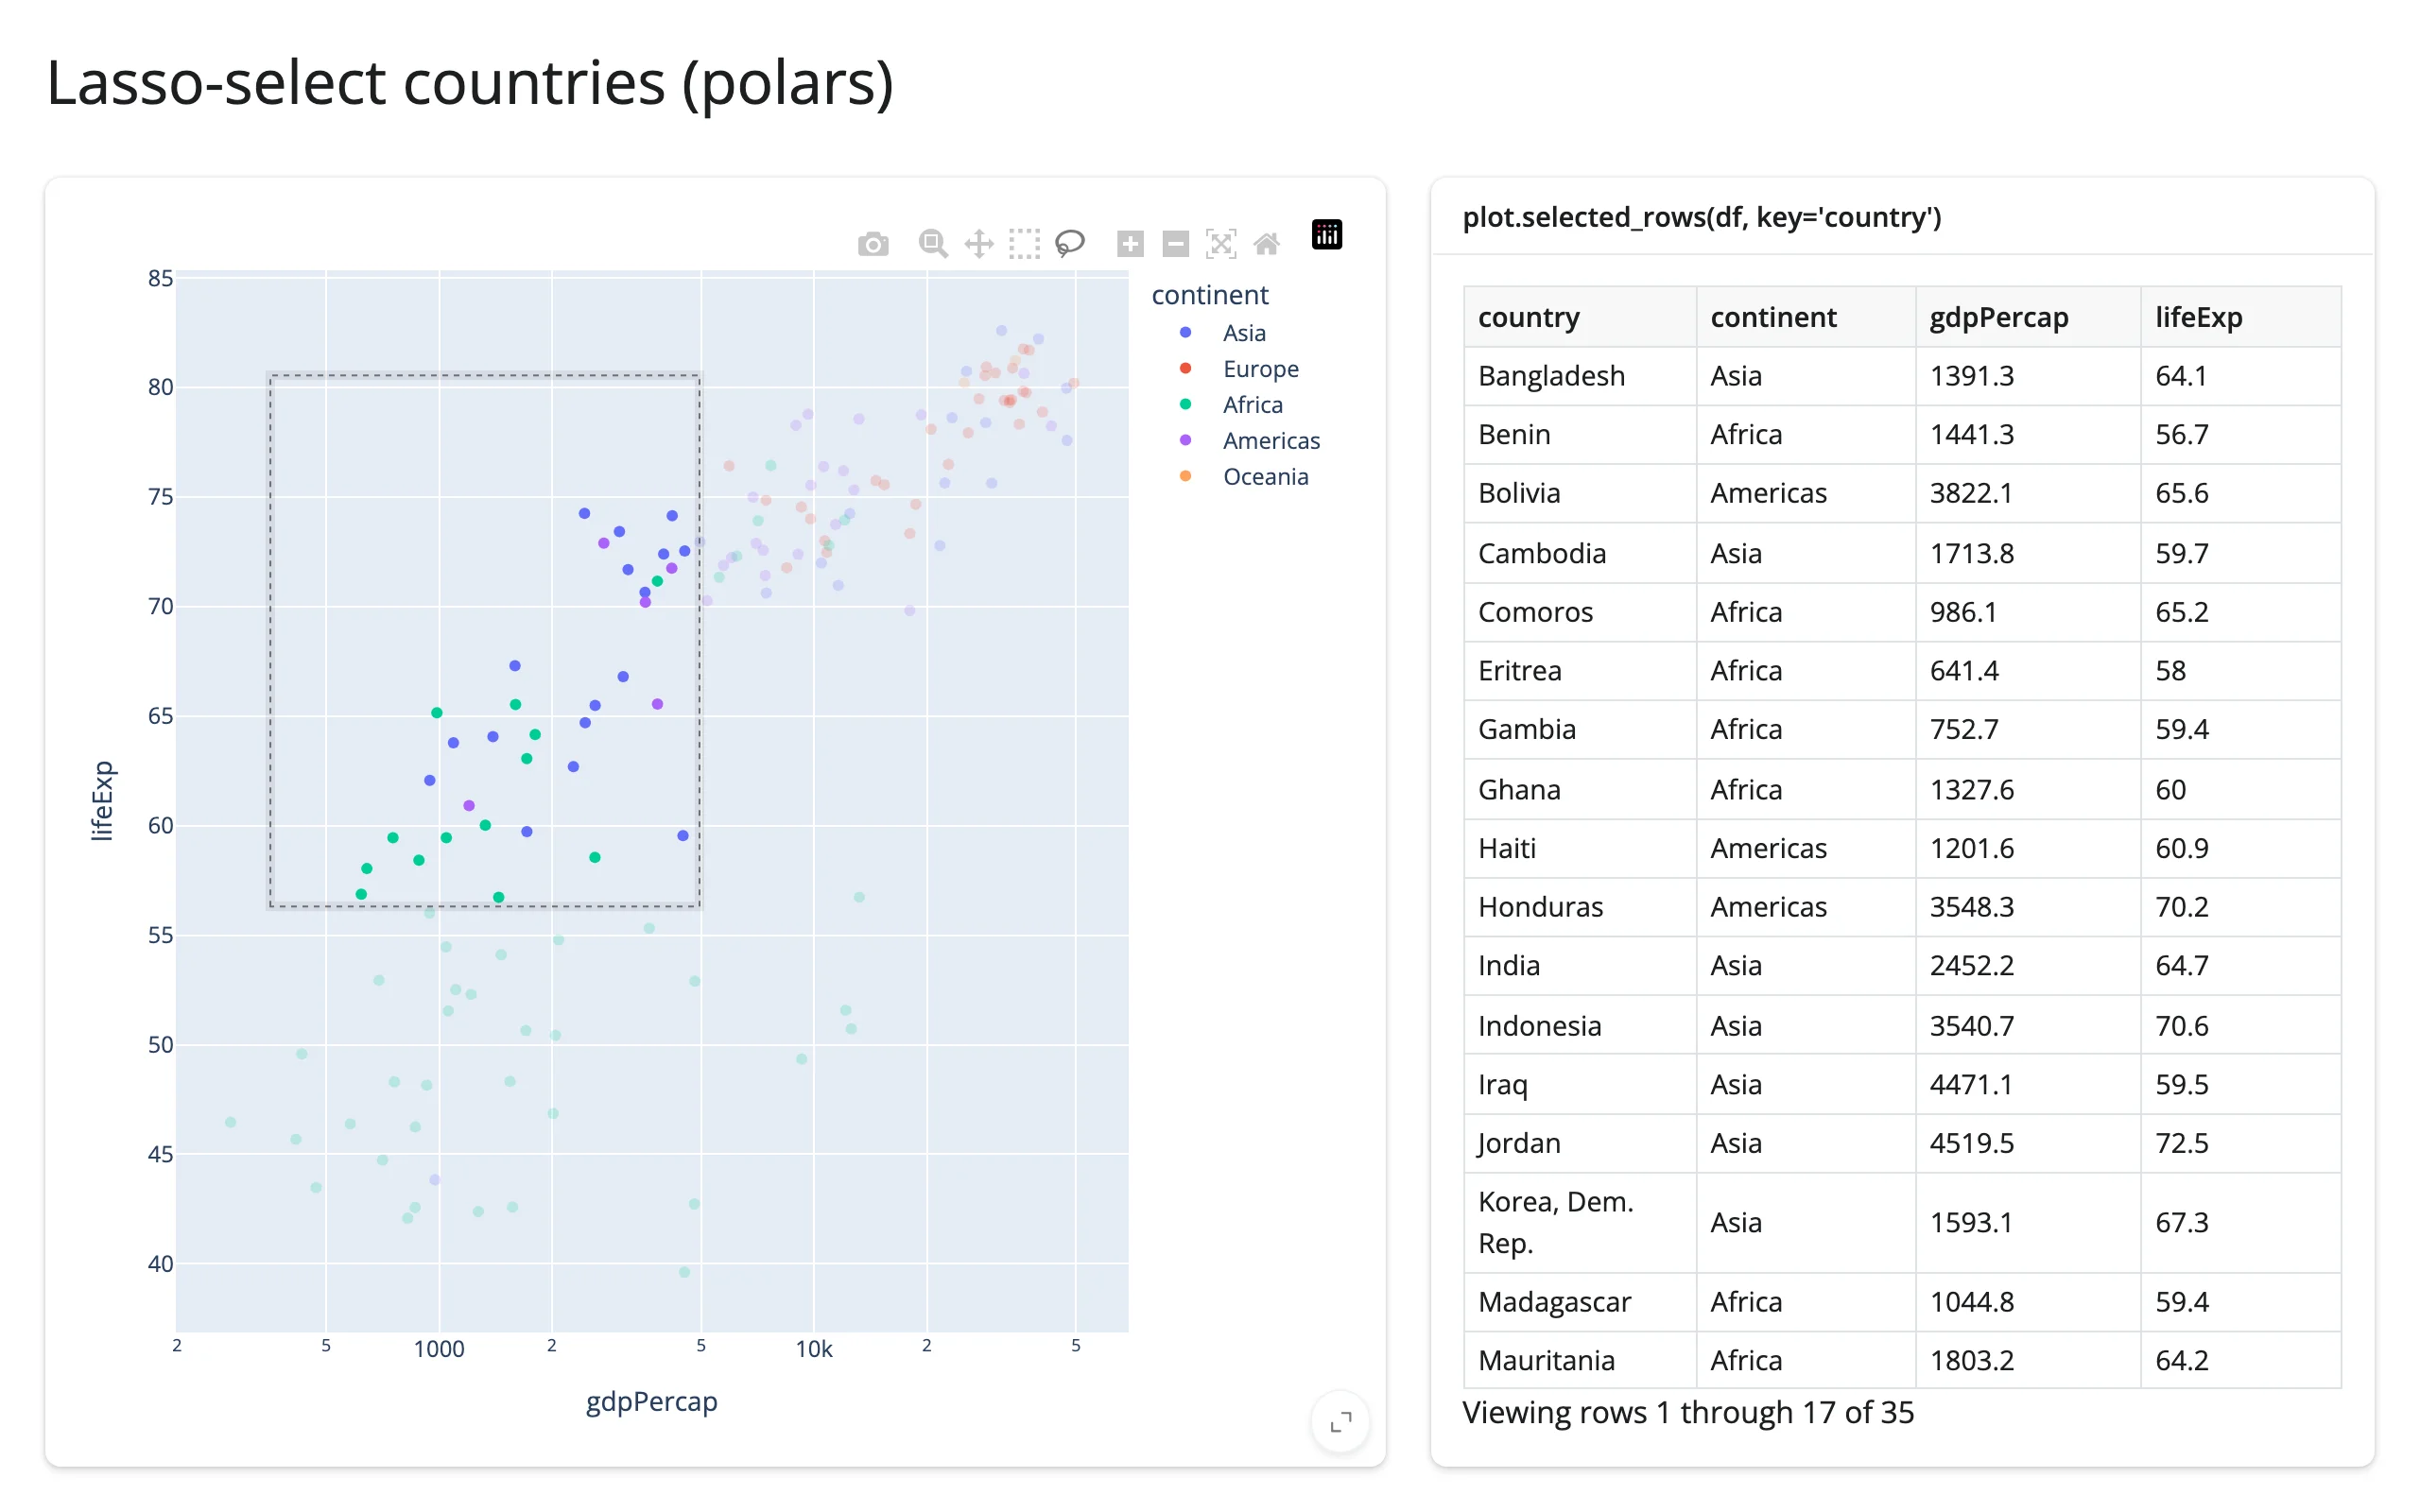
plotly.express works directly against a polars data frame (no .to_pandas() needed to build the figure) – plotly 6’s narwhals dependency handles that; shinywidgets[plotly] adds narwhals for plotly 5 users too.
If you read customdata yourself instead of using selected_rows(): px wraps each point’s custom_data in a list (one entry per point, even for a single column), so pts["customdata"].iloc[0] is [value], not value – unwrap with [0] (see the detail-card pattern below). selected_rows() already does this for you.
Reading on demand
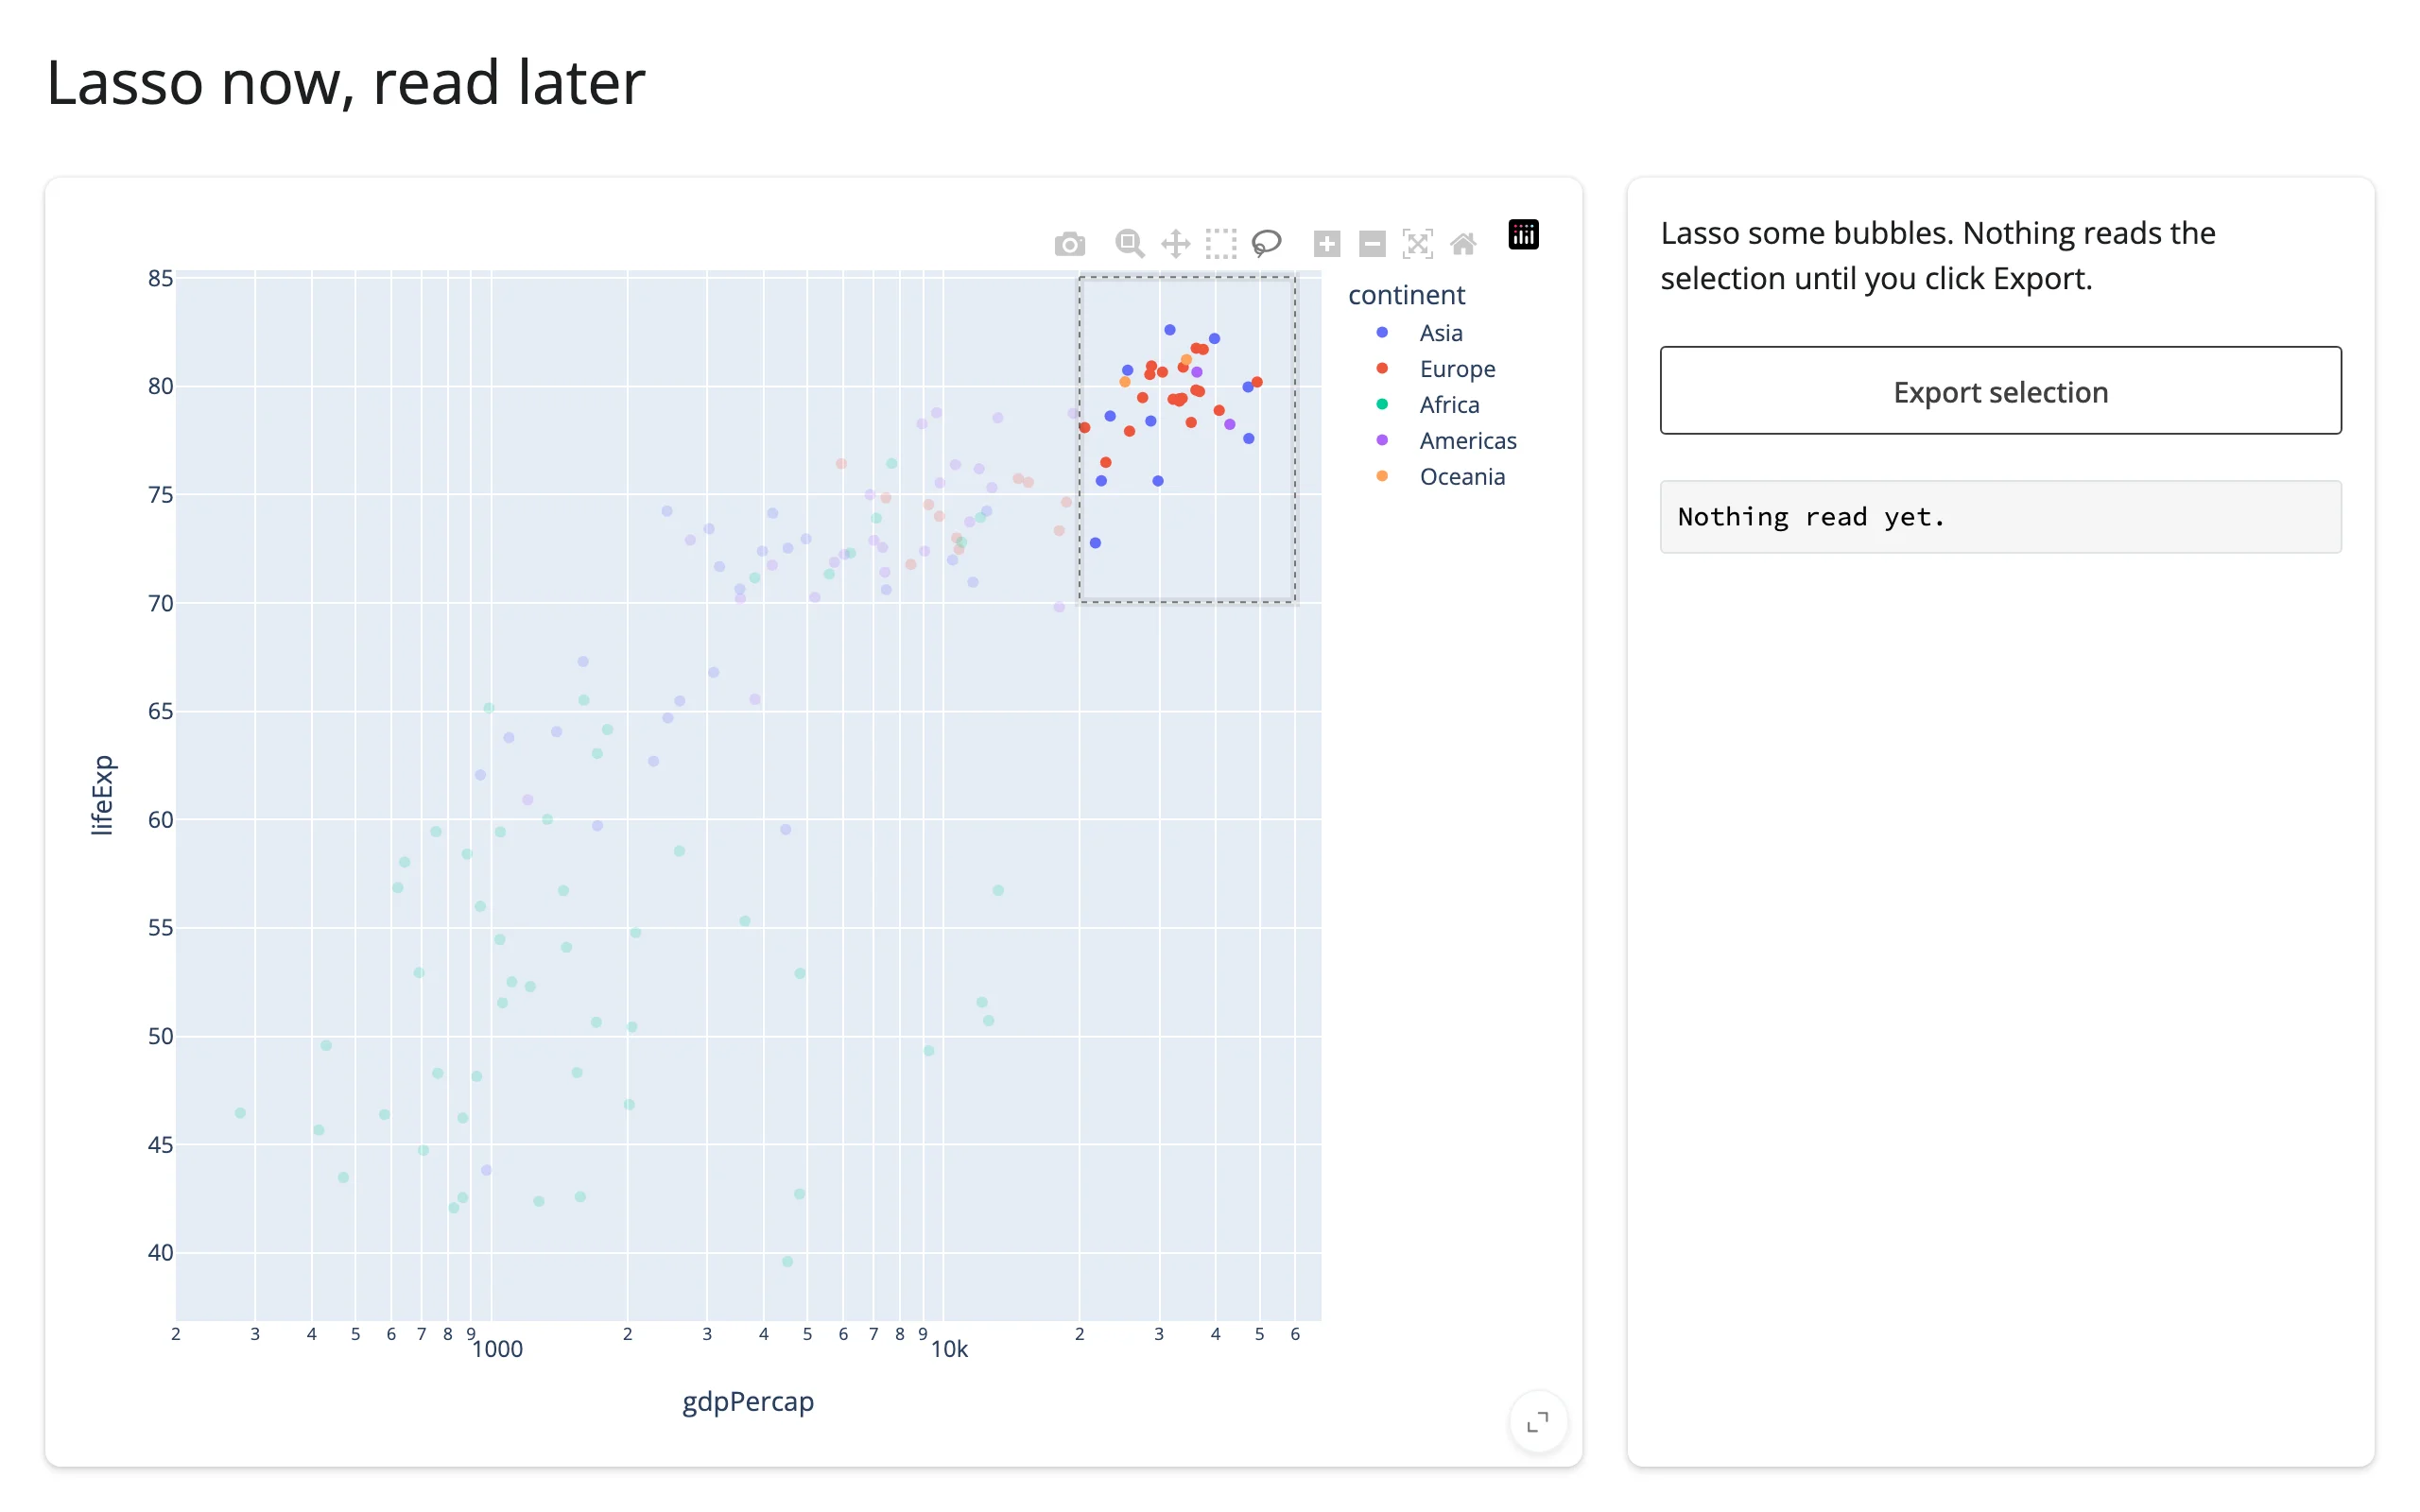
Because every accessor attaches at render and records the interaction regardless of whether anything has read it yet, it’s safe to leave an accessor completely unread until some later event – a button click, a download handler, an LLM tool call – asks for it. The lasso made before that first read isn’t lost:
import plotly.express as px
from shiny.express import input, render, ui
from shinywidgets import render_plotly

df = px.data.gapminder().query("year == 2007").reset_index(drop=True)

ui.page_opts(title="Lasso now, read later", fillable=True)

with ui.layout_columns(col_widths=[8, 4]):
    with ui.card(full_screen=True):

        @render_plotly
        def plot():
            fig = px.scatter(
                df,
                x="gdpPercap",
                y="lifeExp",
                color="continent",
                log_x=True,
                custom_data=[df.index],
            )
            fig.update_layout(dragmode="lasso")
            return fig

    with ui.card():
        "Lasso some bubbles. Nothing reads the selection until you click Export."
        ui.input_action_button("export", "Export selection")

        @render.code
        def summary():
            if input.export() == 0:
                return "Nothing read yet."
            rows = plot.selected_rows(df)
            if rows.empty:
                return "No selection to export."
            return (
                f"{len(rows)} countries\n"
                f"mean life expectancy {rows['lifeExp'].mean():.1f} years"
            )
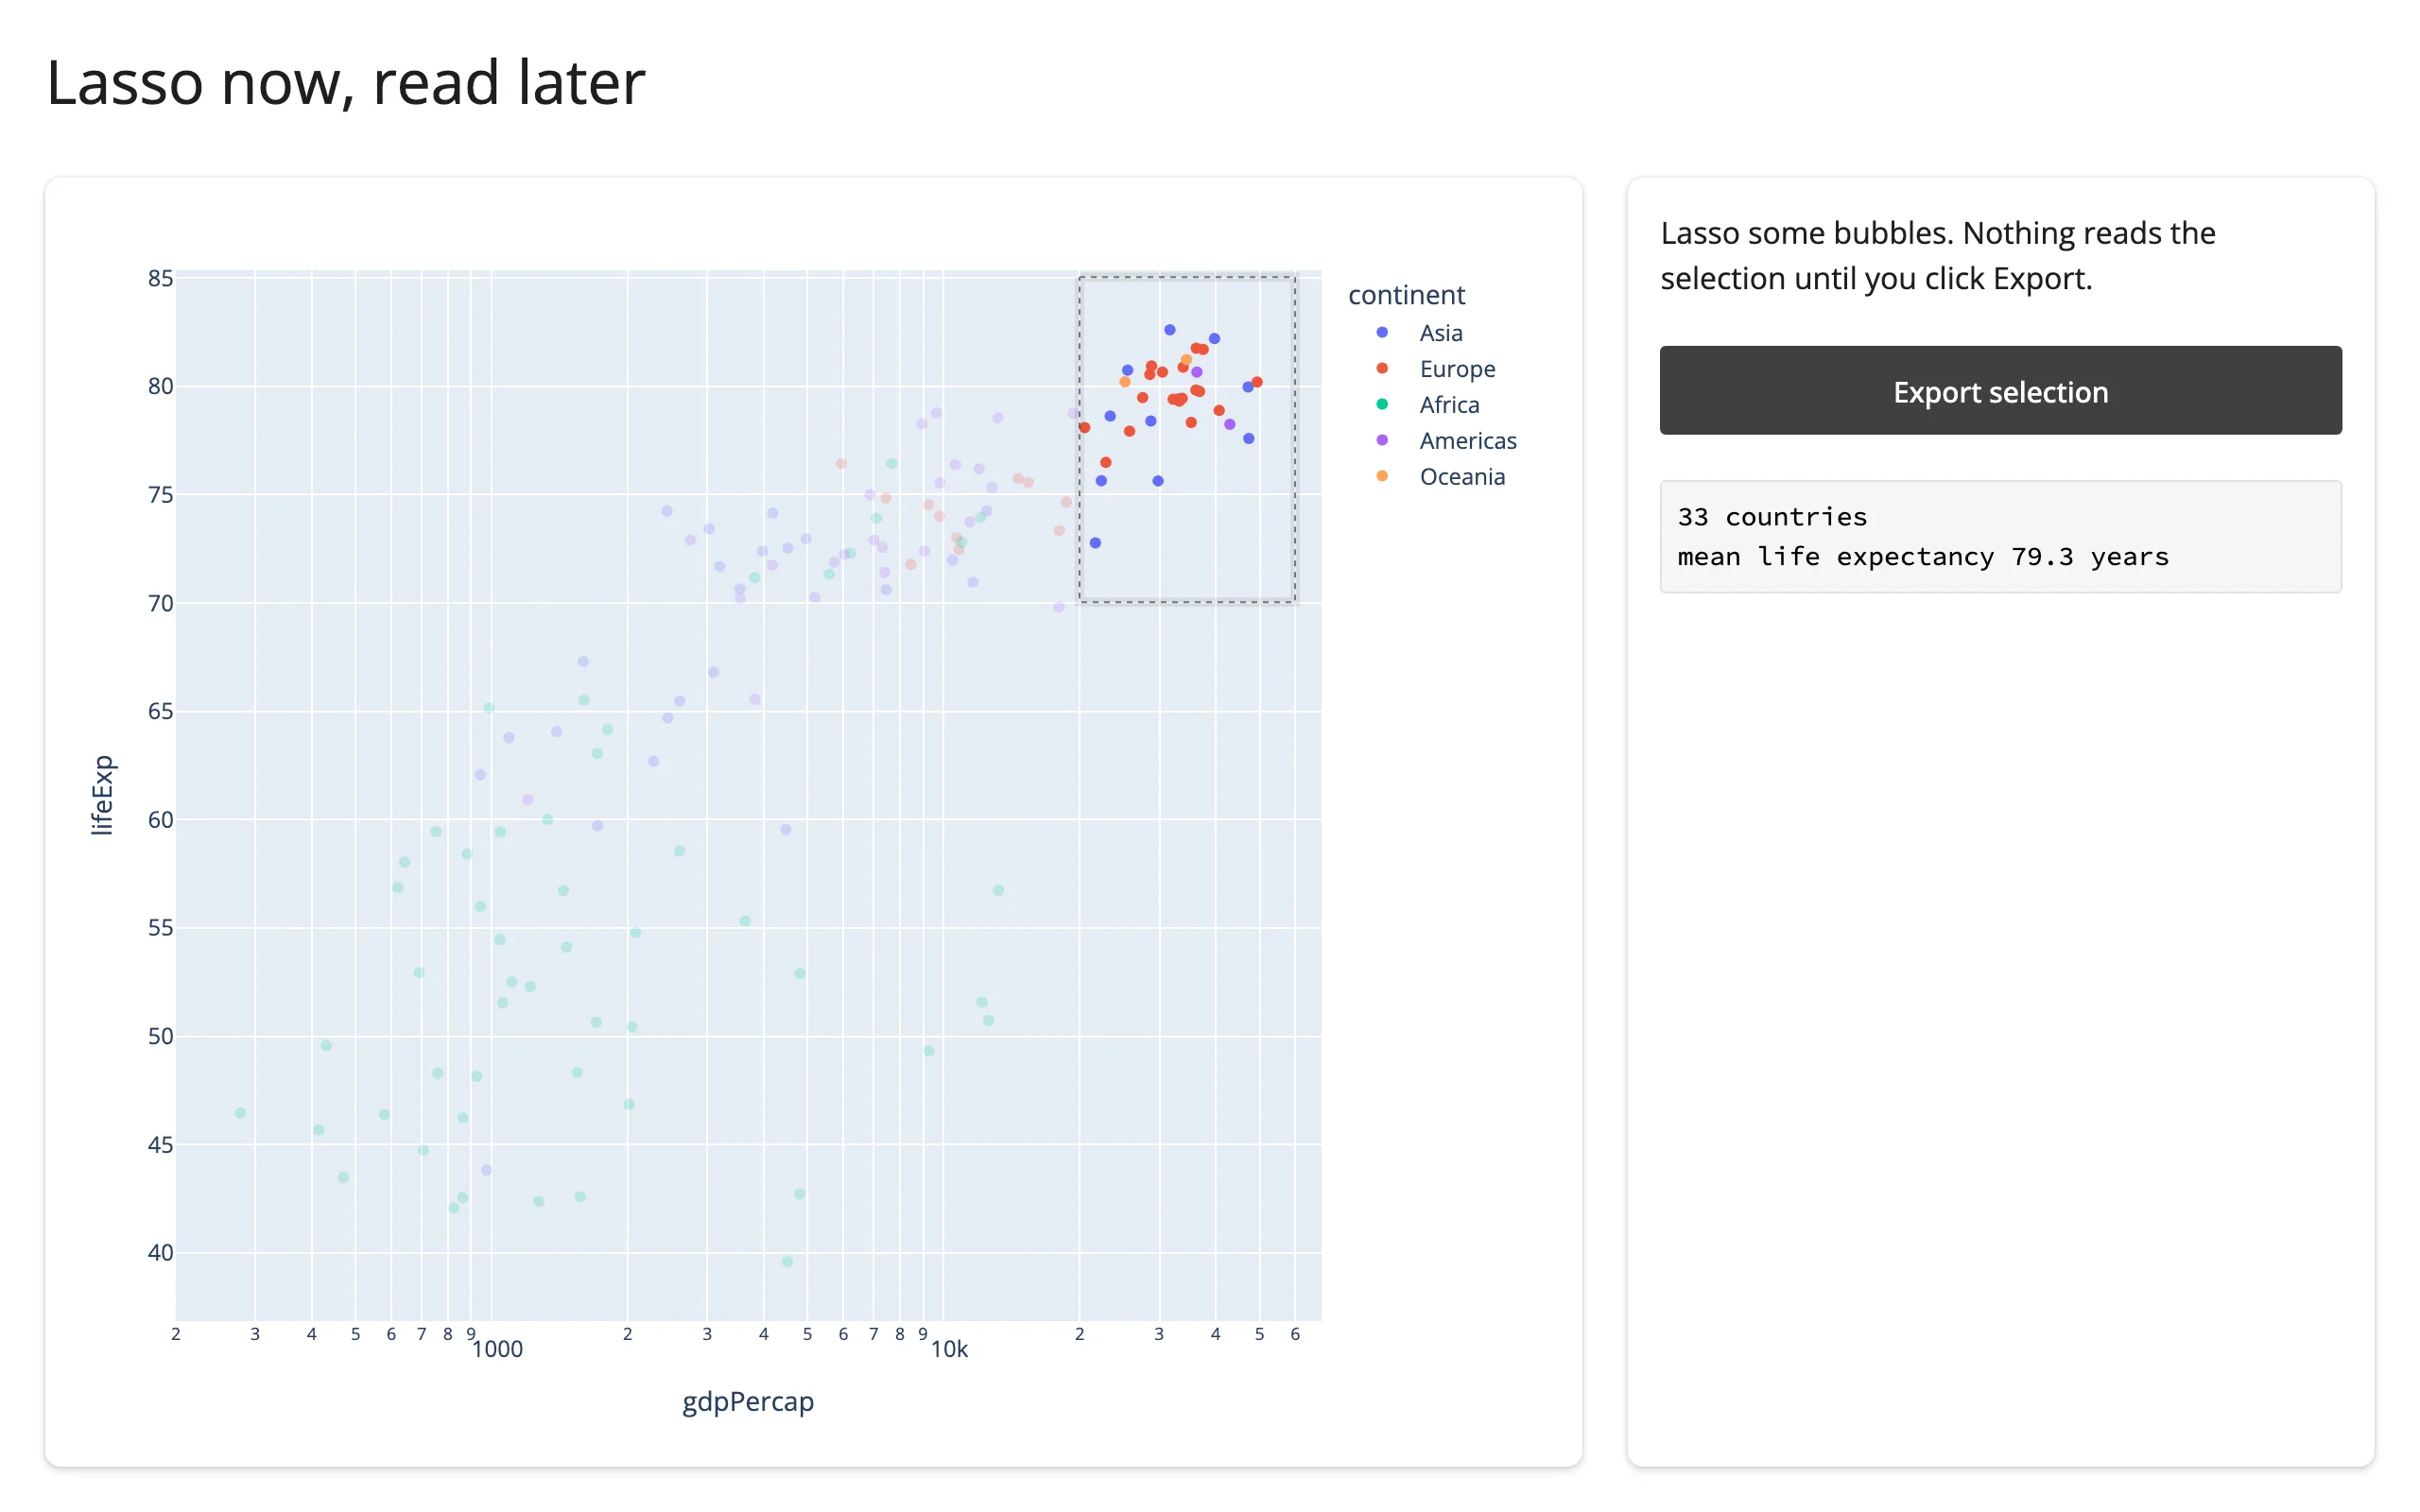
Lassoed, before the button is ever clicked (nothing has read selected_rows() yet), and after clicking Export – the earlier lasso is still there:
Beyond the accessors: .read()
Every output also has plot.read(name), which reads an accessor by name (plot.read("selected") is the same value as plot.selected()) and falls through to reactive_read() on the widget for any name that isn’t an accessor. For plotly there isn’t a non-accessor trait worth falling through to: verified on current main, reactive_read(fig.widget, "layout.xaxis.range") raises ValueError (“not a widget trait”) – layout isn’t a synced trait, it’s a plotly.py wrapper object. _widget_data/_widget_layout are synced traits, but they don’t change after the initial render, so reading them reactively never fires again. The private _js2py_relayout/_js2py_pointsCallback traits do fire on interaction, but they’re undocumented, fire twice per event, and are exactly what the accessors above already decode for you. In short: for plotly, the named accessor methods are the whole interaction surface – prefer them over .read(), which exists mainly as a generic primitive for code that reads outputs by name rather than by type (e.g. a table of every accessor on every output in an app).
Rate limiting
hover(), selecting(), and brushing() default to a 250ms debounce (they can fire dozens of times a second while the mouse moves or drags); the rest are event-driven and already fire at most once per gesture, so they aren’t rate-limited by default. Pass rate_delay=0 to @render_plotly to see every event as it happens – useful for debugging, or for a very cheap per-event computation where the debounce’s lag is more noticeable than its benefit:
import plotly.express as px
from shiny import reactive
from shiny.express import render, ui
from shinywidgets import render_plotly

df = px.data.gapminder().query("year == 2007").reset_index(drop=True)

ui.page_opts(title="Debounced vs. unlimited selecting()", fillable=True)

count_debounced = reactive.value(0)
count_live = reactive.value(0)

with ui.layout_columns():
    with ui.card(full_screen=True):
        "Default: debounced 250ms"

        @render_plotly
        def debounced():
            fig = px.scatter(df, x="gdpPercap", y="lifeExp", log_x=True)
            fig.update_layout(dragmode="select")
            return fig

        @reactive.effect
        def _count_debounced():
            debounced.selecting()
            with reactive.isolate():
                count_debounced.set(count_debounced() + 1)

        @render.text
        def n_debounced():
            return f"selecting() fired {count_debounced()} times"

    with ui.card(full_screen=True):
        "rate_delay=0: fires on every drag event"

        @render_plotly(rate_delay=0)
        def live():
            fig = px.scatter(df, x="gdpPercap", y="lifeExp", log_x=True)
            fig.update_layout(dragmode="select")
            return fig

        @reactive.effect
        def _count_live():
            live.selecting()
            with reactive.isolate():
                count_live.set(count_live() + 1)

        @render.text
        def n_live():
            return f"selecting() fired {count_live()} times"
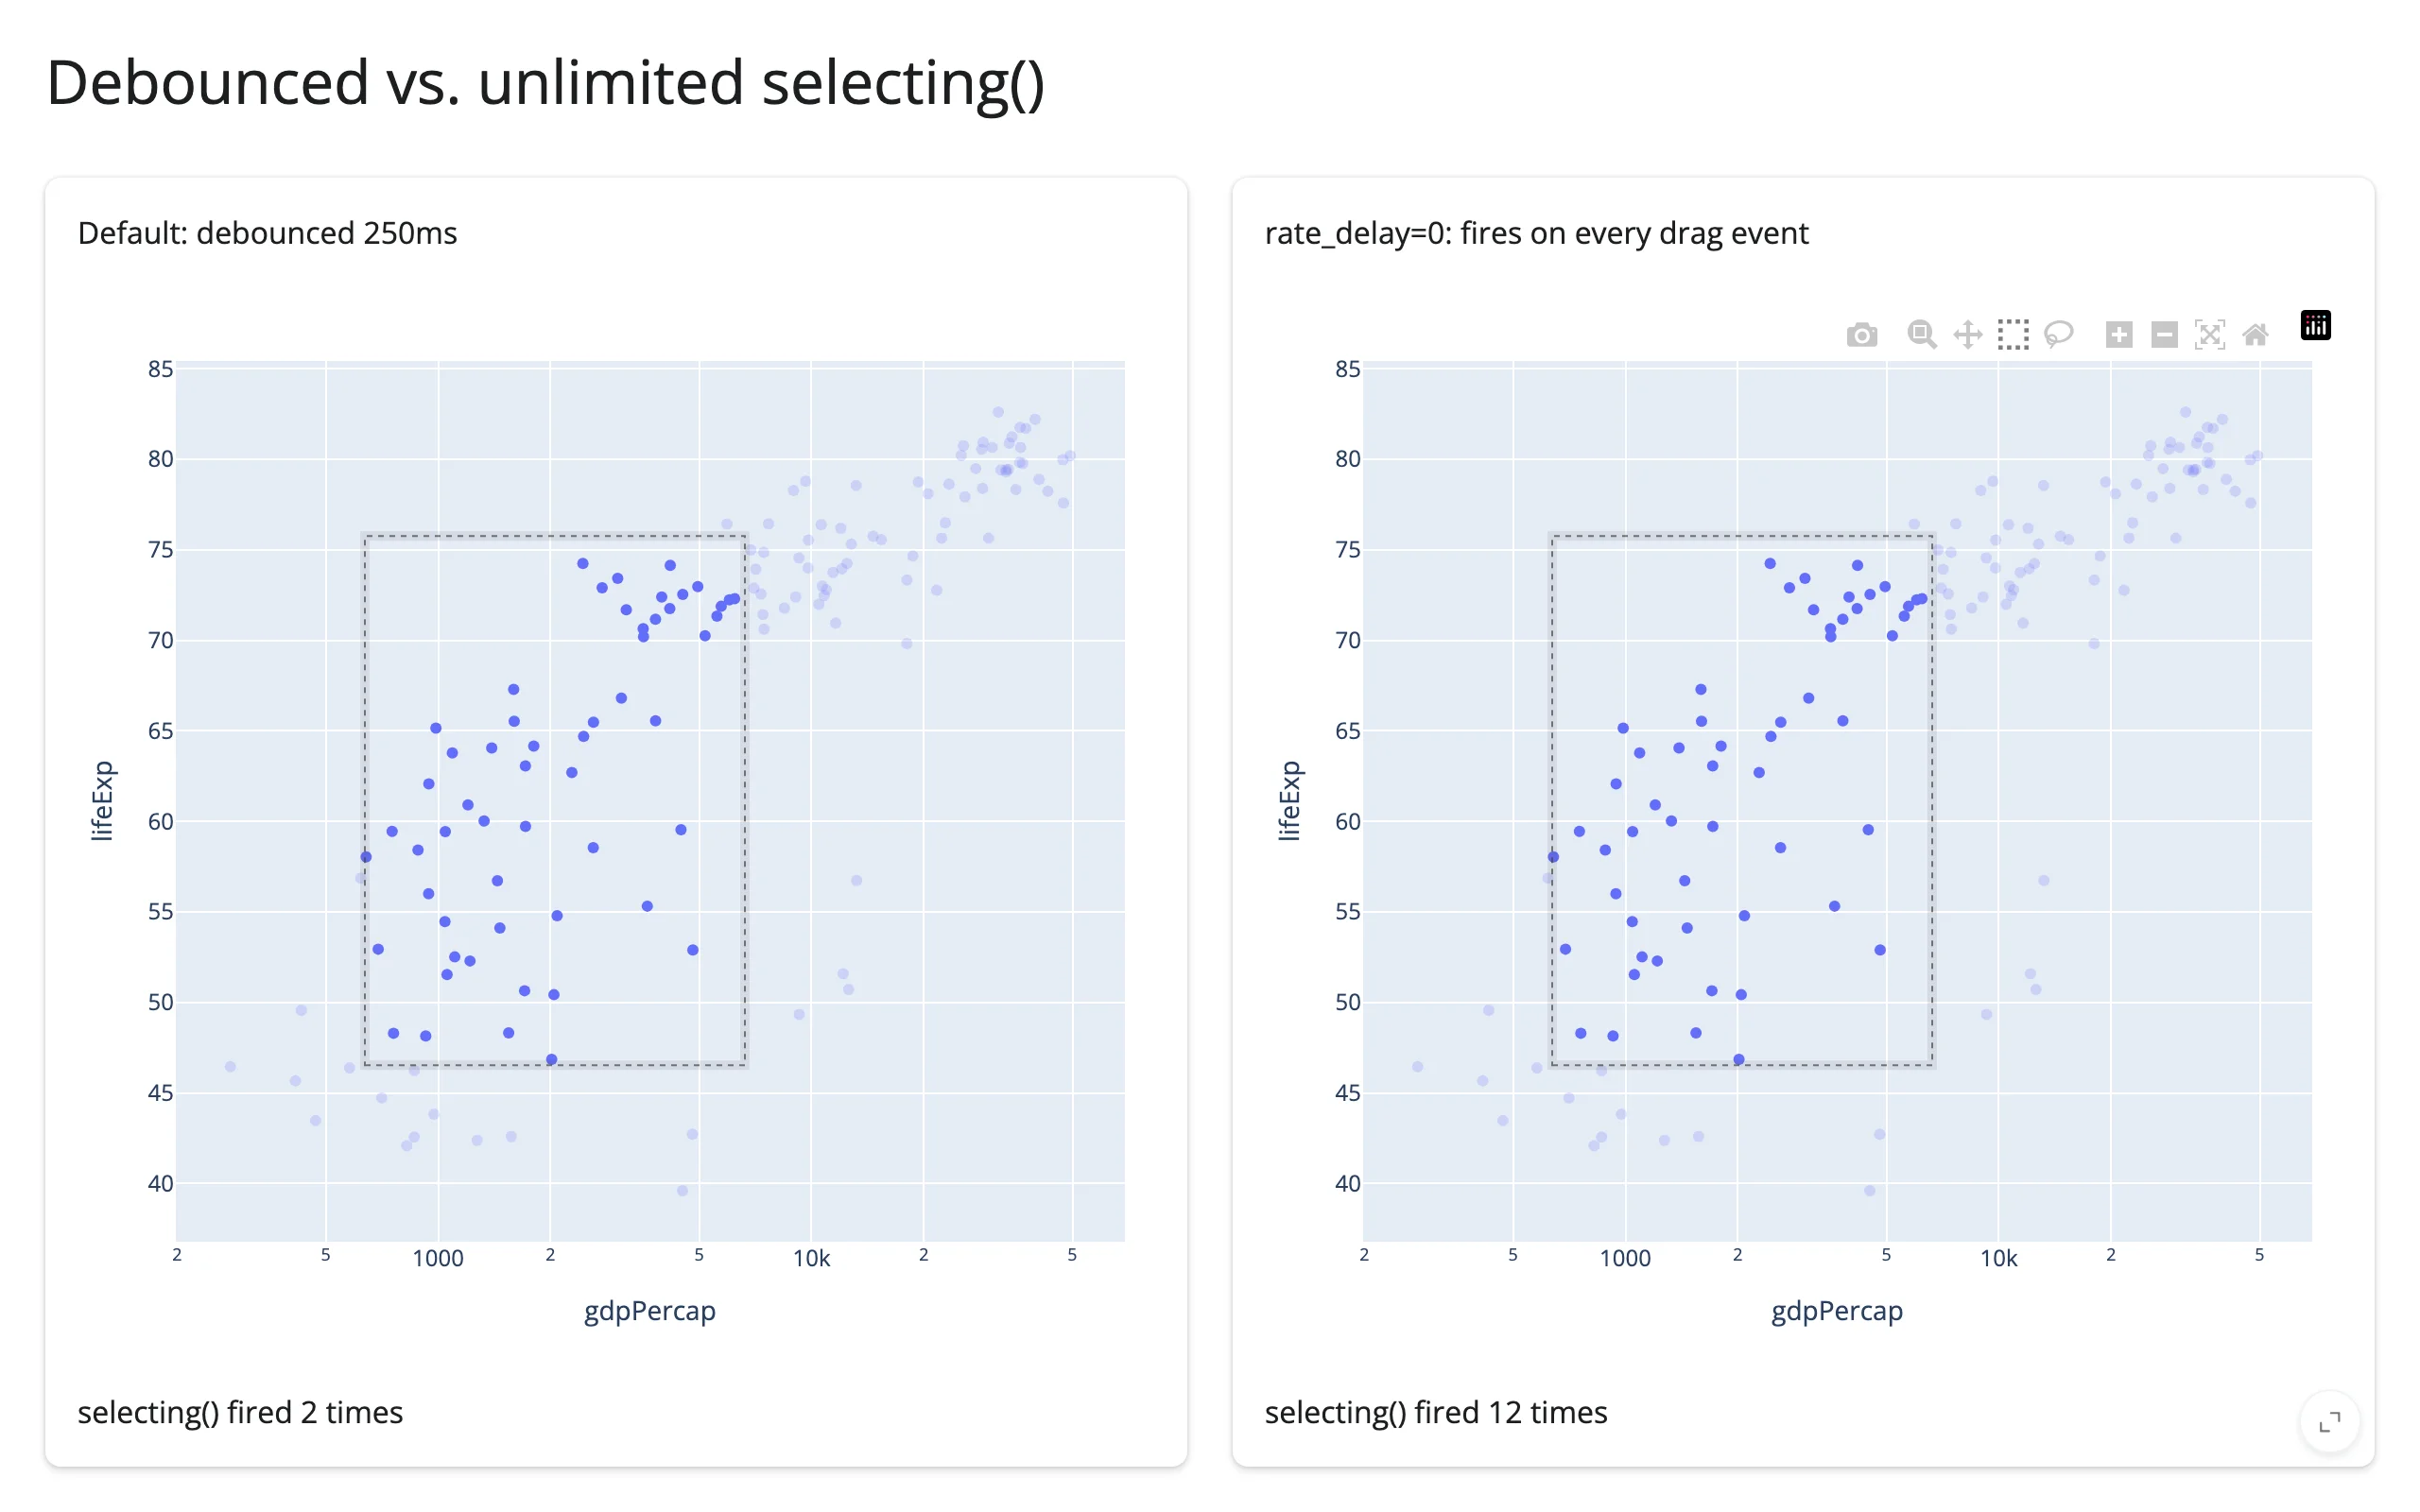
The same slow drag fires selecting() 2 times debounced vs. 12 times with rate_delay=0:
Updating the widget from Python
Re-rendering (the render function reading a changed input) rebuilds the figure from scratch: zoom resets, and selected()/brushed()/visible_traces() re-seed to the new, unselected figure (see “Reacting to user interaction” above for which accessors keep their value instead). Verified on current main: the plot also goes visibly blank for roughly a second while plotly.js reloads before the new figure paints (worse under load). Prefer re-rendering when the shape of the data genuinely changes (new/removed traces, a different chart type).
For everything else – restyling existing traces, moving points, changing colors – read inputs under reactive.isolate() in the render function (so the render function itself never re-runs on that input) and mutate .widget from a @reactive.effect. This is instant, preserves zoom/selection, and never re-sends plotly’s JS bundle:
import plotly.express as px
from shiny import reactive
from shiny.express import input, ui
from shinywidgets import render_plotly

df = px.data.gapminder().query("year == 2007").reset_index(drop=True)

ui.page_opts(title="Resize markers without rebuilding the plot", fillable=True)

ui.input_slider("marker_size", "Marker size", min=4, max=24, value=8)


@render_plotly
def plot():
    # The render function never reads marker_size, so this never re-runs:
    # zoom and selection survive every slider move.
    return px.scatter(df, x="gdpPercap", y="lifeExp", color="continent", log_x=True)


@reactive.effect
def _resize():
    with plot.widget.batch_update():
        for trace in plot.widget.data:
            trace.marker.size = input.marker_size()
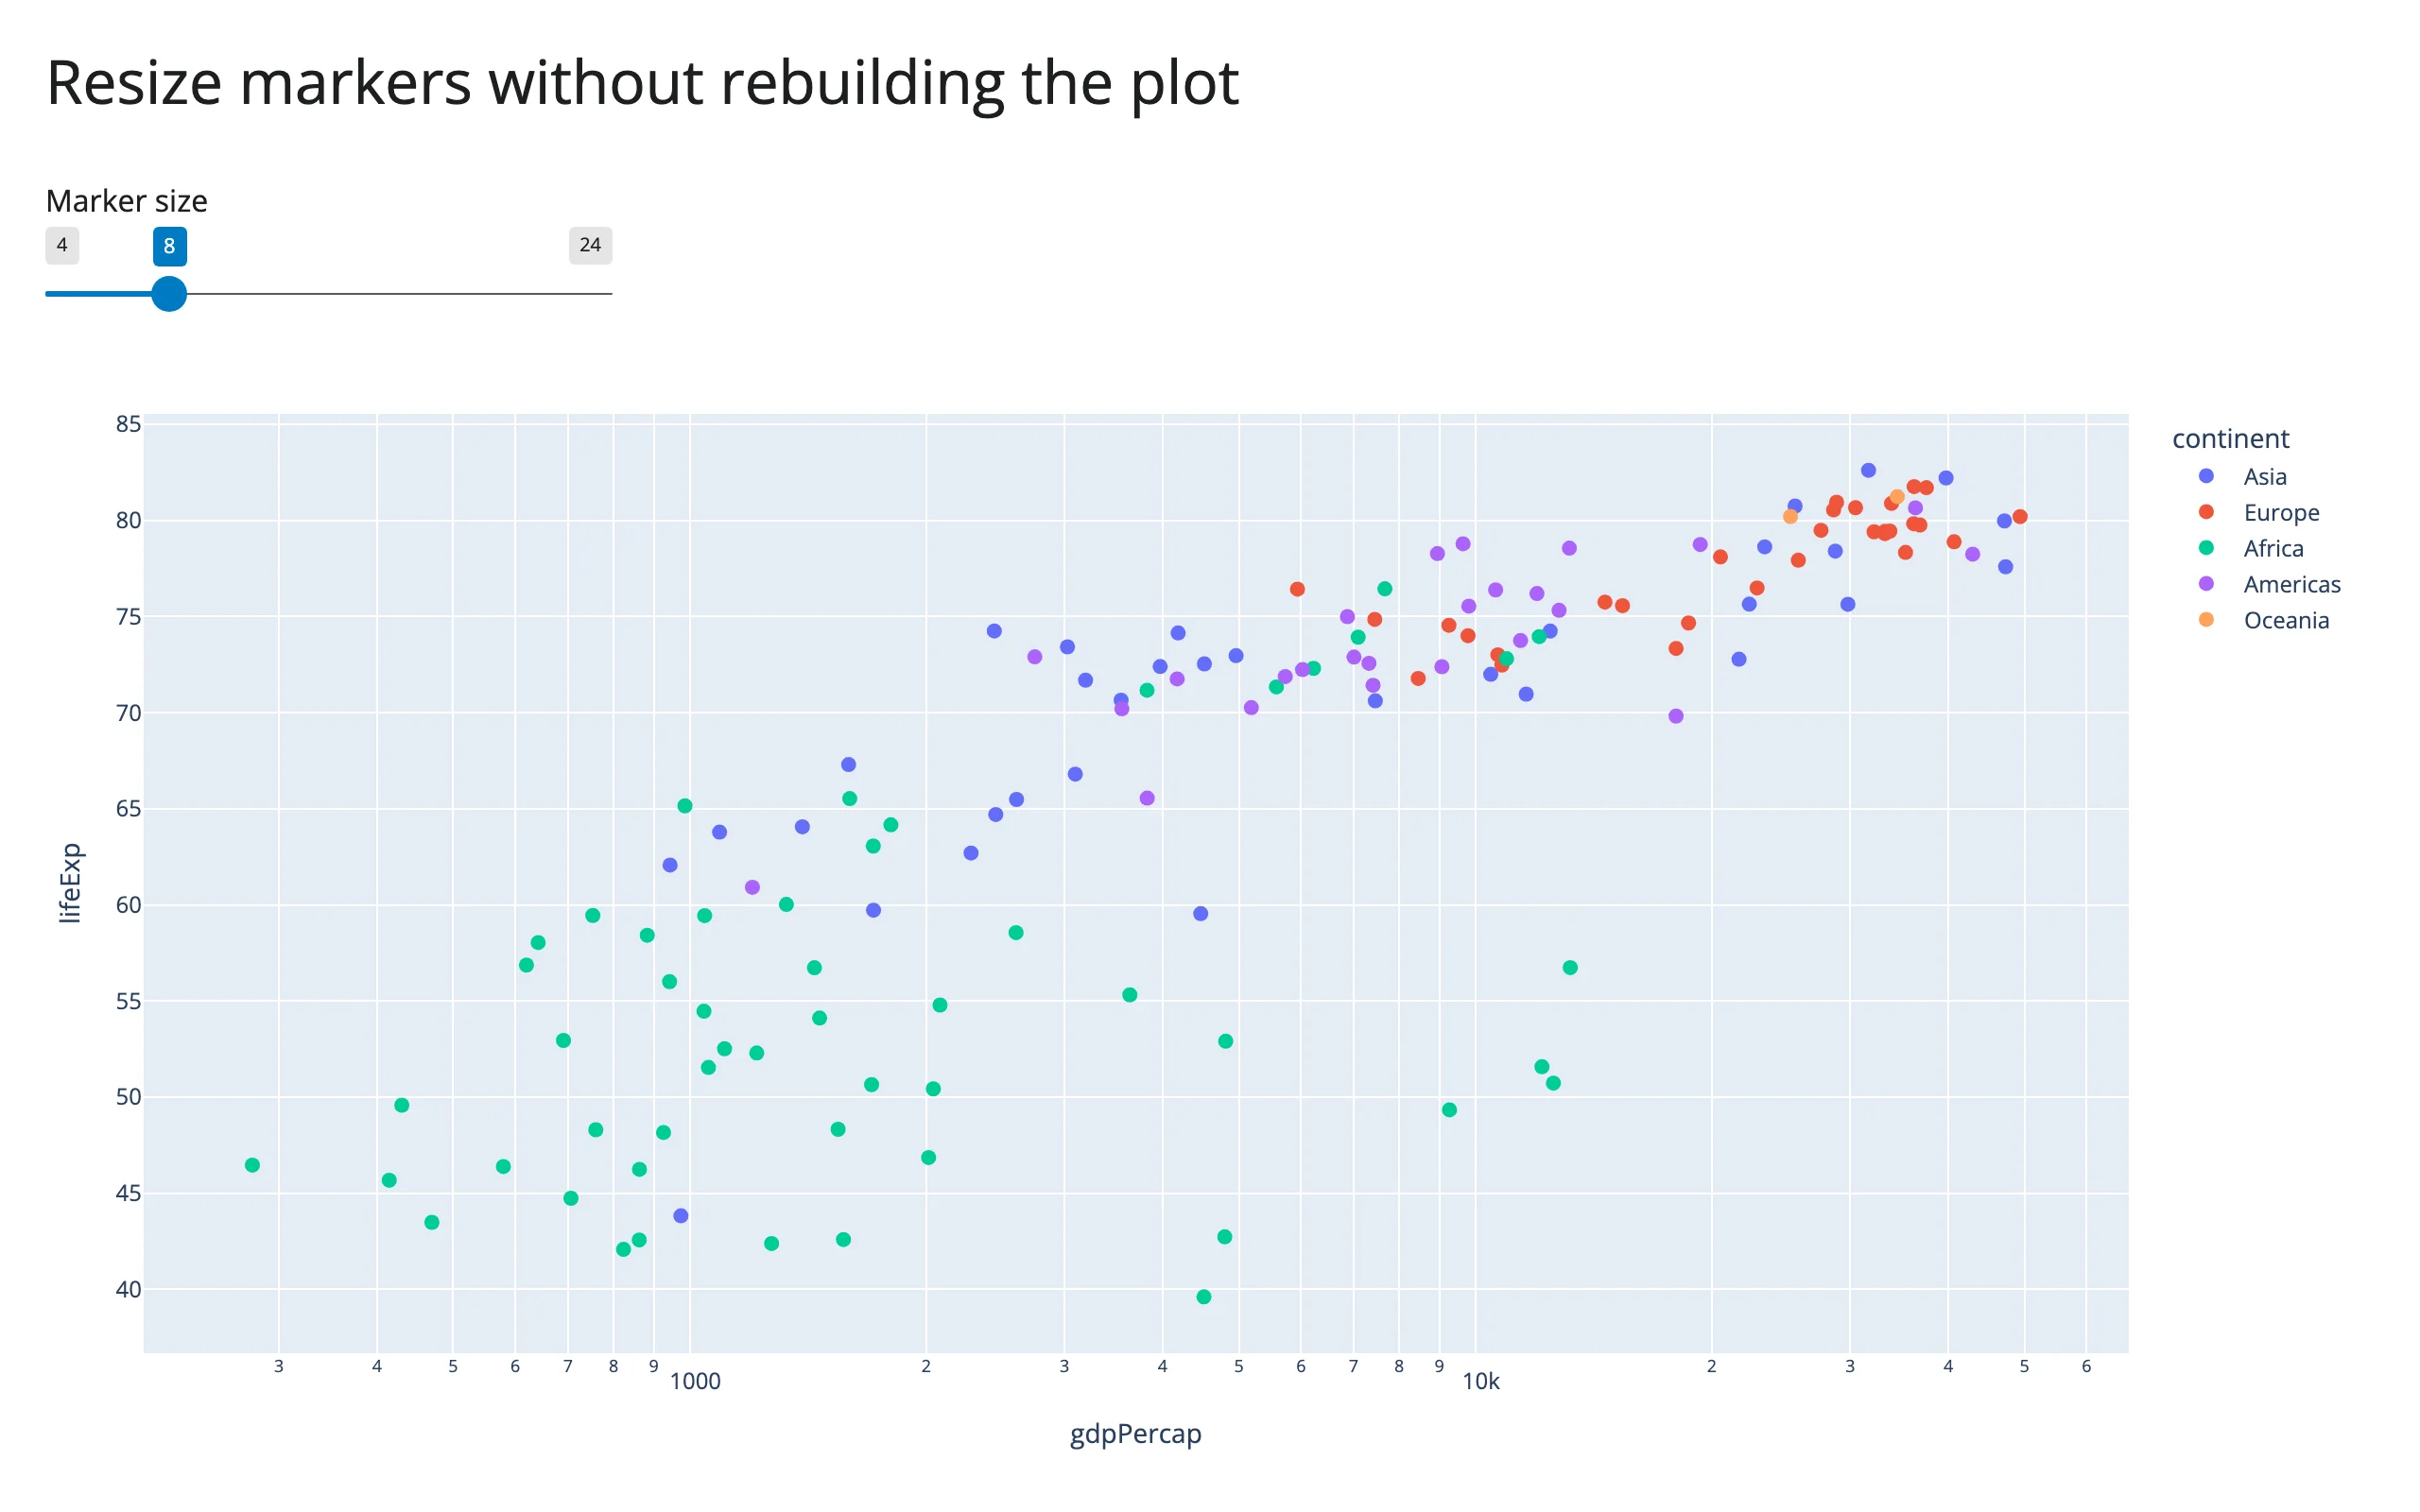
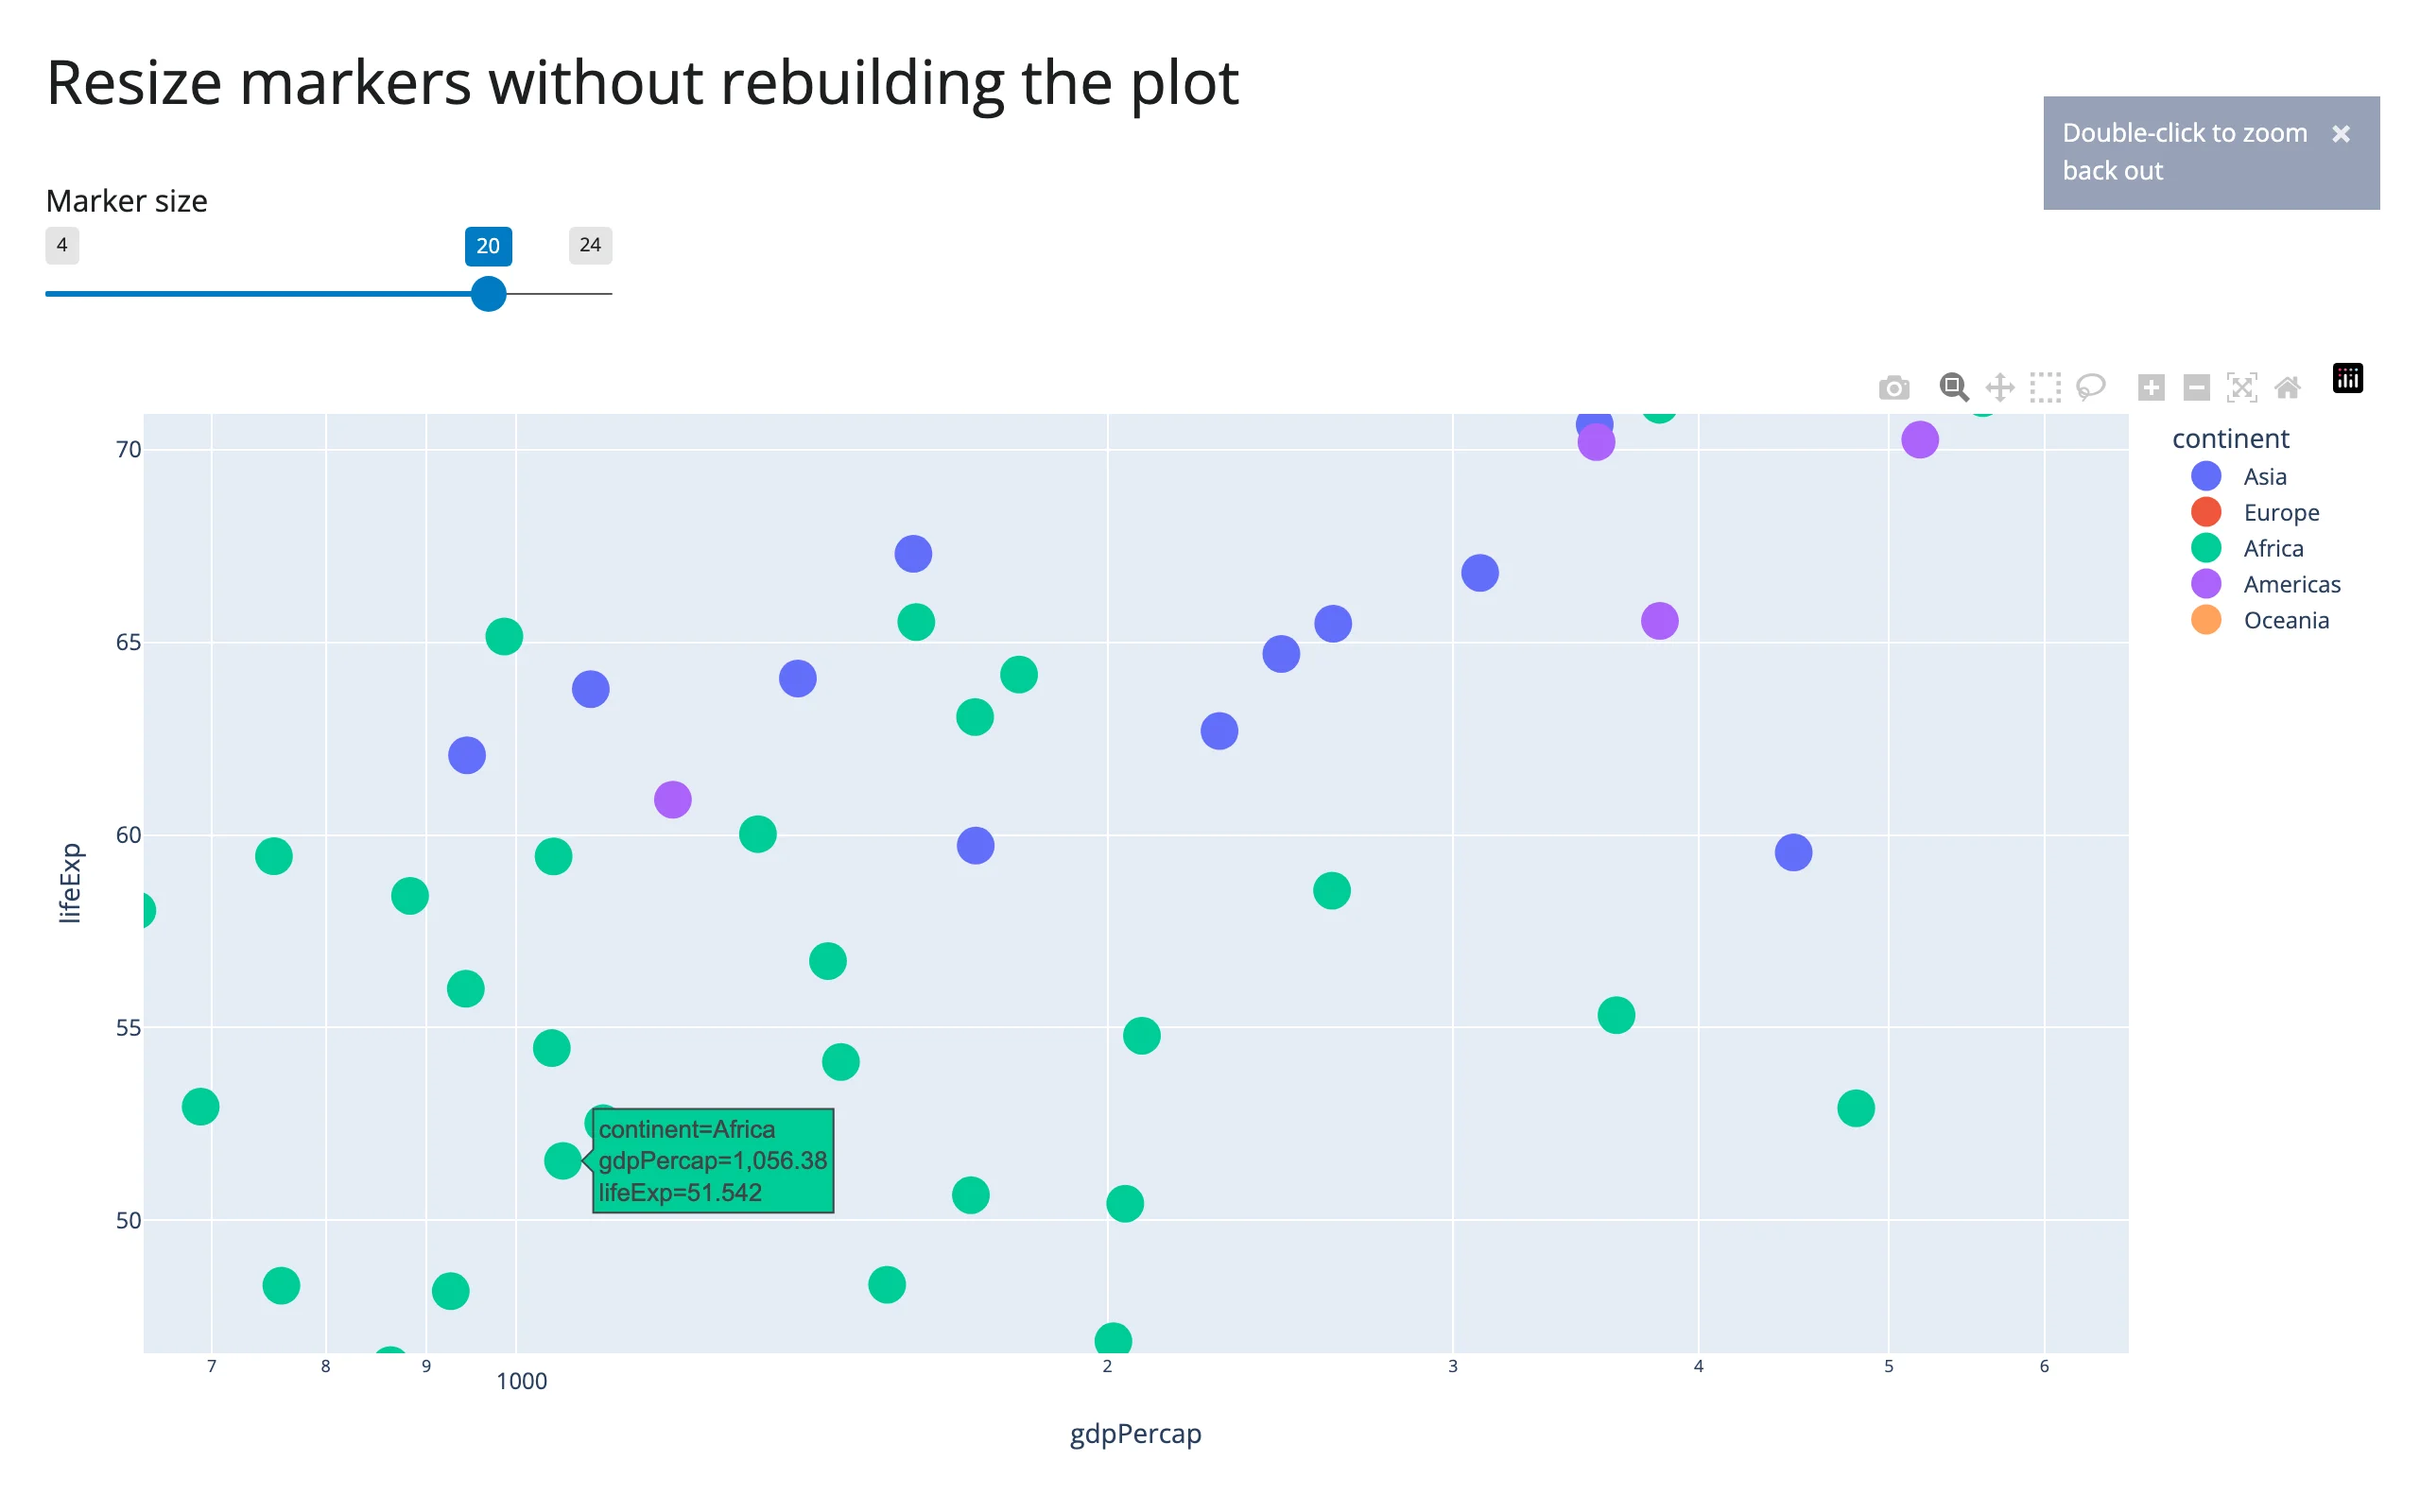
Zoomed in, then the marker-size slider moved to 20 – the zoom range is untouched:
Use with widget.batch_update(): to batch many property changes into one message (as above), or widget.batch_animate(duration=..., easing=...) to tween x/y/marker.size/etc. changes smoothly – see the gallery showcase below for a slider-driven animation built entirely from batch_animate, with no plotly “frames” involved.
Coordinating multiple views
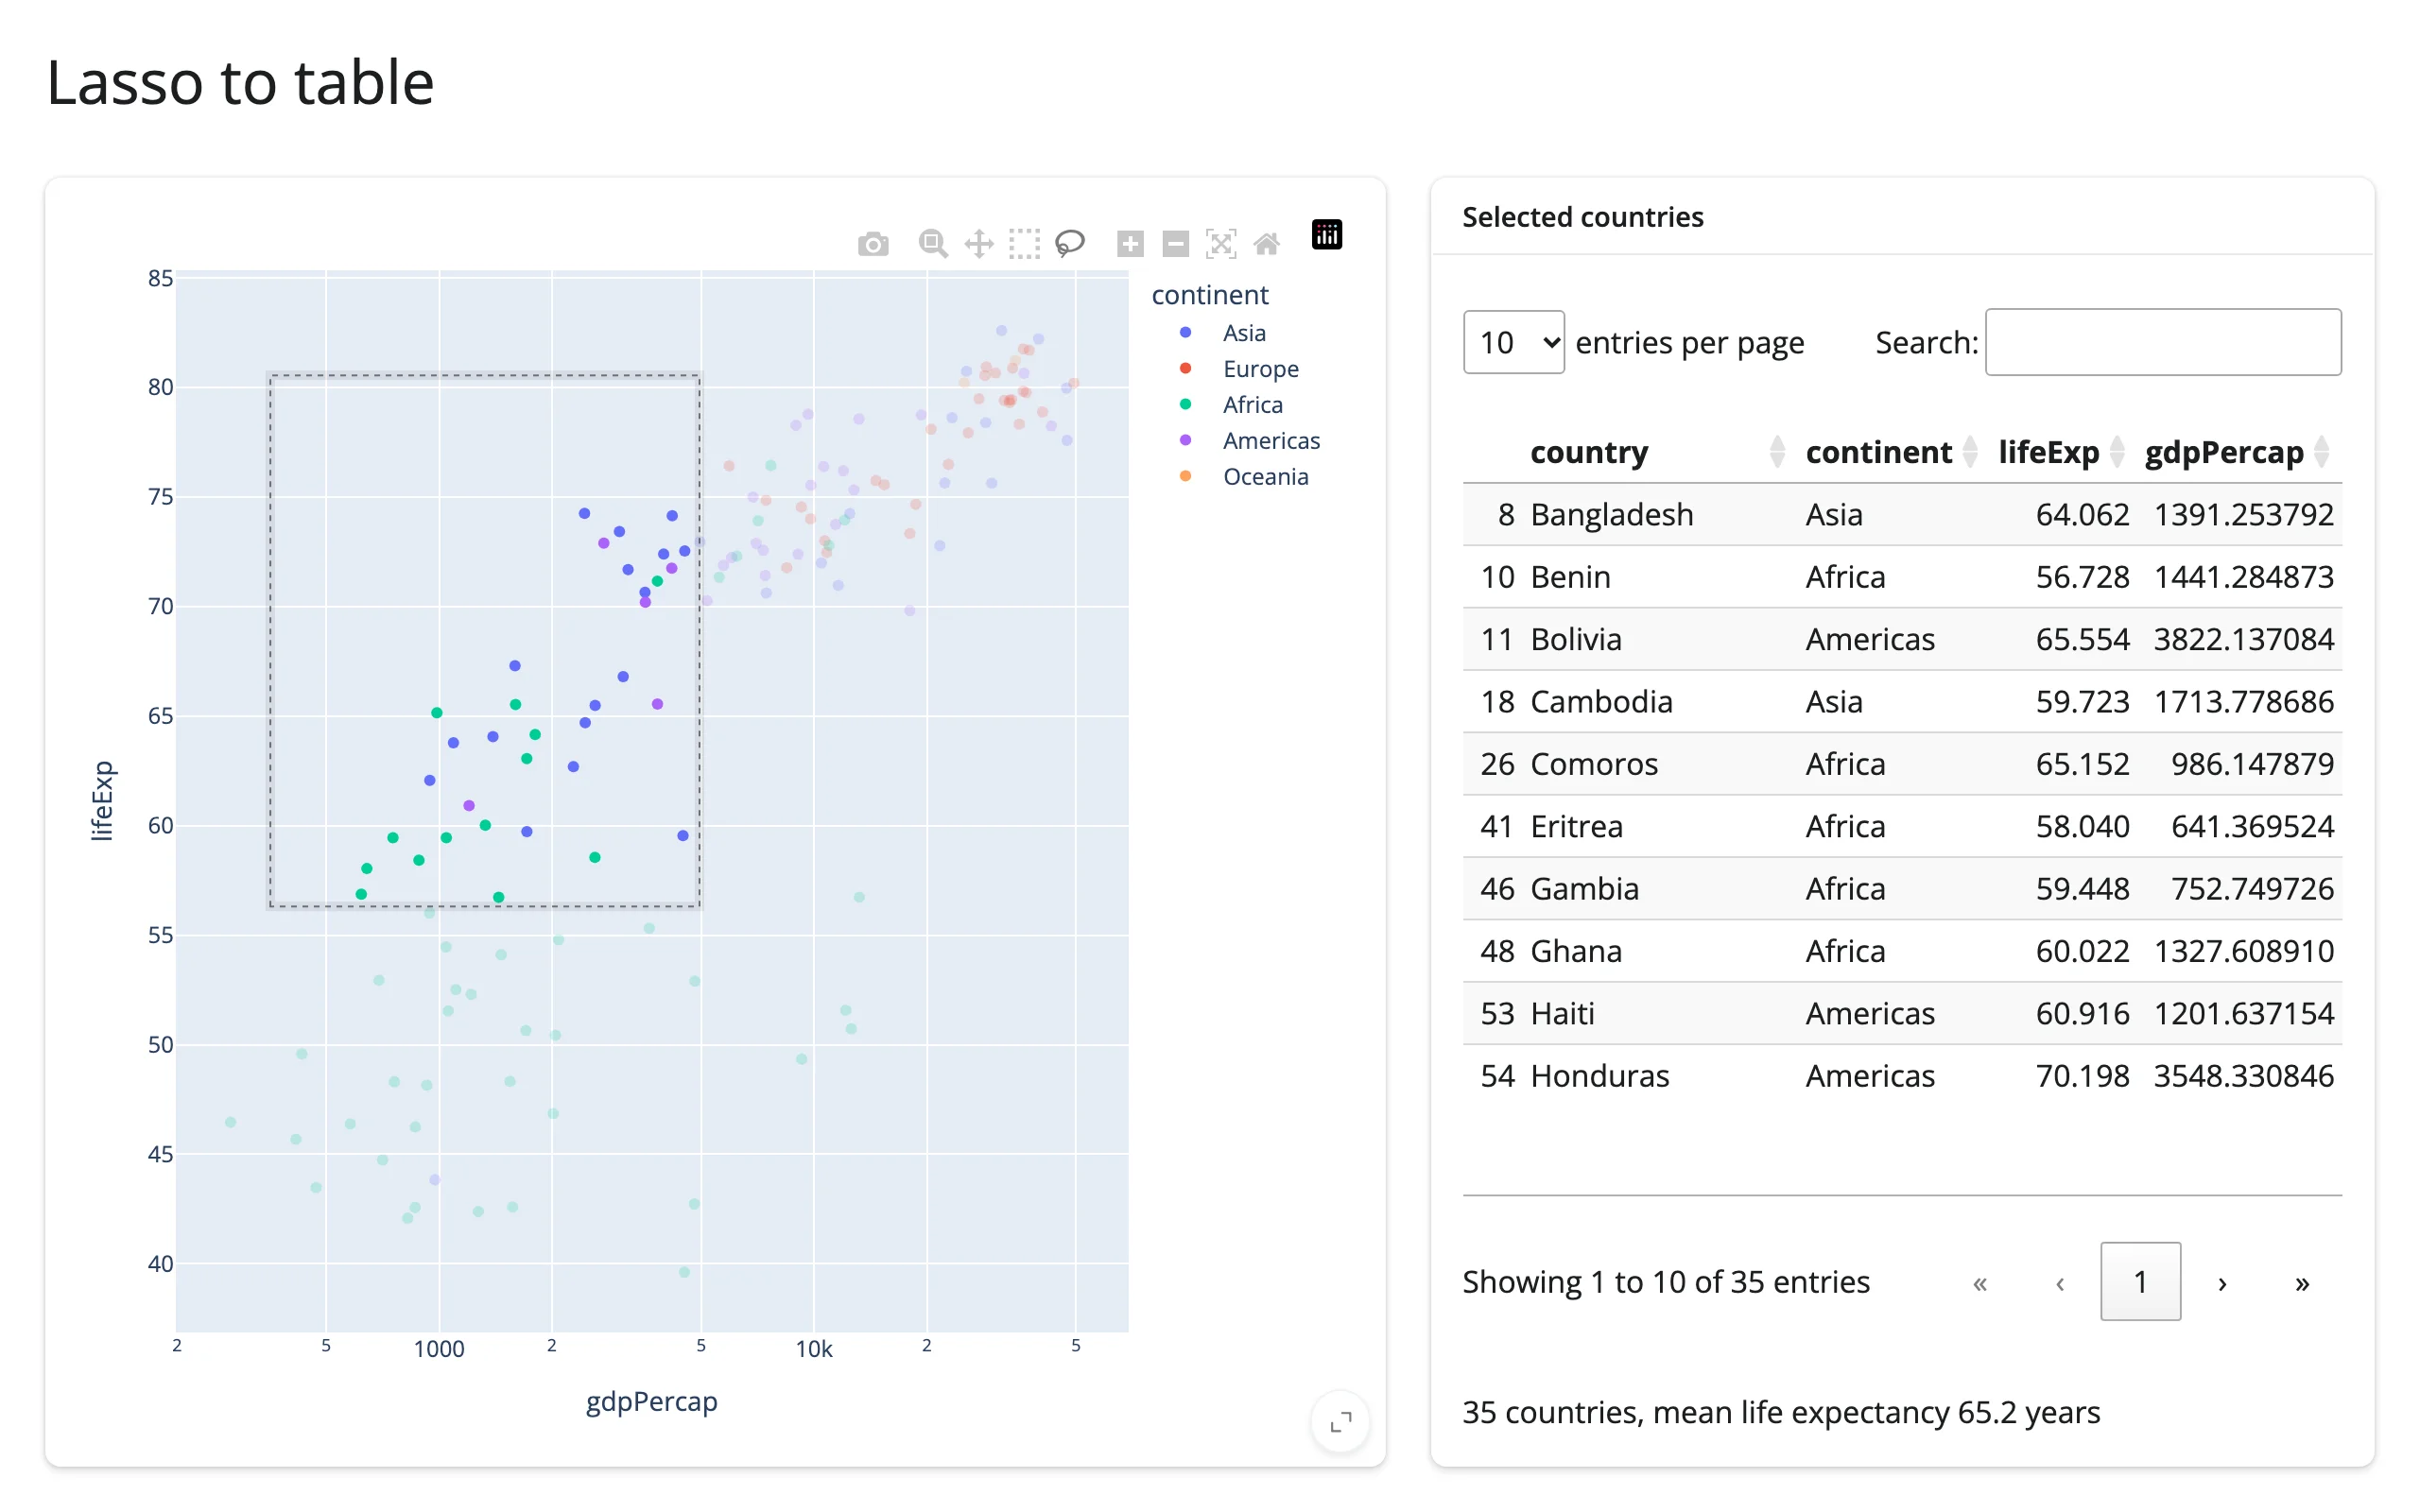
Lasso a scatter plot, filter a table and a summary
Pairs with: itables. selected_rows() feeds a render_itables table and a one-line summary directly; no manual row-matching needed beyond what selected_rows() already does.
import plotly.express as px
from shiny.express import render, ui
from shinywidgets import render_itables, render_plotly

df = px.data.gapminder().query("year == 2007").reset_index(drop=True)

ui.page_opts(title="Lasso to table", fillable=True)

with ui.layout_columns(col_widths=[7, 5]):
    with ui.card(full_screen=True):

        @render_plotly
        def plot():
            fig = px.scatter(
                df,
                x="gdpPercap",
                y="lifeExp",
                color="continent",
                log_x=True,
                custom_data=[df.index],
            )
            fig.update_layout(dragmode="lasso")
            return fig

    with ui.card(full_screen=True):
        ui.card_header("Selected countries")

        @render_itables
        def table():
            cols = ["country", "continent", "lifeExp", "gdpPercap"]
            return plot.selected_rows(df)[cols]

        @render.text
        def summary():
            rows = plot.selected_rows(df)
            if rows.empty:
                return "Lasso some bubbles to see summary stats."
            return (
                f"{len(rows)} countries, mean life expectancy "
                f"{rows['lifeExp'].mean():.1f} years"
            )
Selection in one plot highlights another, in place
Lasso points in a scatter plot, and the matching bars in a second, unrelated figure light up – restyled with batch_update(), not rebuilt, so the bar chart’s own state (and the scatter’s selection) survives.
import plotly.express as px
import plotly.graph_objects as go
from shiny import reactive
from shiny.express import ui
from shinywidgets import render_plotly

df = px.data.gapminder().query("year == 2007").reset_index(drop=True)
top30 = df.nlargest(30, "pop").sort_values("pop")

ui.page_opts(title="Selection highlights a second plot", fillable=True)

with ui.layout_columns(col_widths=[7, 5]):
    with ui.card(full_screen=True):

        @render_plotly
        def scatter():
            fig = px.scatter(
                df,
                x="gdpPercap",
                y="lifeExp",
                color="continent",
                log_x=True,
                custom_data=[df.index],
            )
            fig.update_layout(dragmode="lasso")
            return fig

    with ui.card(full_screen=True):

        @render_plotly
        def bars():
            fig = go.Figure(go.Bar(x=top30["pop"], y=top30["country"], orientation="h"))
            fig.update_traces(marker_color="lightgray")
            return fig


@reactive.effect
def _highlight():
    selected = set(scatter.selected_rows(df)["country"])
    colors = ["#1f77b4" if c in selected else "lightgray" for c in top30["country"]]
    bars.widget.data[0].marker.color = colors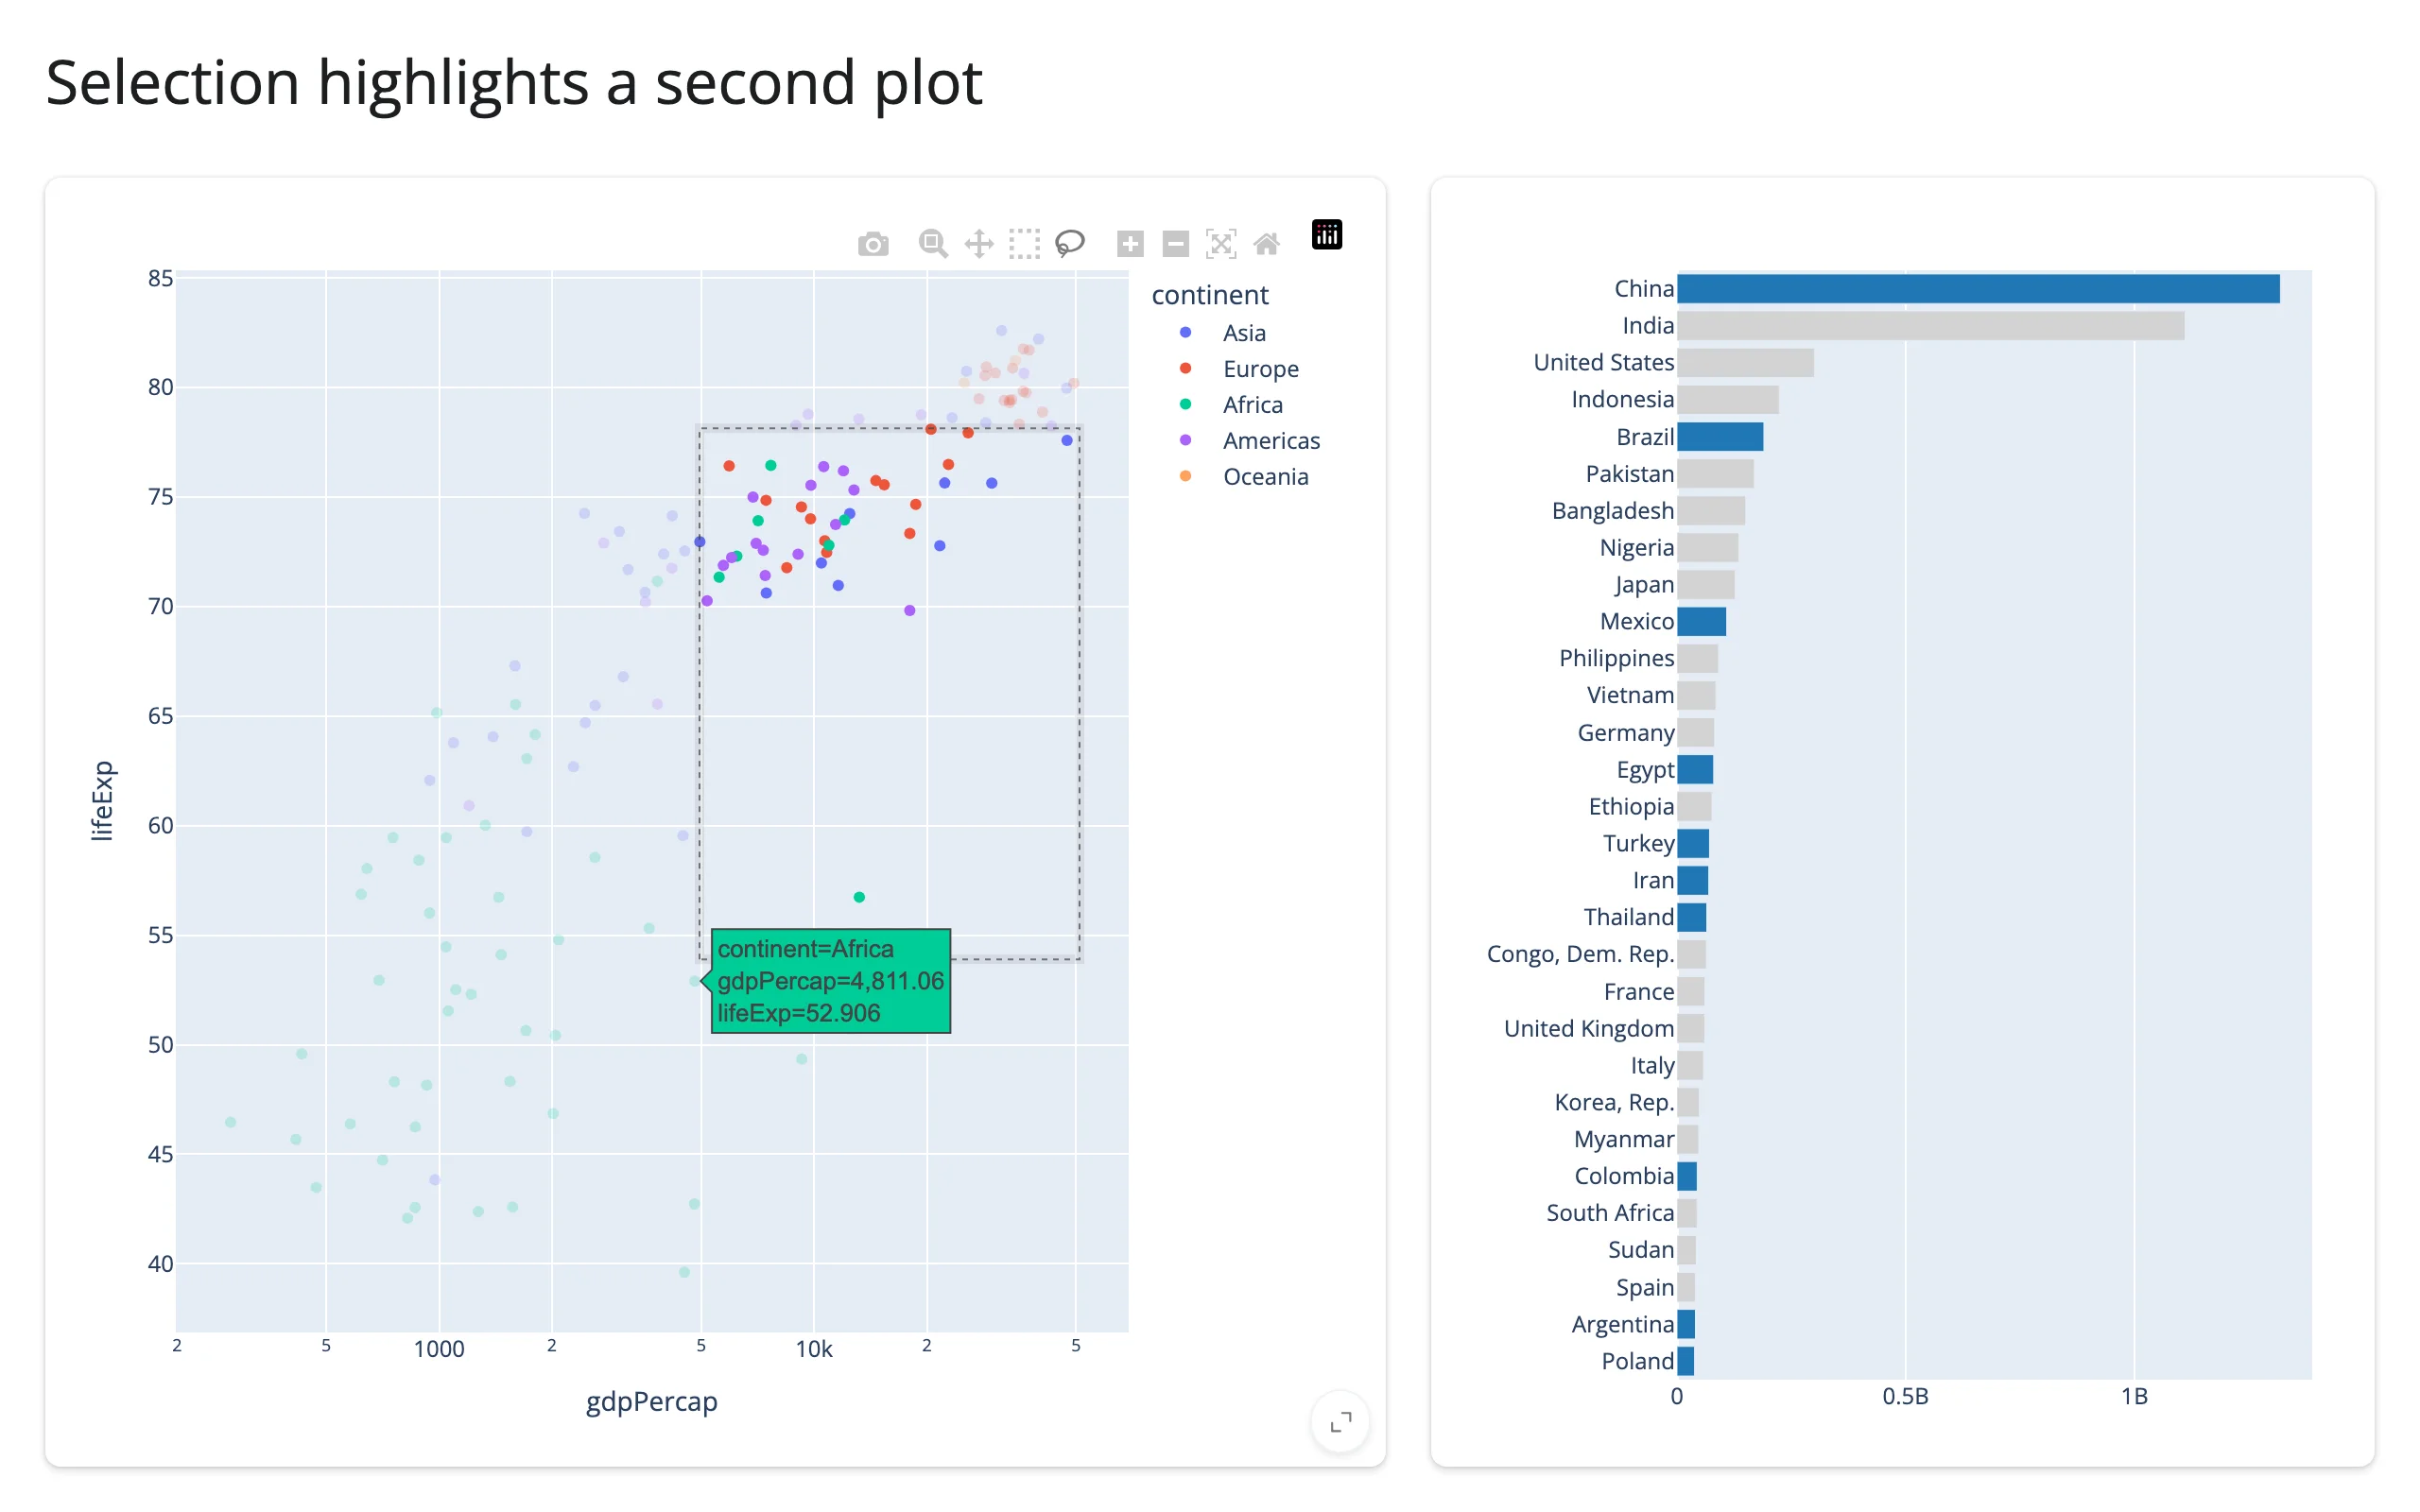
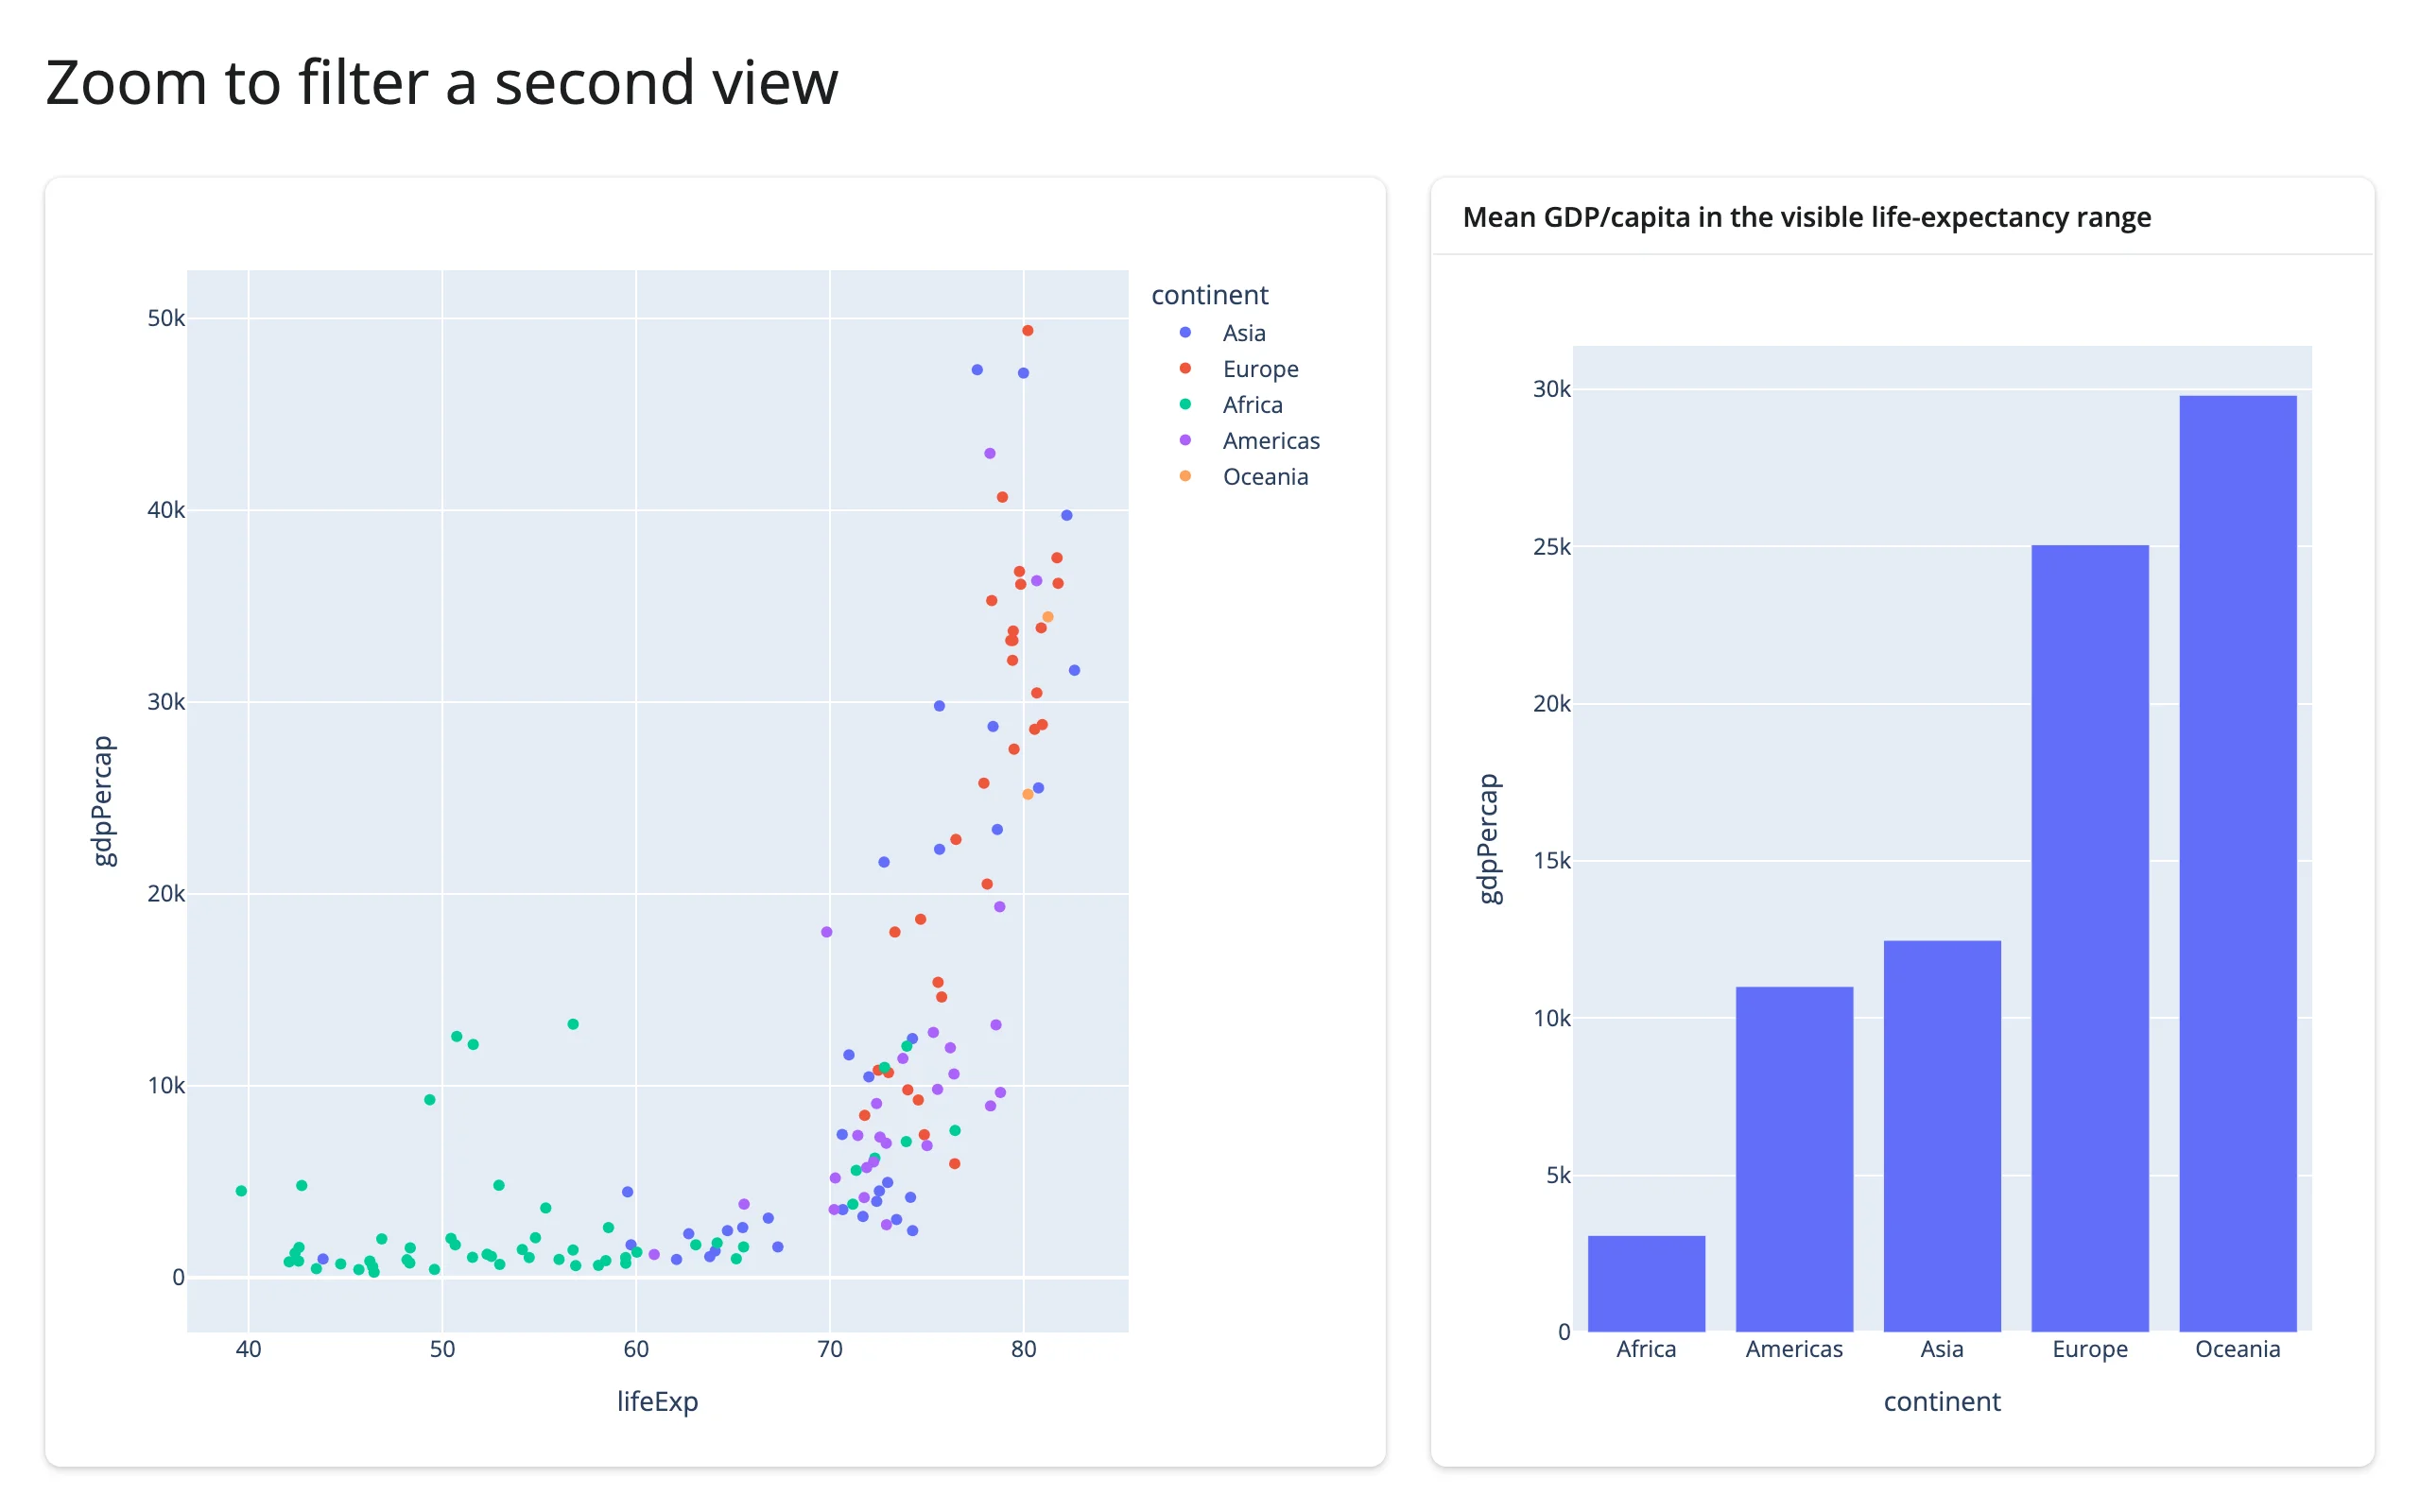
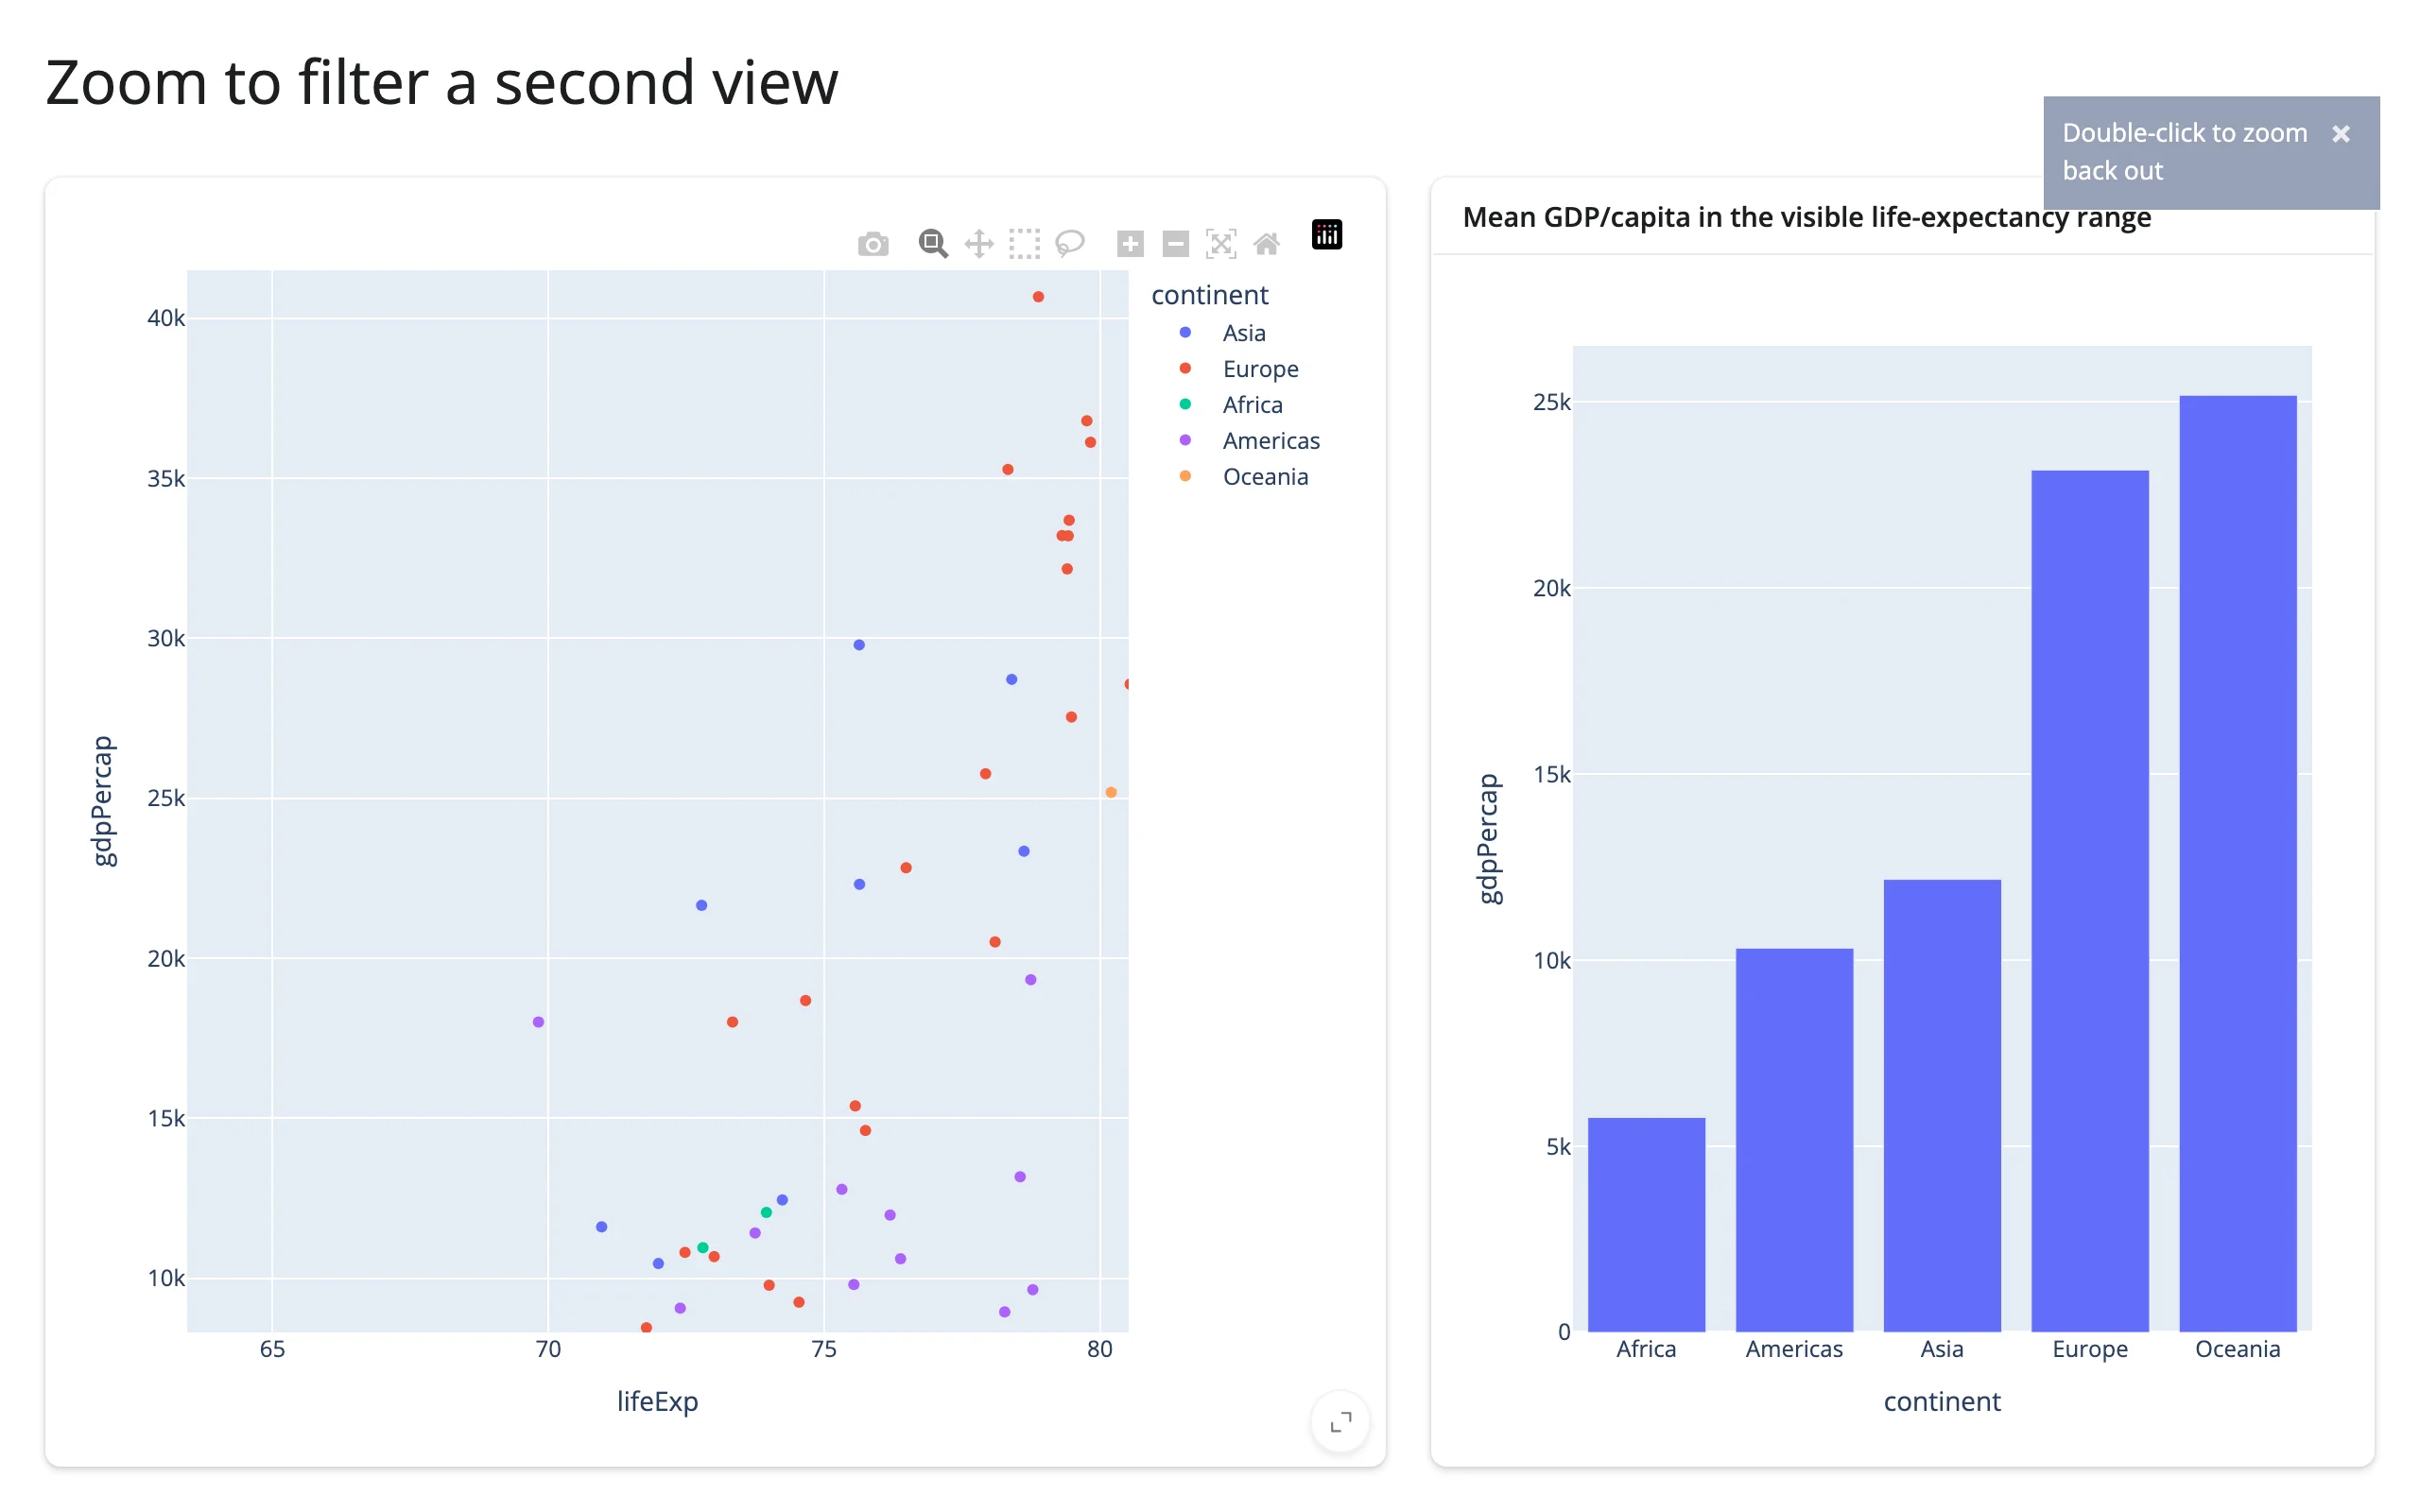
Zoom one plot to filter a second view
relayout()’s filtered axis-range keys are exactly the signal to drive a second, derived view – it stays None through renders, modebar clicks, and selections, firing only on real zoom/pan/autoscale.
import plotly.express as px
from shiny.express import ui
from shinywidgets import render_plotly

df = px.data.gapminder().query("year == 2007").reset_index(drop=True)

ui.page_opts(title="Zoom to filter a second view", fillable=True)

with ui.layout_columns(col_widths=[7, 5]):
    with ui.card(full_screen=True):

        @render_plotly
        def scatter():
            return px.scatter(df, x="lifeExp", y="gdpPercap", color="continent")

    with ui.card(full_screen=True):
        ui.card_header("Mean GDP/capita in the visible life-expectancy range")

        @render_plotly
        def summary_bar():
            axes = scatter.relayout() or {}
            if "xaxis.range[0]" in axes:
                lo, hi = axes["xaxis.range[0]"], axes["xaxis.range[1]"]
                visible = df[df["lifeExp"].between(lo, hi)]
            else:
                visible = df
            means = visible.groupby("continent", as_index=False)["gdpPercap"].mean()
            return px.bar(means, x="continent", y="gdpPercap")
Full range, then zoomed to a high-life-expectancy band – the bar chart recomputes its aggregate for just the visible countries (this view is re-rendered on purpose: the aggregation changes which bars exist, so there’s no fixed set of traces to restyle in place):
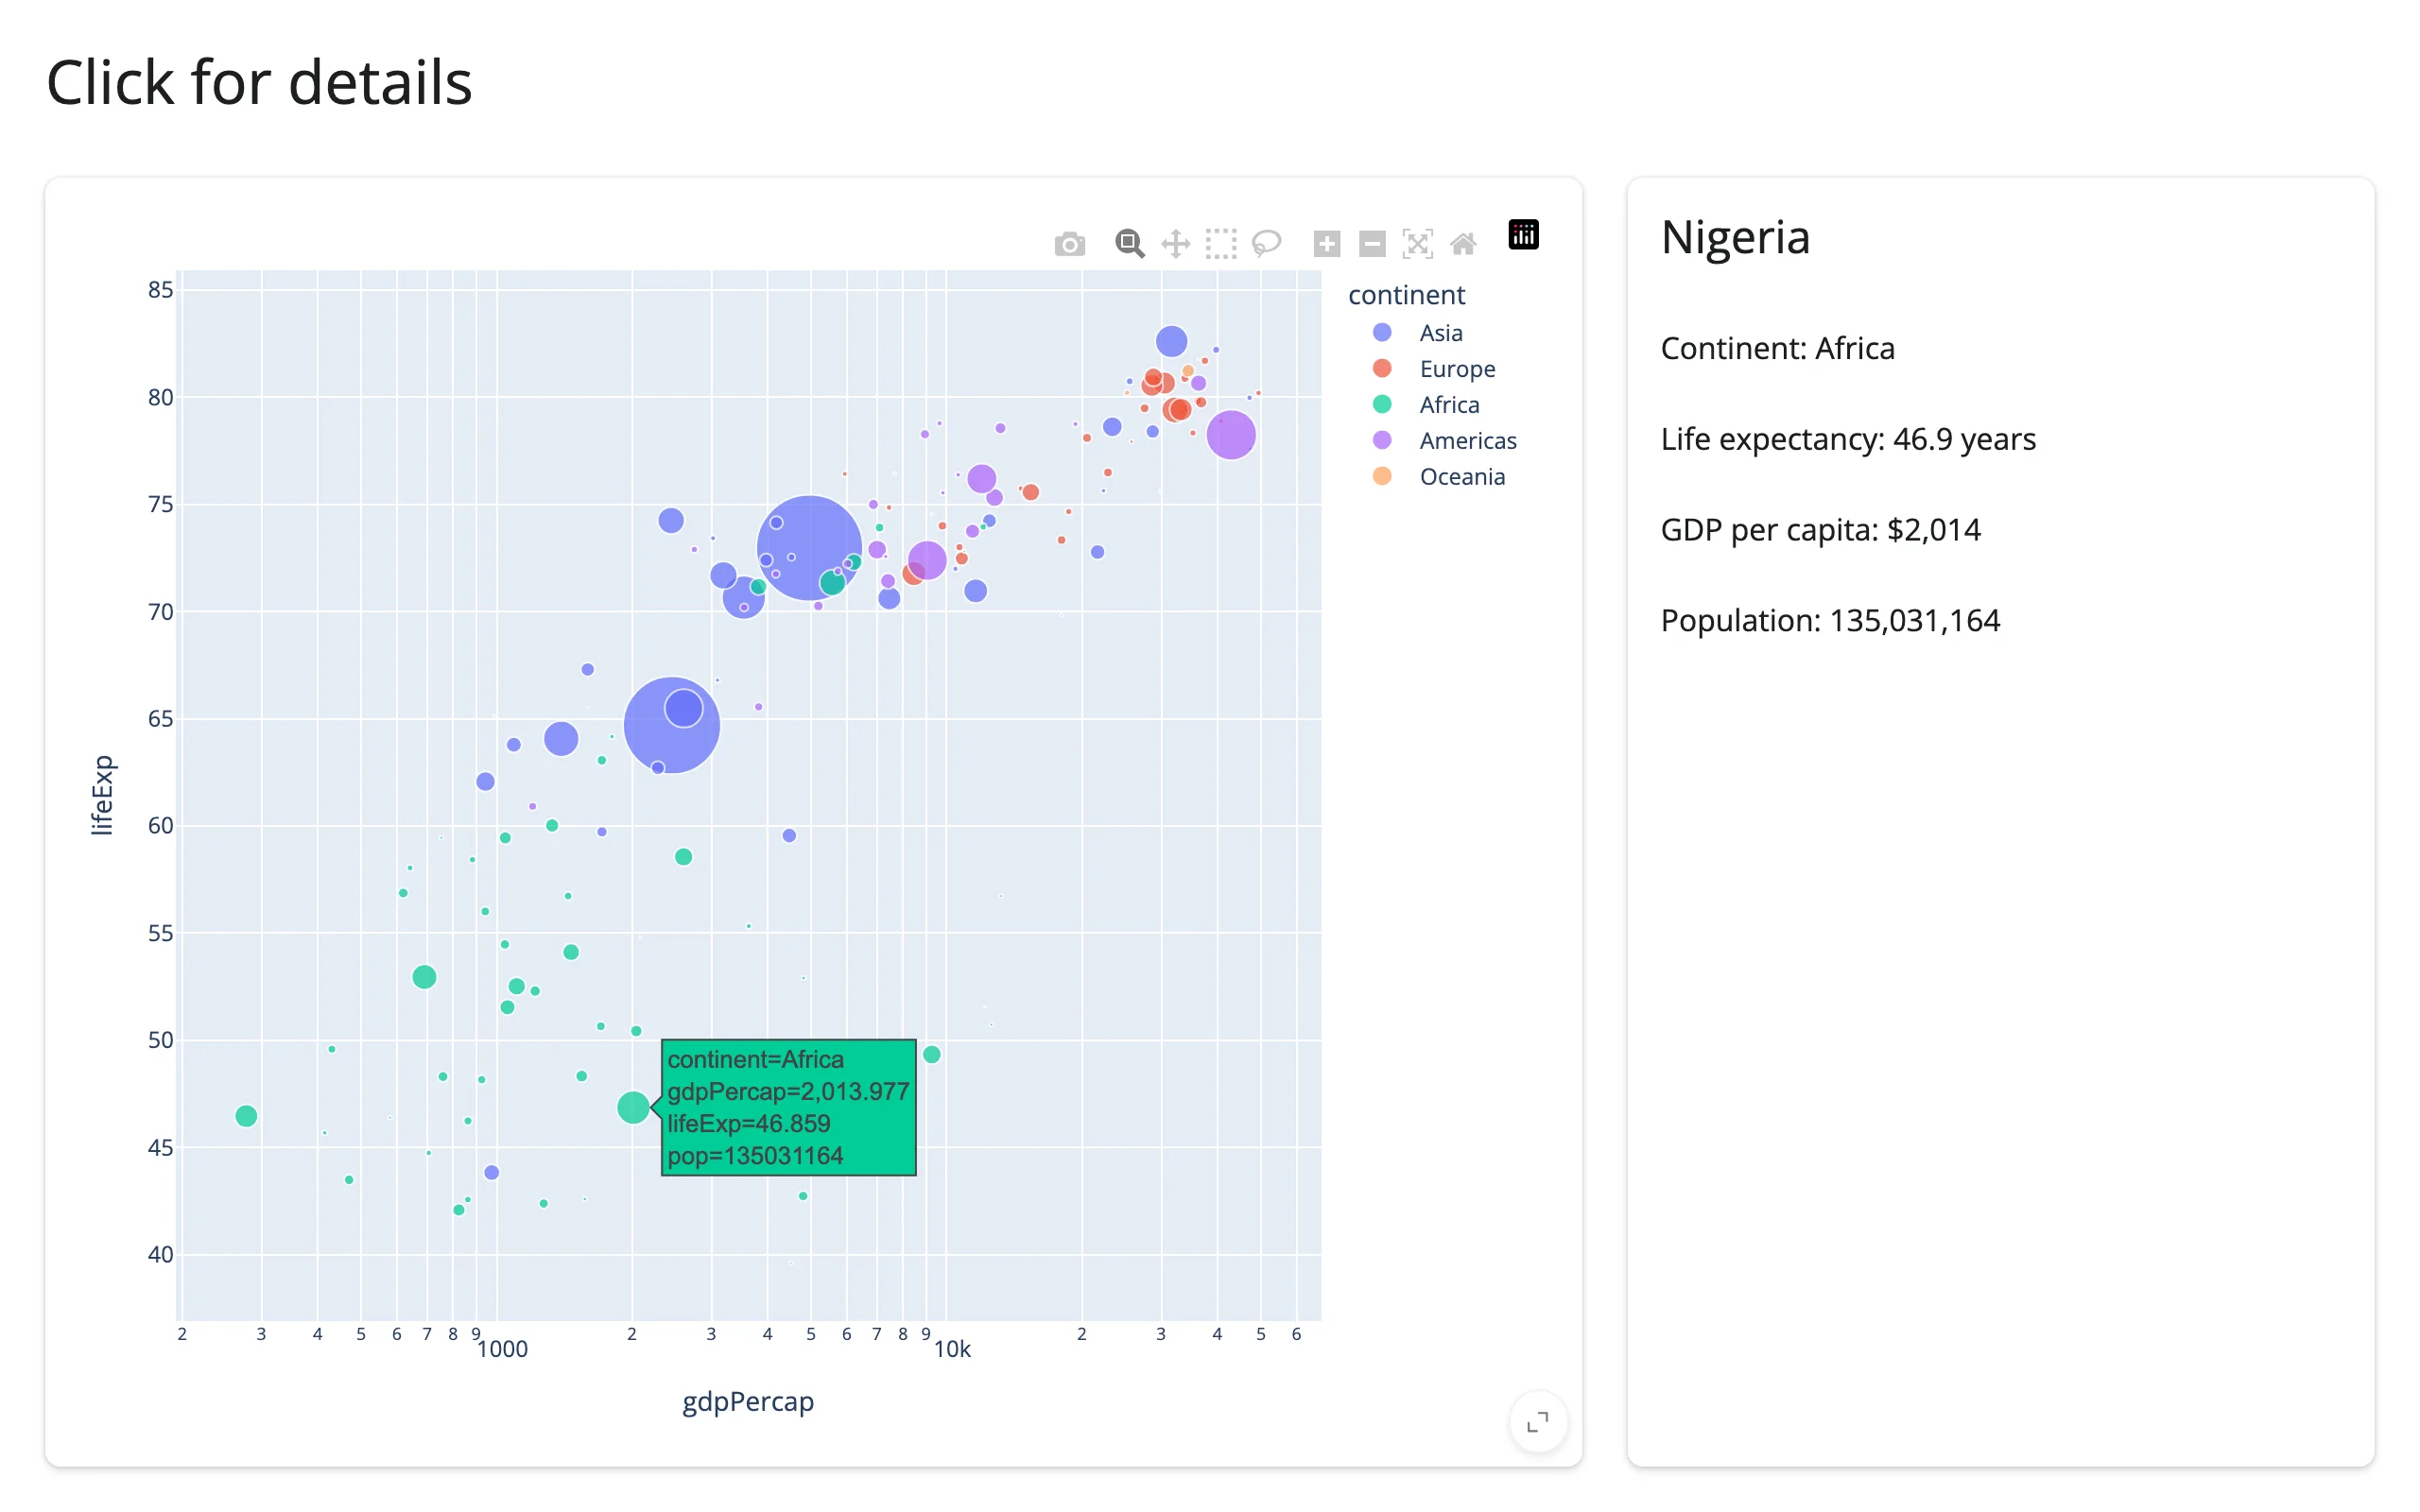
Click a point, show a detail card
import plotly.express as px
from shiny.express import render, ui
from shinywidgets import render_plotly

df = px.data.gapminder().query("year == 2007").reset_index(drop=True)

ui.page_opts(title="Click for details", fillable=True)

with ui.layout_columns(col_widths=[8, 4]):
    with ui.card(full_screen=True):

        @render_plotly
        def plot():
            return px.scatter(
                df,
                x="gdpPercap",
                y="lifeExp",
                color="continent",
                log_x=True,
                size="pop",
                size_max=40,
                custom_data=[df.index],
            )

    with ui.card():

        @render.ui
        def detail():
            pts = plot.clicked()
            if pts is None:
                return ui.p("Click a bubble for details.", class_="text-muted")
            # px wraps each point's custom_data in a list; [0] is the row index.
            row = df.loc[pts["customdata"].iloc[0][0]]
            return ui.TagList(
                ui.h4(row["country"]),
                ui.p(f"Continent: {row['continent']}"),
                ui.p(f"Life expectancy: {row['lifeExp']:.1f} years"),
                ui.p(f"GDP per capita: ${row['gdpPercap']:,.0f}"),
                ui.p(f"Population: {row['pop']:,}"),
            )
Large data
go.Scattergl/render_mode="webgl" draws points on the GPU instead of SVG; above about 10,000 points, swap go.Scatter/px.scatter for it. Return (figure, config) from the render function to pass Plotly.js config options (here, hiding the modebar) the same way Dash’s dcc.Graph(figure=, config=) does – this is the “draw it with the GPU in the browser” approach from Large data & performance:
import numpy as np
import plotly.graph_objects as go
from shiny.express import ui
from shinywidgets import render_plotly

rng = np.random.default_rng(0)
n = 200_000
x = rng.normal(size=n)
y = x * 0.6 + rng.normal(size=n)

ui.page_opts(title="200k points", fillable=True)


@render_plotly
def big_scatter():
    fig = go.Figure(
        go.Scattergl(x=x, y=y, mode="markers", marker=dict(size=3, opacity=0.3))
    )
    return fig, {"displayModeBar": False}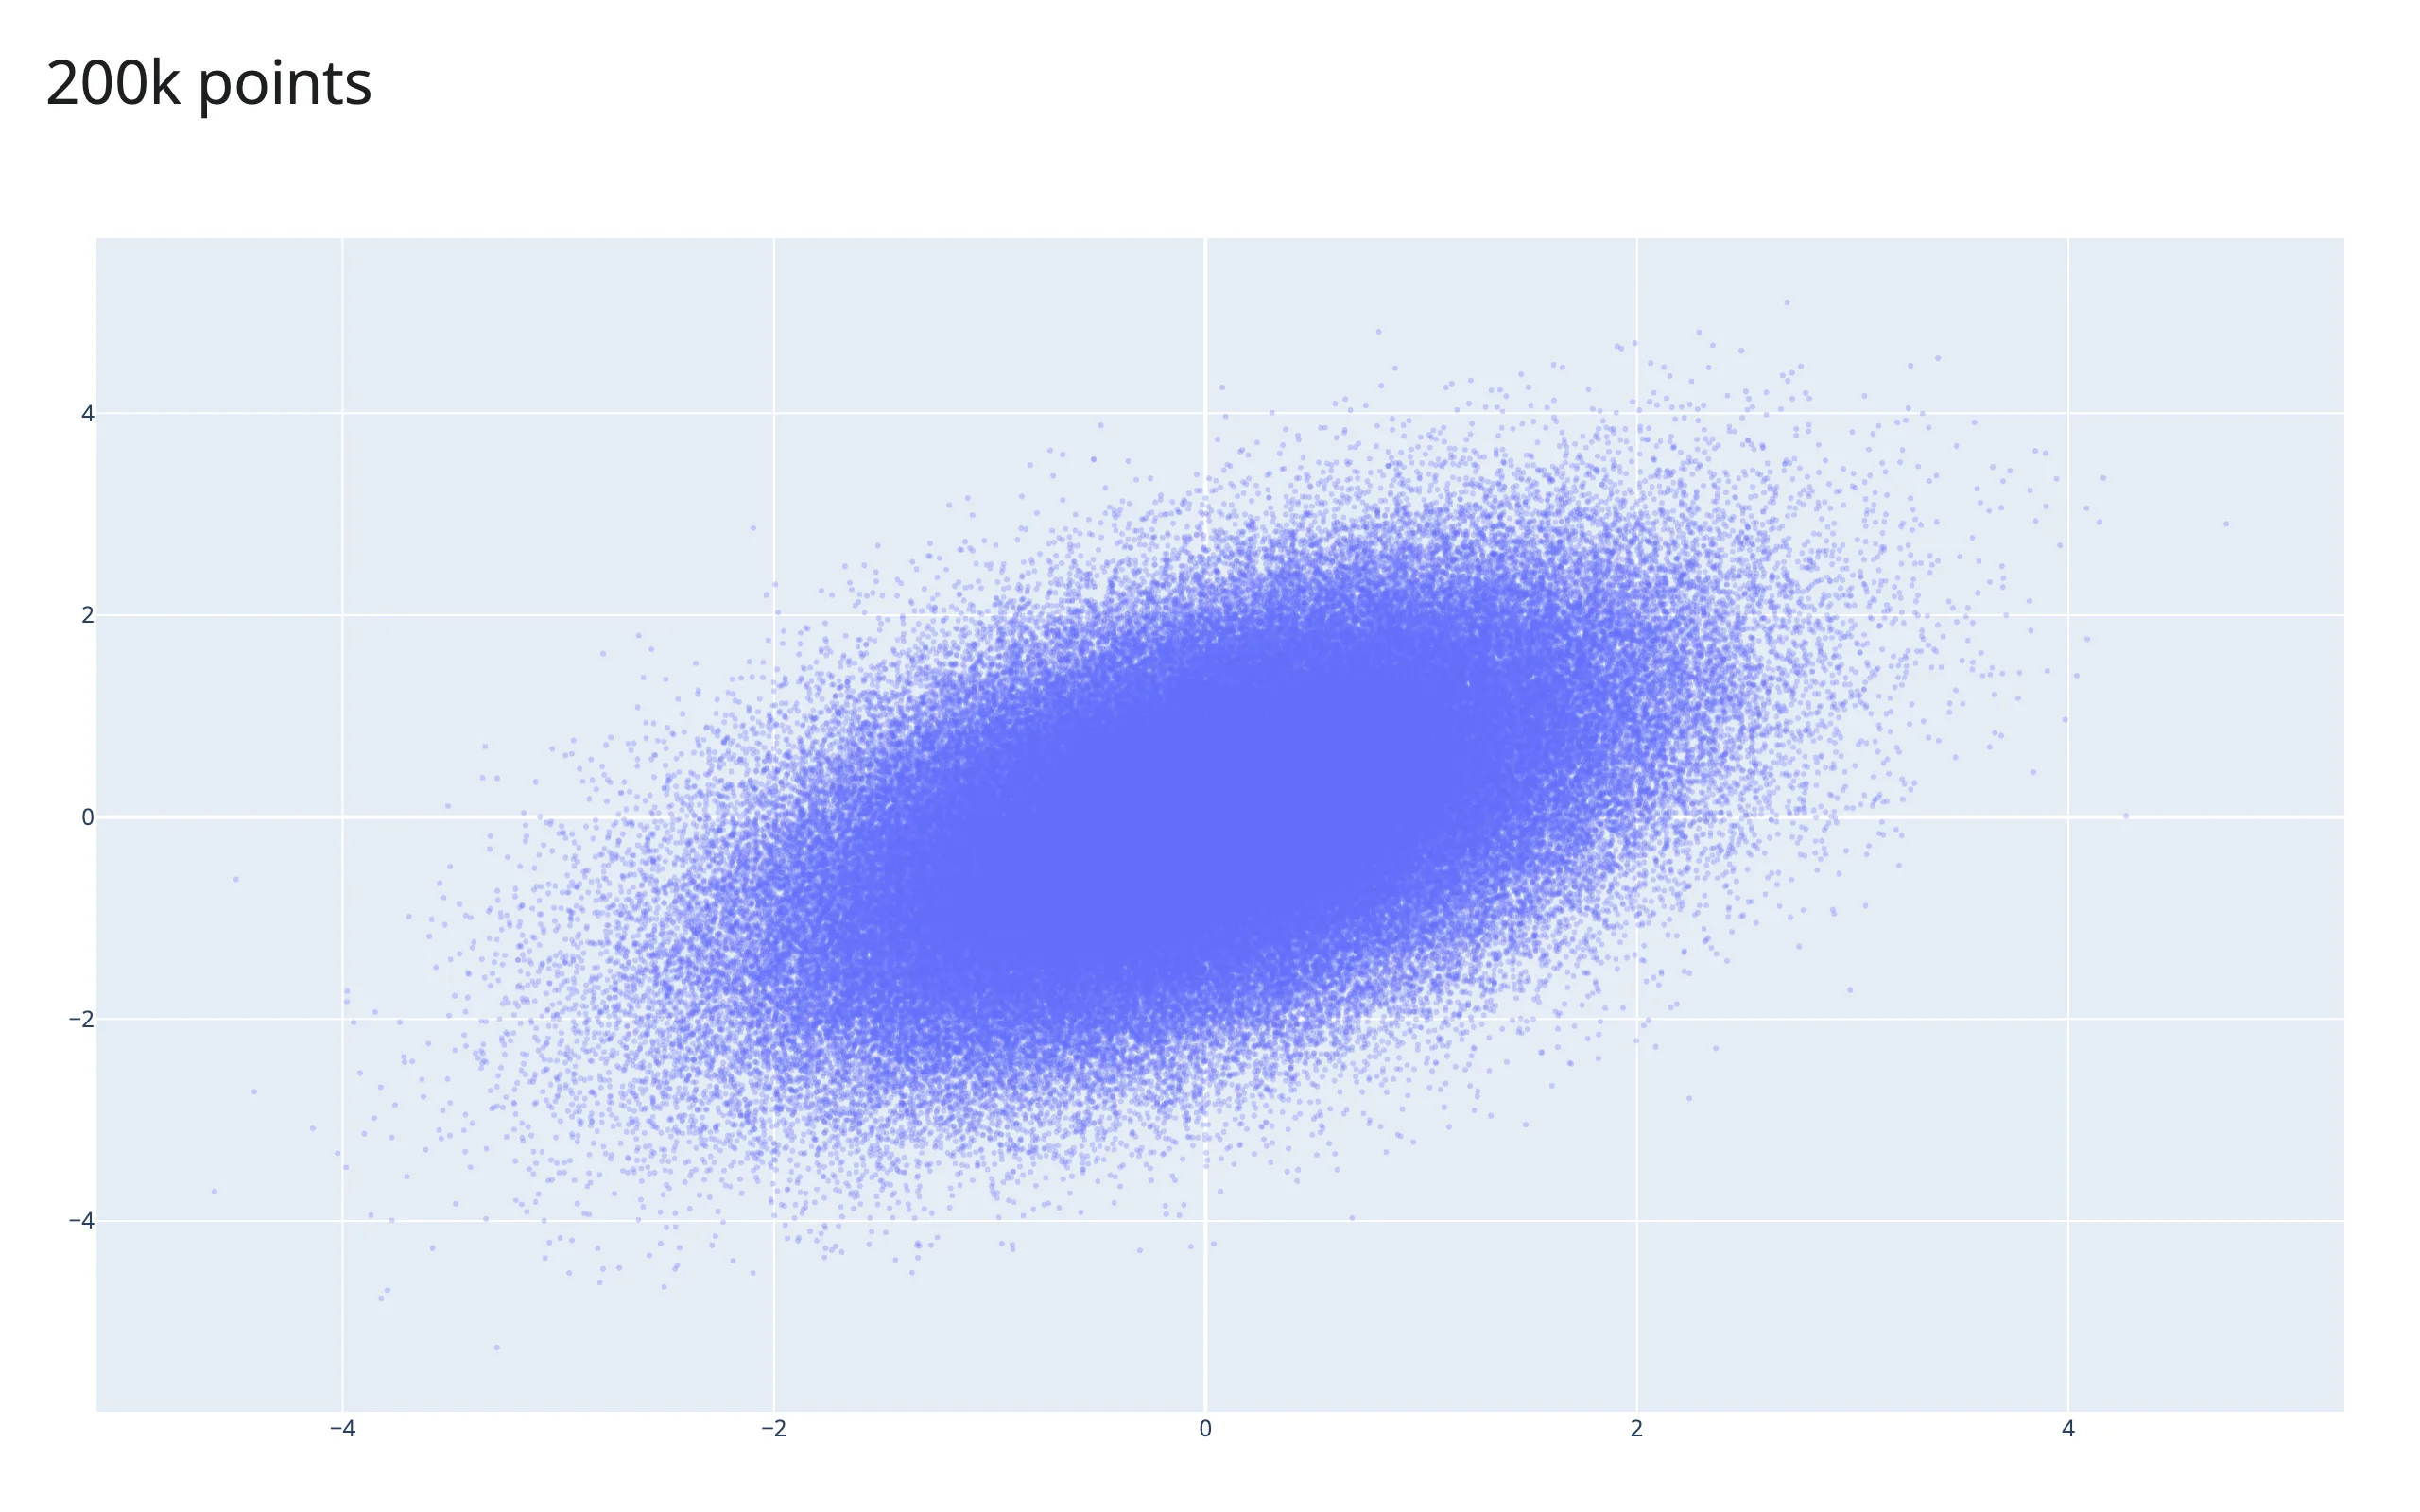
200k points render in well under a second. Numeric arrays travel to the browser as base64-encoded binary, so a float32 array (x.astype("float32")) roughly halves that payload for very large traces.
At real scale (millions of rows), a raw-point lasso selection is an anti-pattern – its payload and server-side work grow with the SELECTION, not a fixed output size. See Linking widgets, pattern 7: brushing large data for a measured comparison against pushing summaries (datashader raster, Mosaic crossfilter) instead.
Layout and sizing
A figure fills its output by default; shinywidgets also trims plotly’s 80px default margins down to l=16, r=16, t=32, b=16 and sets responsive: True so the fill actually tracks the container (plotly 6 otherwise needs that config flag to resize on its own).
Giving the figure its own layout.height opts it out of filling – it renders at that fixed height instead. @render_plotly(height="300px") (or output_widget(id, height="300px")) also sizes the plot to that height directly, whether or not fillable is set – verified on current main (fillable defaults to False once height is given, and either way the plot settles at exactly 300px, not plotly’s own 360px fallback).
import plotly.express as px
from shiny.express import ui
from shinywidgets import render_plotly

df = px.data.iris()

ui.page_opts(title="Sizing", fillable=True)

with ui.card(full_screen=True):
    "Fills its card (no explicit height) -- try full_screen"

    @render_plotly
    def fills():
        return px.scatter(df, x="sepal_width", y="sepal_length", color="species")


with ui.card():
    "Fixed height: an explicit height= sizes the plot directly"

    @render_plotly(height="300px")
    def fixed():
        return px.scatter(df, x="sepal_width", y="sepal_length", color="species")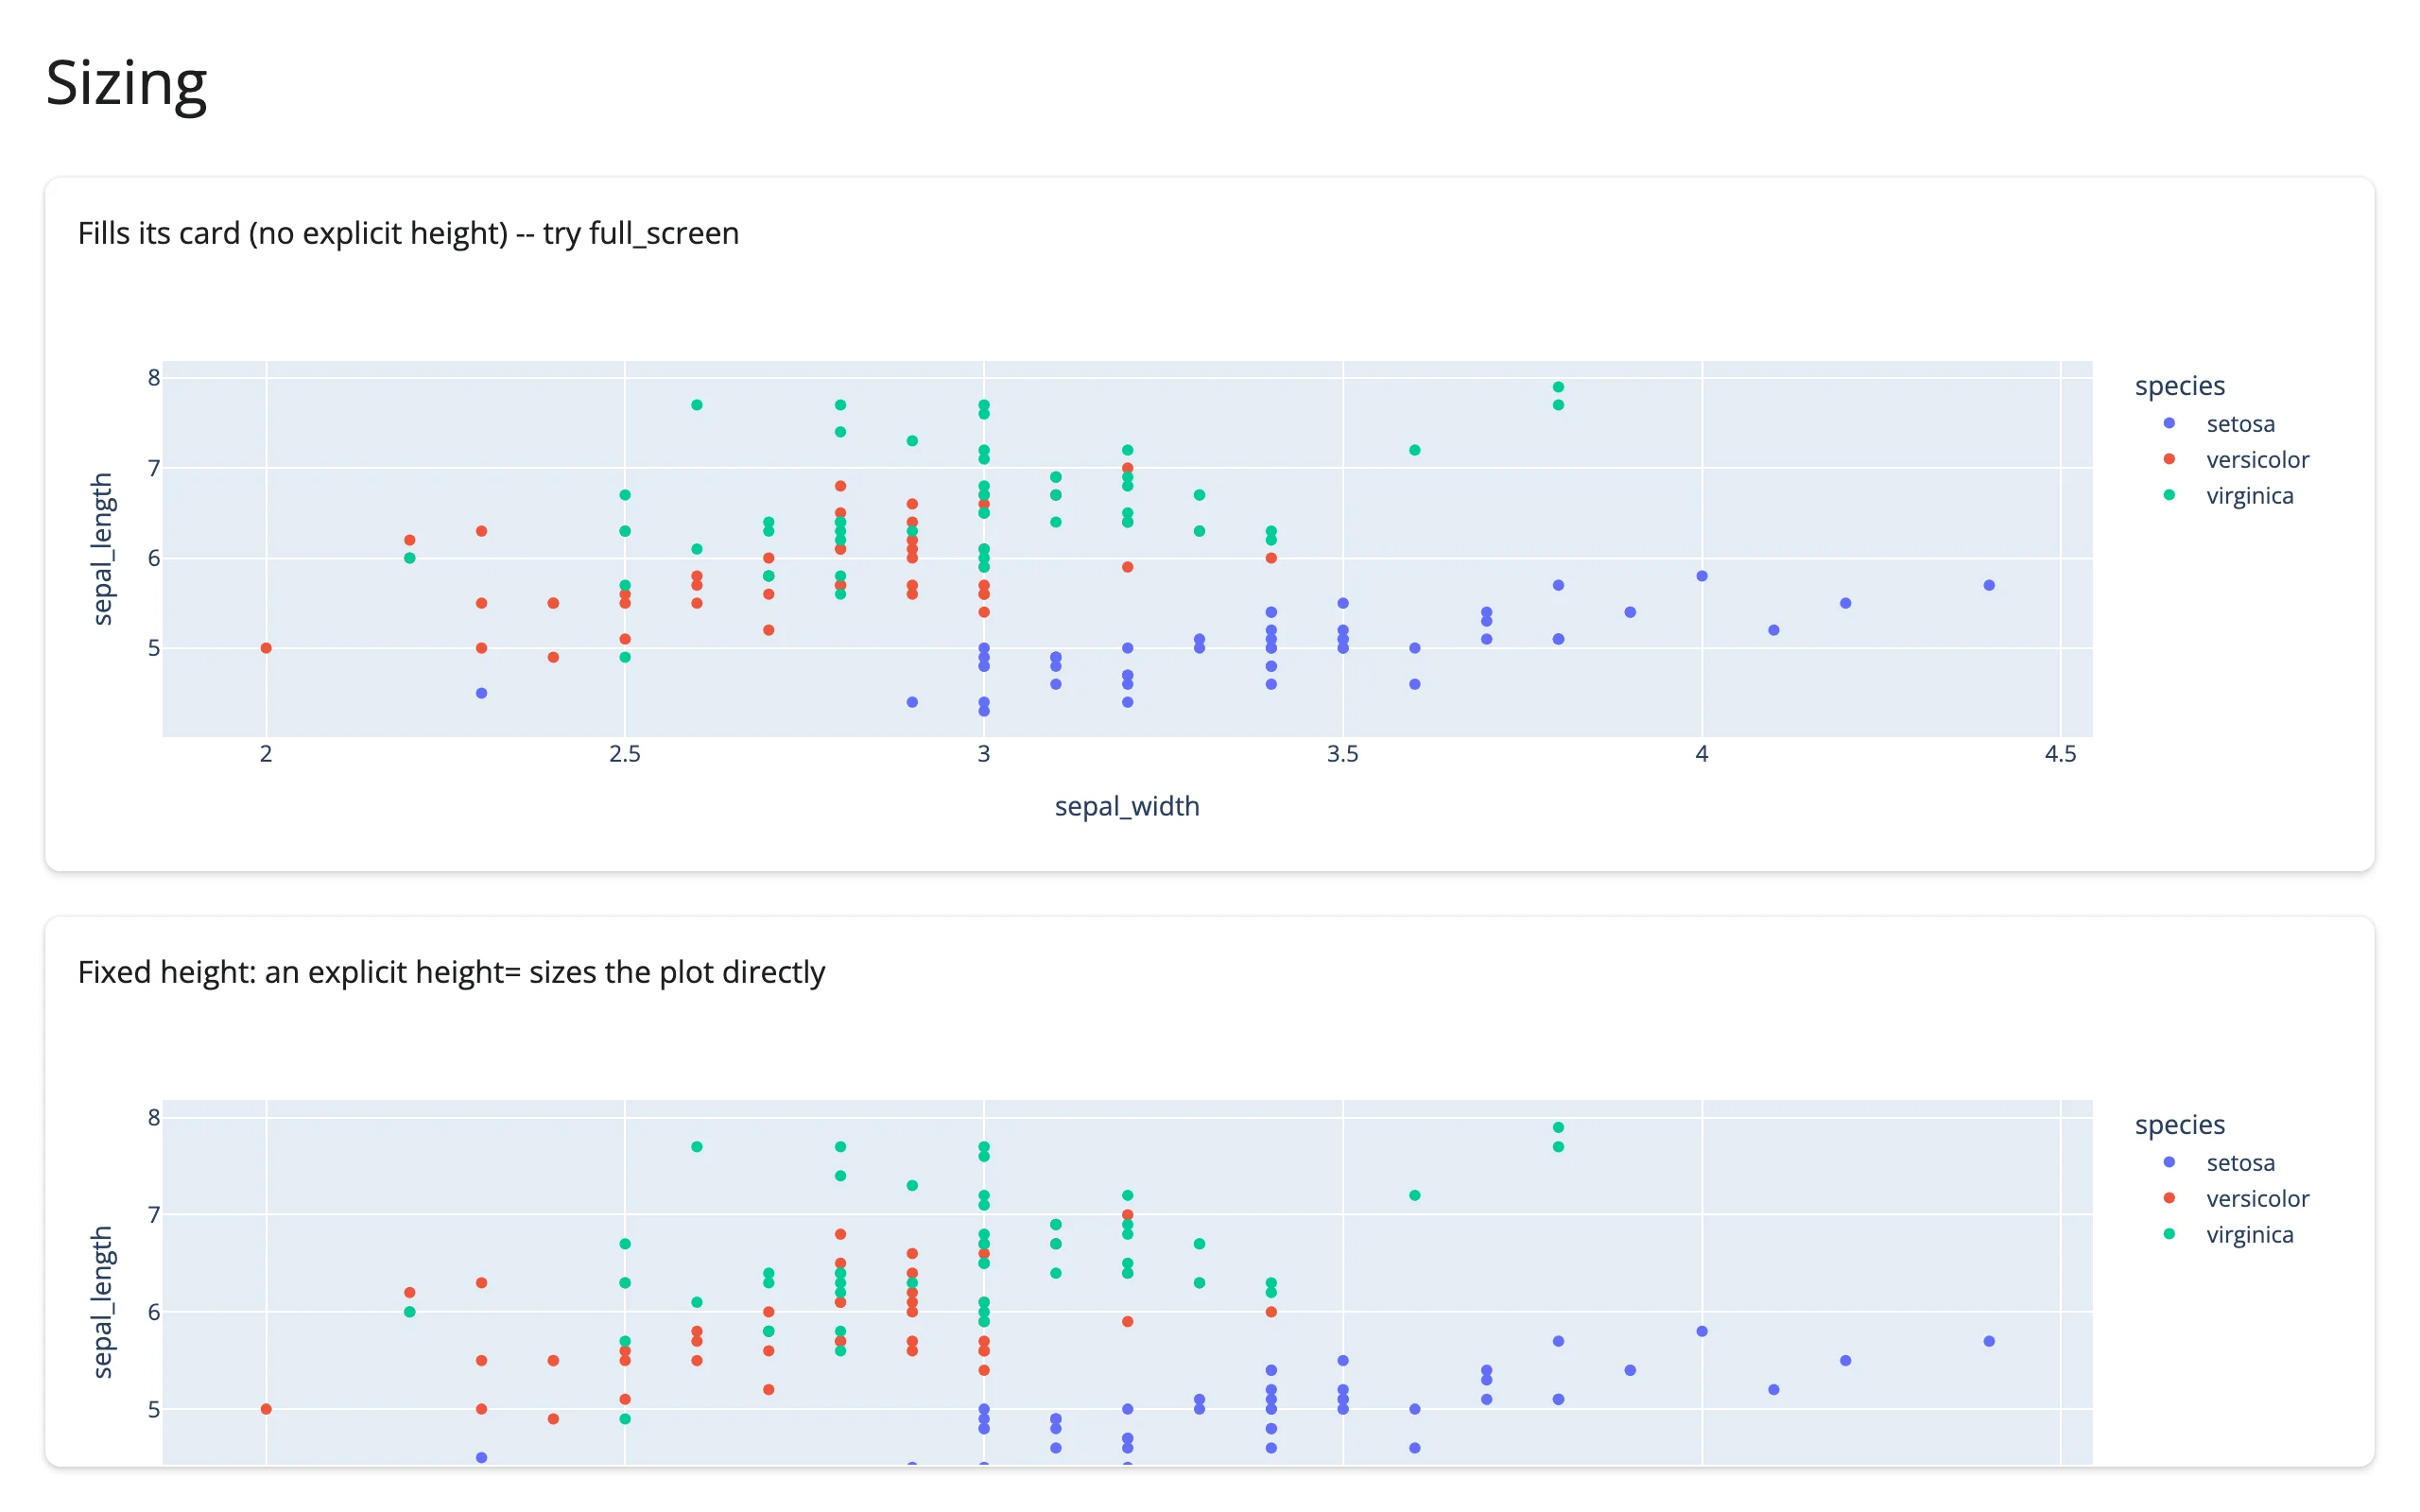
ui.card(full_screen=True) and sidebar collapse/expand all resize the figure correctly – plotly listens for container resizes once responsive is set.
Gotchas and limitations
Verified on current main (plotly 6.9.0, shiny 1.9.0):
- A double-click only clears
clicked()if it lands on empty background. Double-clicking a point leavesclicked()showing that point (the second click re-fires after the internal clear). This isn’t mentioned in the docstring; see “Clearing semantics” above. - A plain click resets
selected()/brushed()whendragmodeis"select"/"lasso". This is plotly.js treating the click as a zero-area selection, not a shinywidgets bug, but it means click-to-inspect and lasso-to-filter interactions sharing one figure will clear each other – see the gallery template, which documents this inline rather than fighting it. relayout()ranges are log10 on a log axis, butbrushed()/selected()coordinates are always in data units, even on the same log axis. Mixing the two without converting will silently misfilter.- A re-render blanks the plot for roughly a second (plotly.js reloading its ~5MB code bundle) before the rebuilt figure appears; worse on a loaded machine. In-place updates (
.widget+batch_update/batch_animate) have no such gap – see “Updating the widget from Python”. double_clicked()doesn’t fire on a 3D scene. Verified on current main: double-clicking ascatter_3dplot’s background never dispatchesplotly_doubleclick(confirmed with a direct JS listener; the gesture just registers as two tiny camera-orbitrelayoutevents), so a 3D view reset isn’t observable this way. It does fire as documented on cartesian,scattermap/mapbox, and ternary charts.customdatais wrapped in a list per point byplotly.express(even for a singlecustom_data=[...]column), so reading it directly (rather than throughselected_rows()) needs an extra[0]:pts["customdata"].iloc[0][0]..valueis not the live figure. When the render function returns ago.Figure,.valueis exactly that object;@render_plotlycoerces a copy into.widget. Mutating.valueafter returning it does nothing visible – always mutate.widget.
What we deliberately didn’t chase: the old report’s performance findings about plotly’s ~5MB JS bundle being resent on every re-render (a real, measurable cost, but a cross-cutting anywidget/shinywidgets architecture question, not specific to this guide).
Gallery candidates
template_lasso_explorer.py
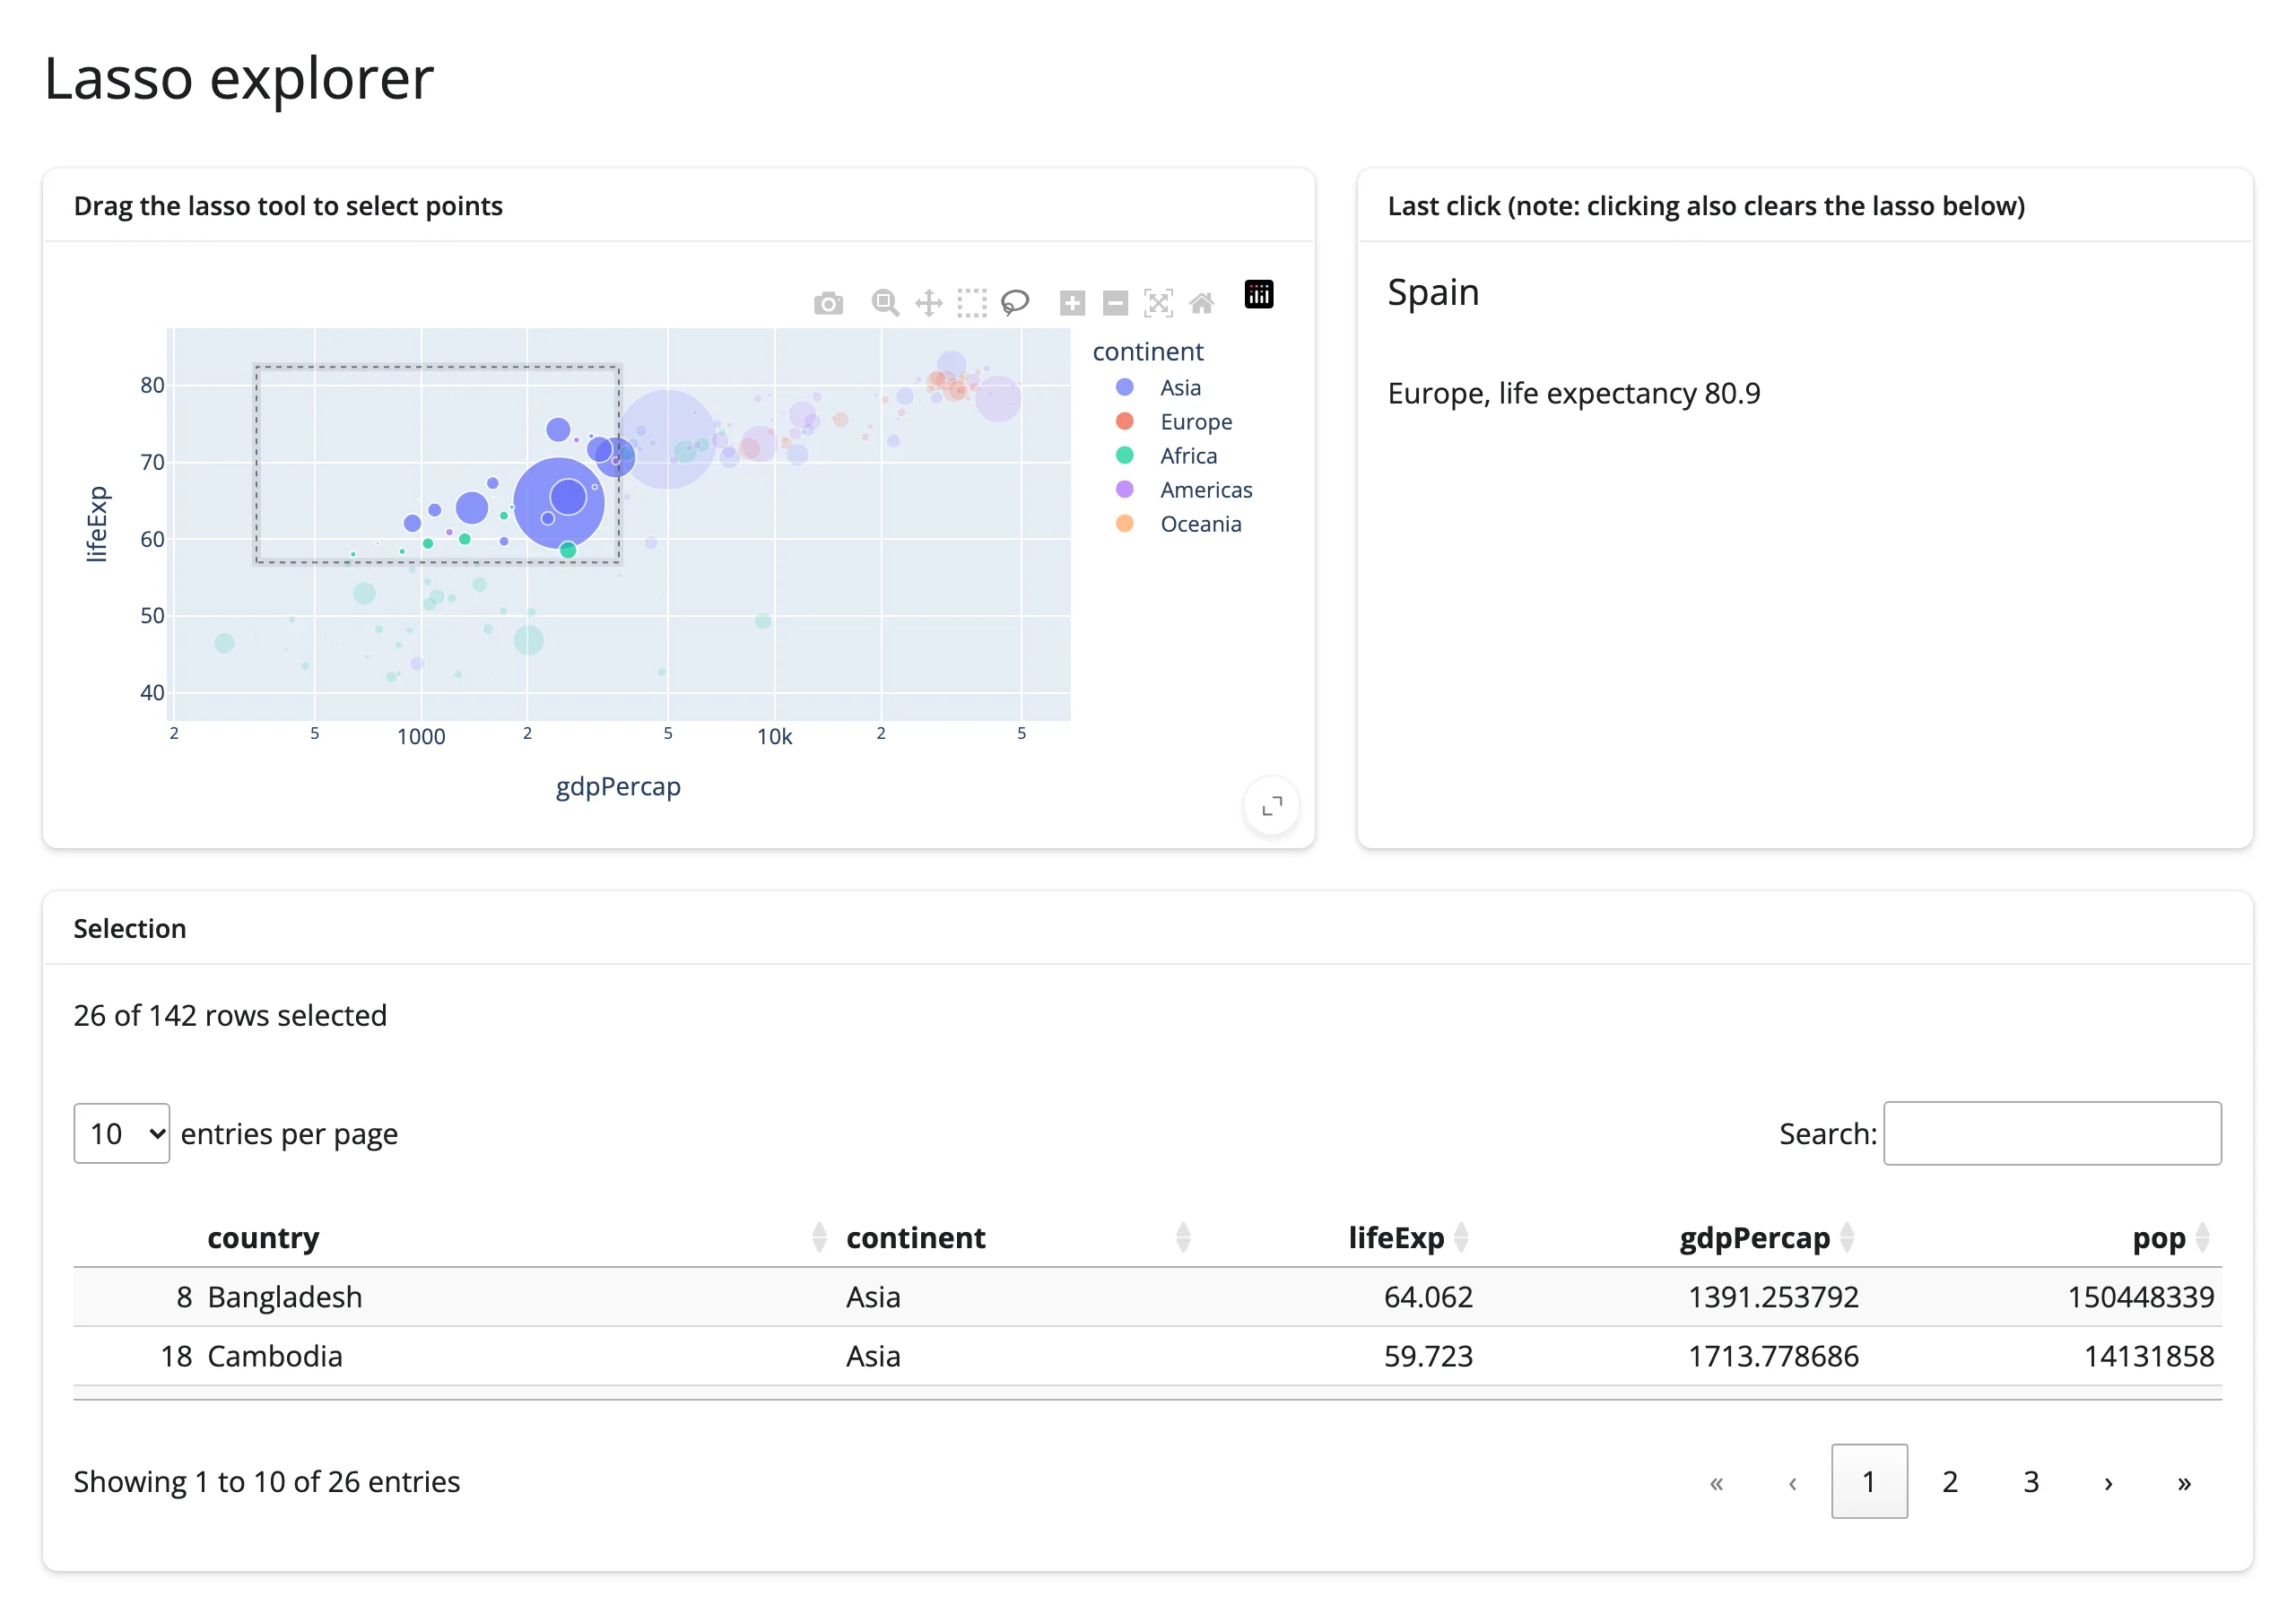
A small, adaptable starting point (bucket: template): lasso points in a scatter plot to filter a searchable table and a one-line summary, with a click-through detail card for a single point. Swap in your own data frame and column names.
showcase_gapminder_explorer.py
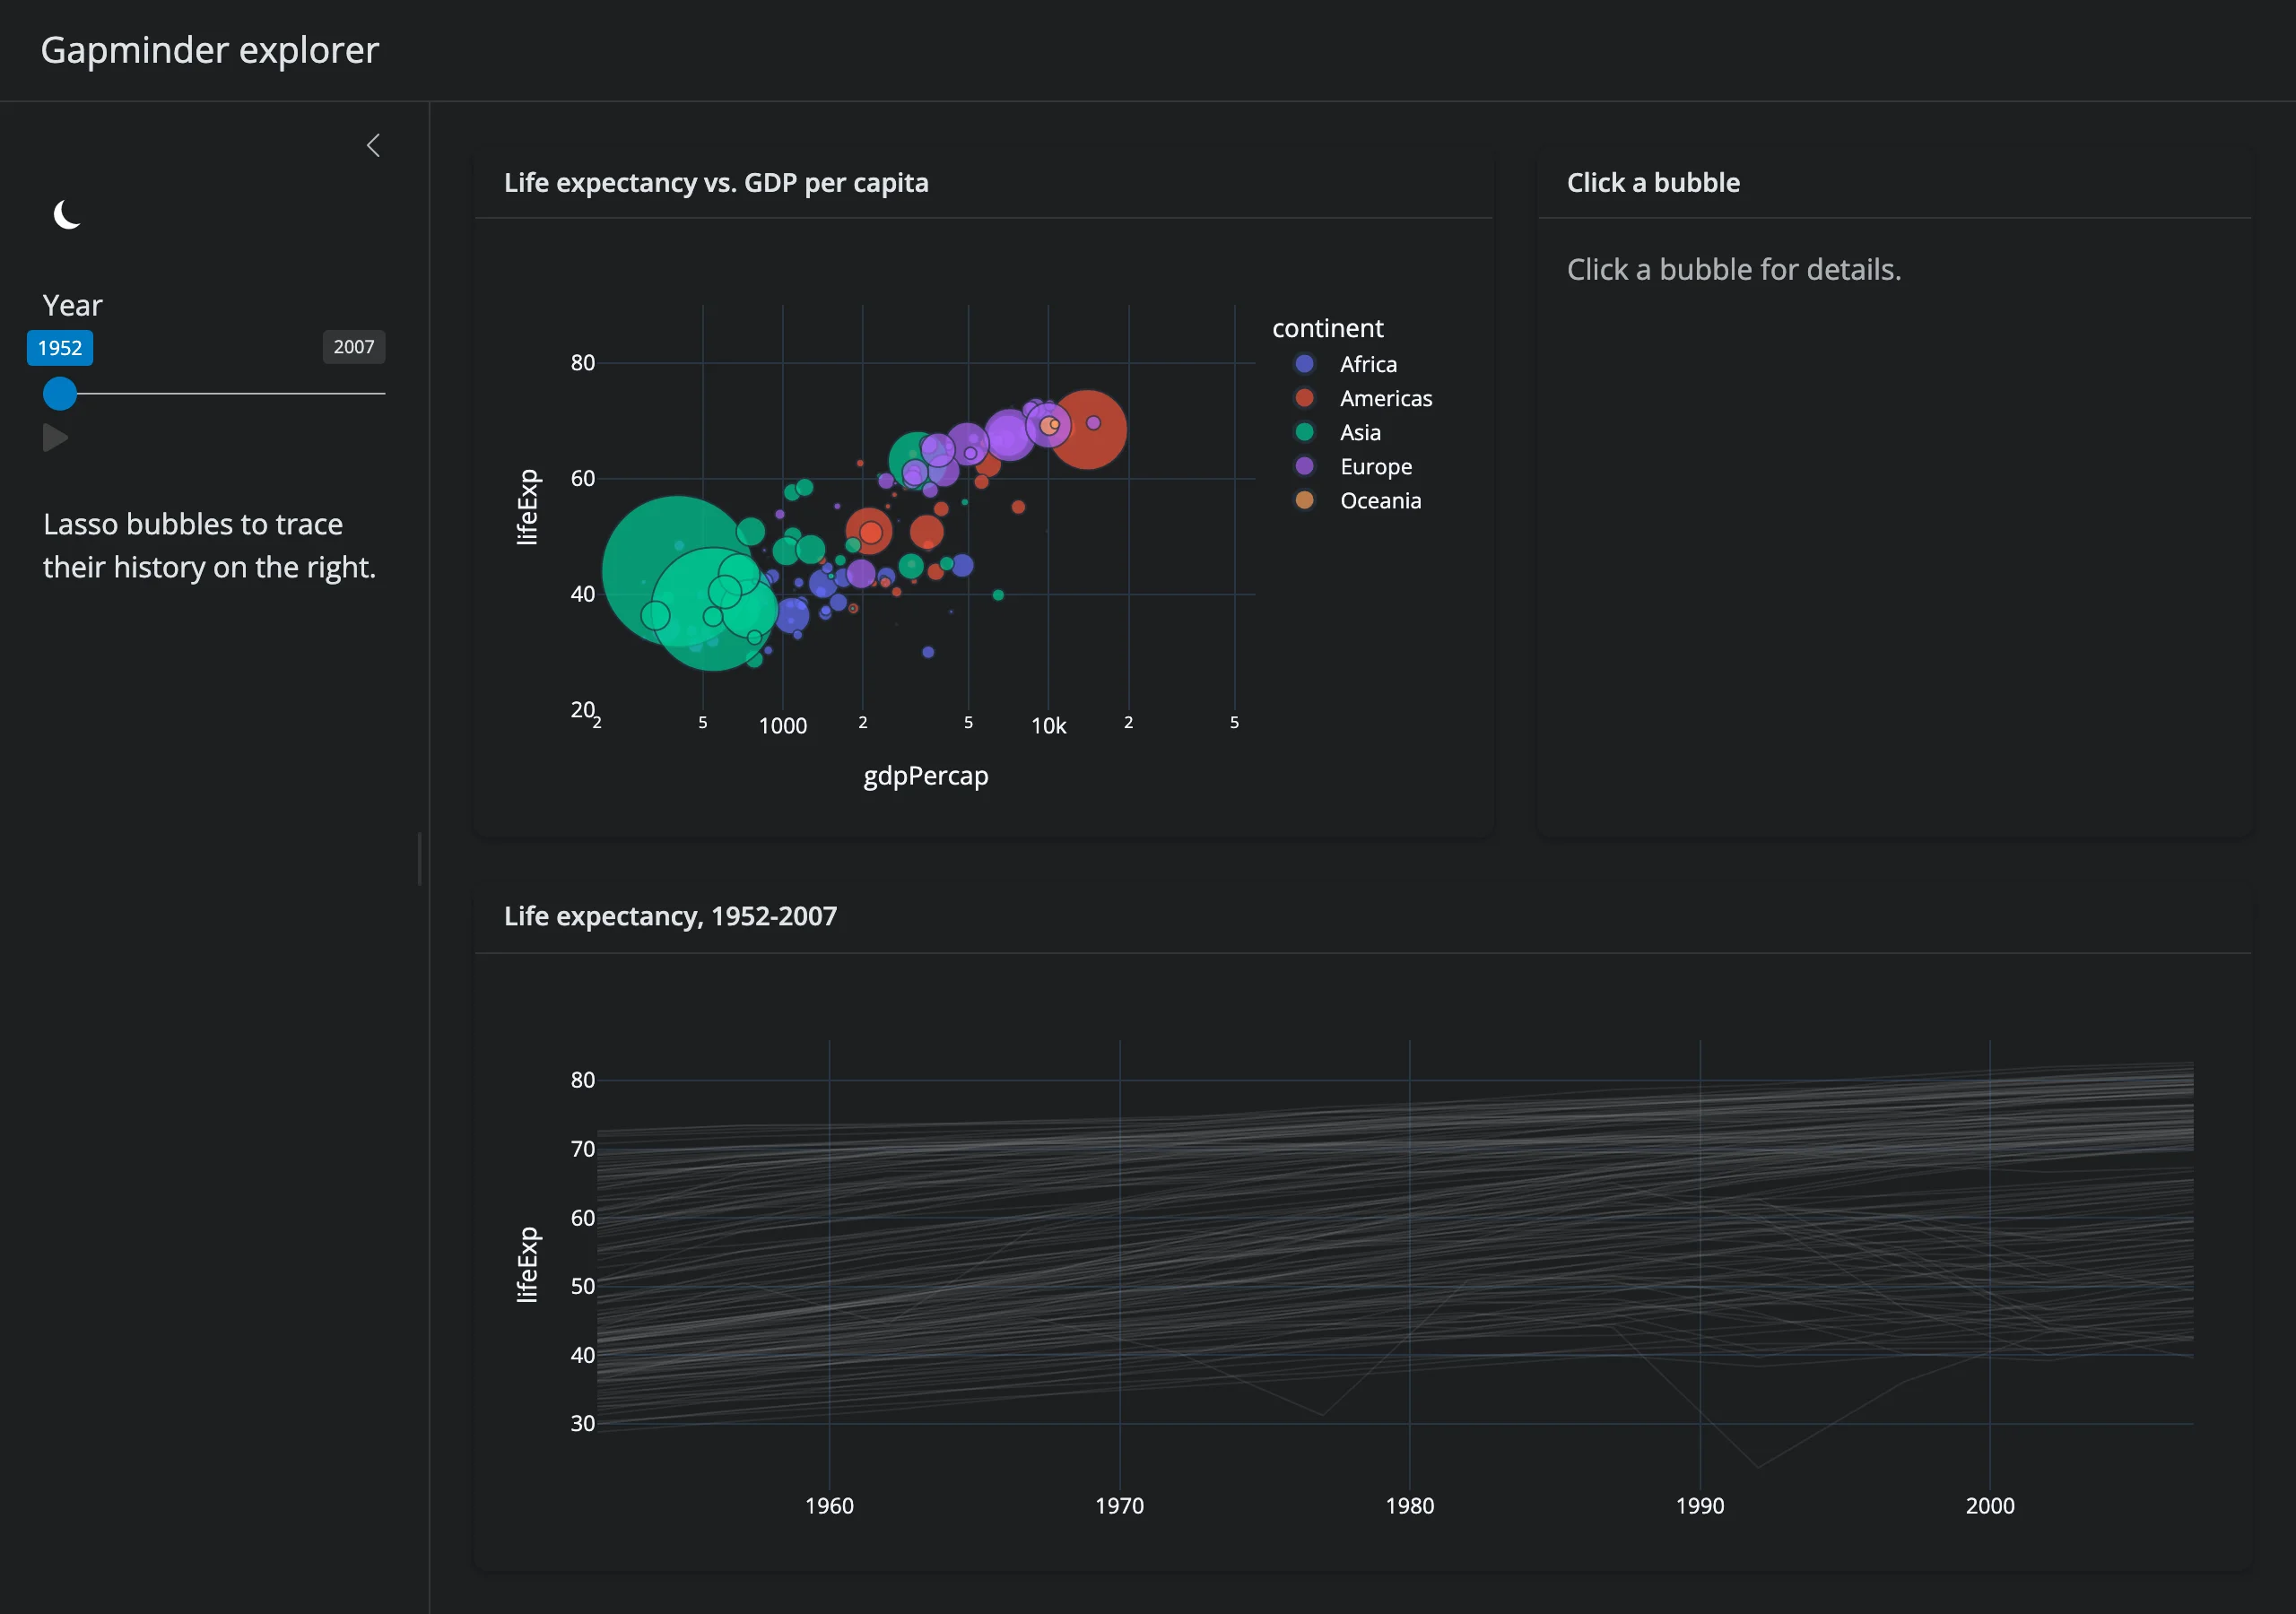
A fuller demo (bucket: showcase) built from the patterns above: a year slider plays a bubble-chart animation via batch_animate (no plotly “frames”), a click shows a detail card, lassoing bubbles highlights their full 1952-2007 history in a 142-country trend chart via in-place batch_update, and a dark-mode toggle swaps templates on both figures while preserving the compact margins.
Learn more
- plotly.express API reference
- plotly graph_objects reference
- Plotly.js configuration options (for the
(figure, config)return form) - Related guides in this roster: altair (declarative selections), bokeh, itables (used above for a linked table), matplotlib for static charts.