ITables
ITables wraps DataTables (the jQuery table library) for pandas and polars, maintained by Marc Wouts. In Jupyter it renders any data frame as an interactive HTML table with almost no code; in Shiny, @render_itables gives you the same table, with layout defaults that make it fill a card and scroll its rows, and a fix for a conflict between itables’ bundled jQuery and the page’s own.
The decorated function returns either a plain data frame (coerced to a default ITable) or an itables.widget.ITable constructed with options – select=True for row selection, buttons=[...] for export, column_filters="header" for per-column search, and the rest of DataTables’ extension catalog (SearchPanes, SearchBuilder, RowGroup, and more). table.selected_rows() reads the selected row positions reactively, like a Shiny input; table.widget lets you update the table in place from Python, including setting the selection programmatically.
Reach for ITables when you want a table that functions like Excel’s AutoFilter plus a global search box, with export built in, and you don’t need to edit cells or handle more than a few hundred thousand rows. For editable cells, virtualized scrolling through very large frames, or Python-defined conditional styling, see render.data_frame (Shiny’s own table output) below, or ipydatagrid for a canvas-based alternative. For a flatter, dependency-light, React-based table see reactable; for a columnar, OLAP-style explorer over very large data see perspective.
Installation
pip install 'shinywidgets[itables]'This installs itables[widget] (itables plus anywidget, which the Shiny integration requires).
Quick start
from __future__ import annotations

import plotly.express as px
from itables.widget import ITable
from shiny.express import ui
from shinywidgets import render_itables

countries = px.data.gapminder().query("year == 2007")[
    ["country", "continent", "lifeExp", "pop", "gdpPercap"]
].reset_index(drop=True)

ui.page_opts(title="itables quickstart", fillable=True)

with ui.card(full_screen=True):
    ui.card_header("142 countries, 2007 (click a row to select it)")

    @render_itables
    def table():
        return ITable(countries, select=True)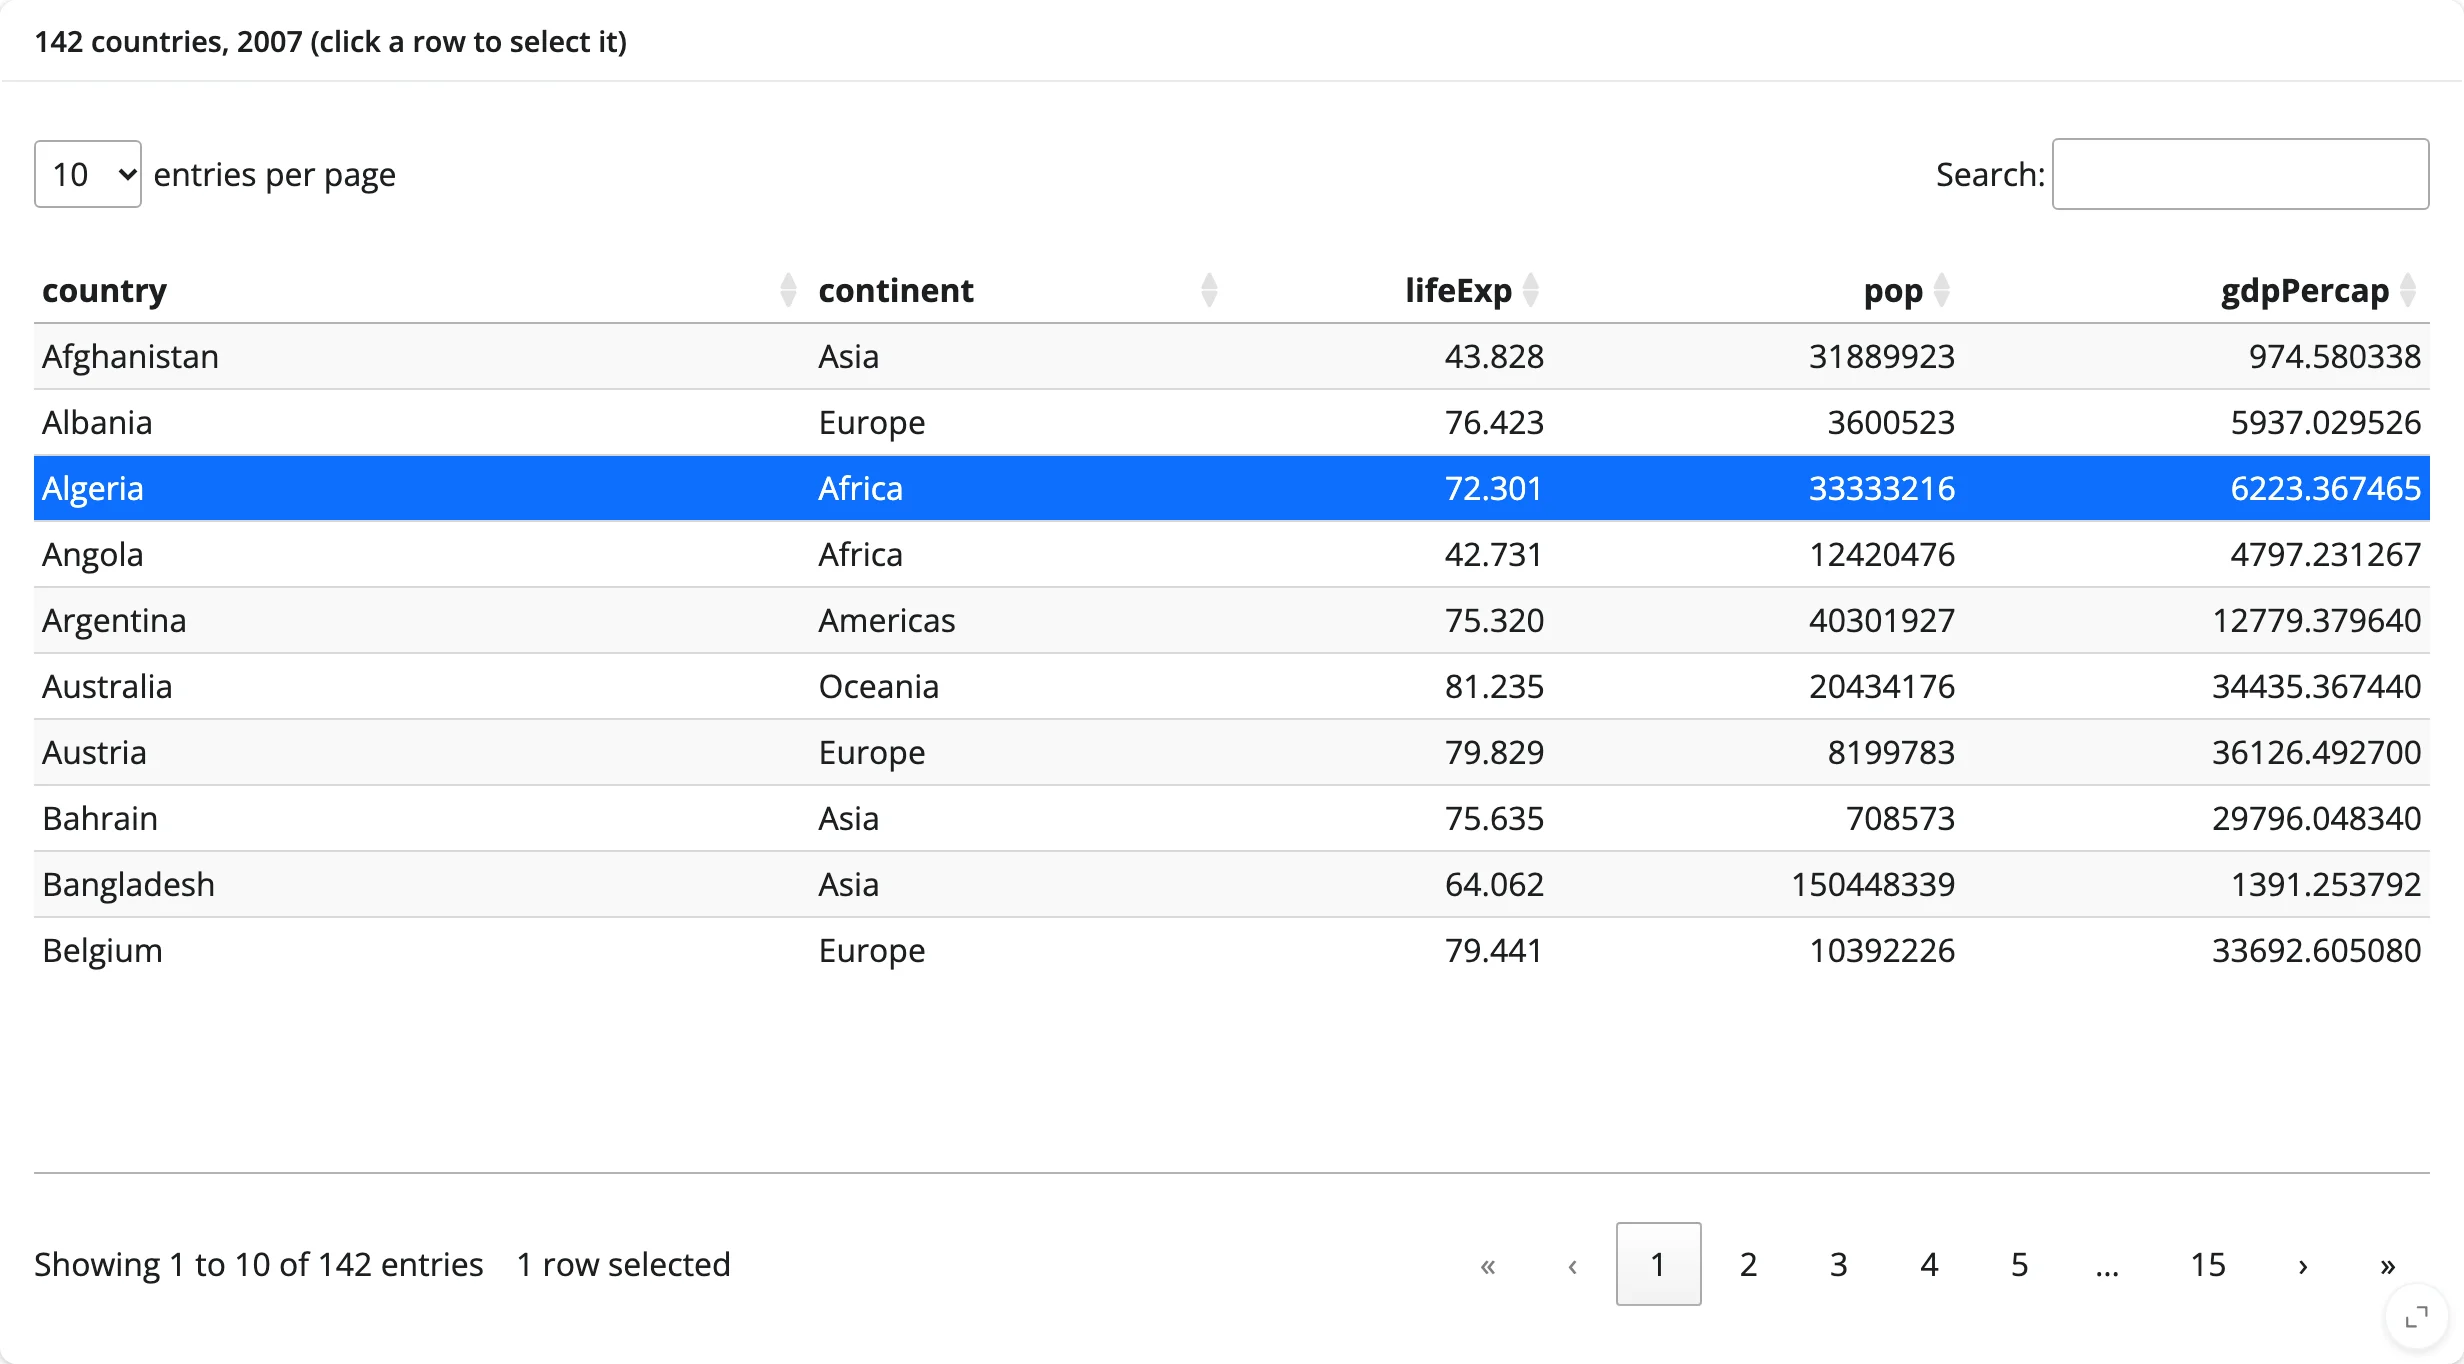
Returning a data frame directly (no ITable(...)) also works, but select=True and every other itables option require constructing an ITable explicitly.
What you can build
Global search plus per-column filters
DataTables’ global search box is on by default. Add column_filters="header" for a text input per column – useful once a table has more than a handful of columns and a single search box starts returning too much.
    @render_itables
    def table():
        # The global search box is on by default; column_filters adds one text
        # input per column, wired to DataTables' own column search.
        return ITable(countries, column_filters="header", select=True)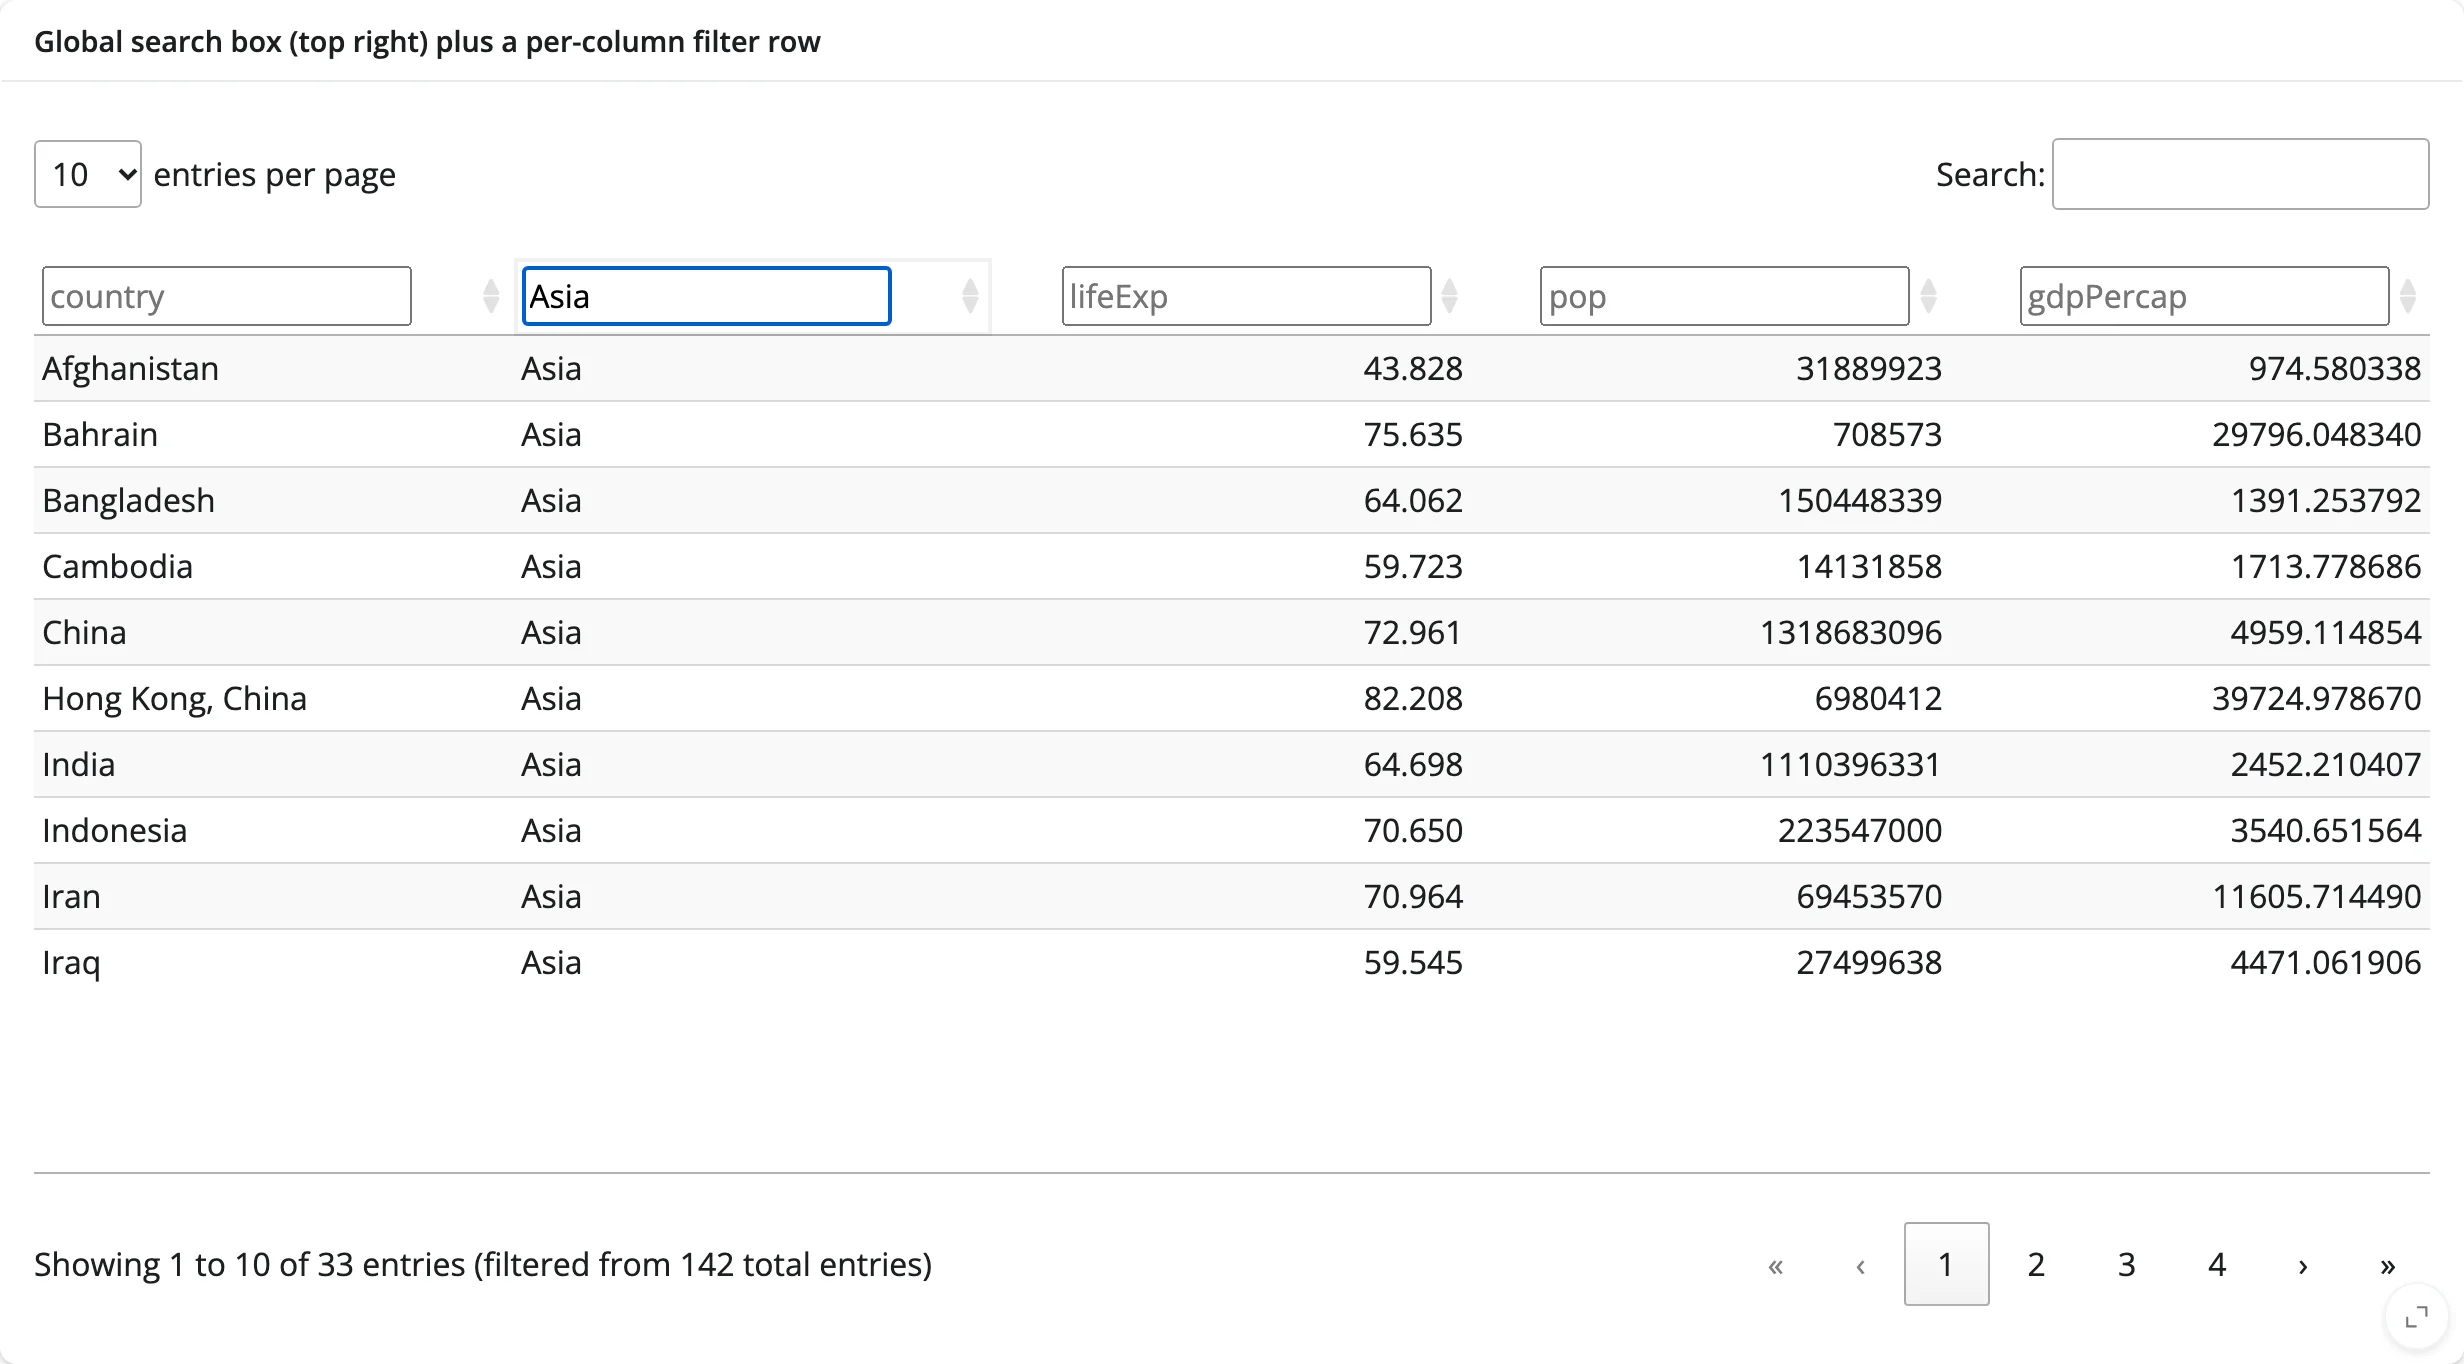
SearchPanes: faceted filtering
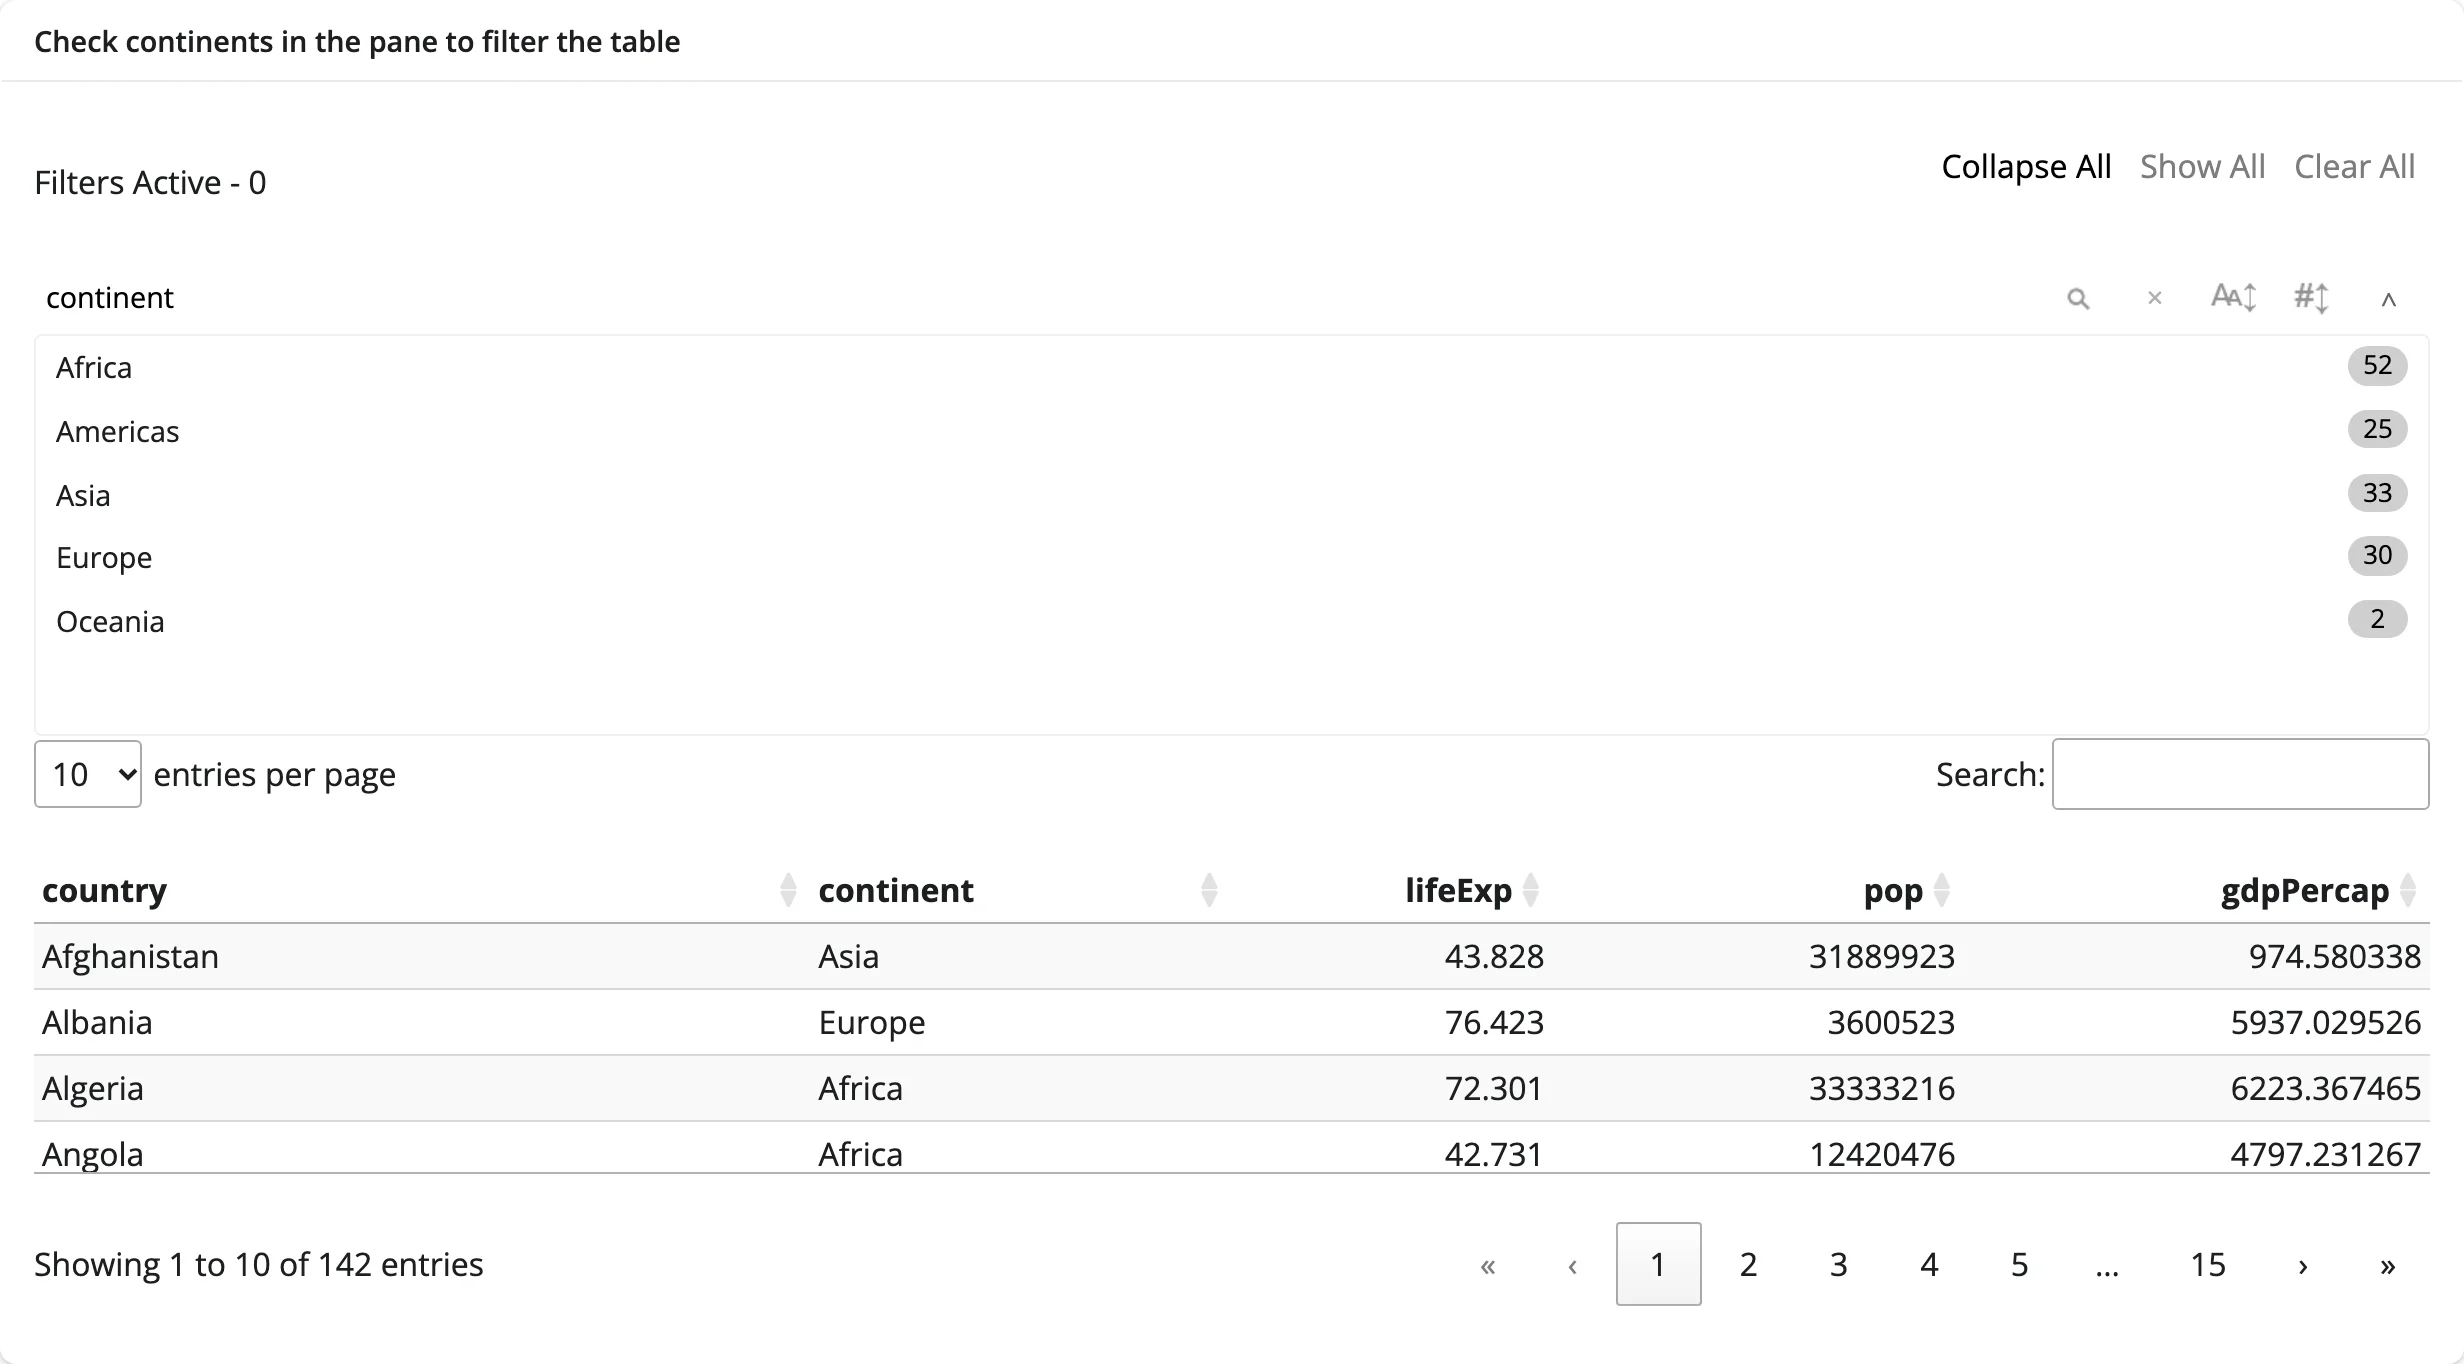
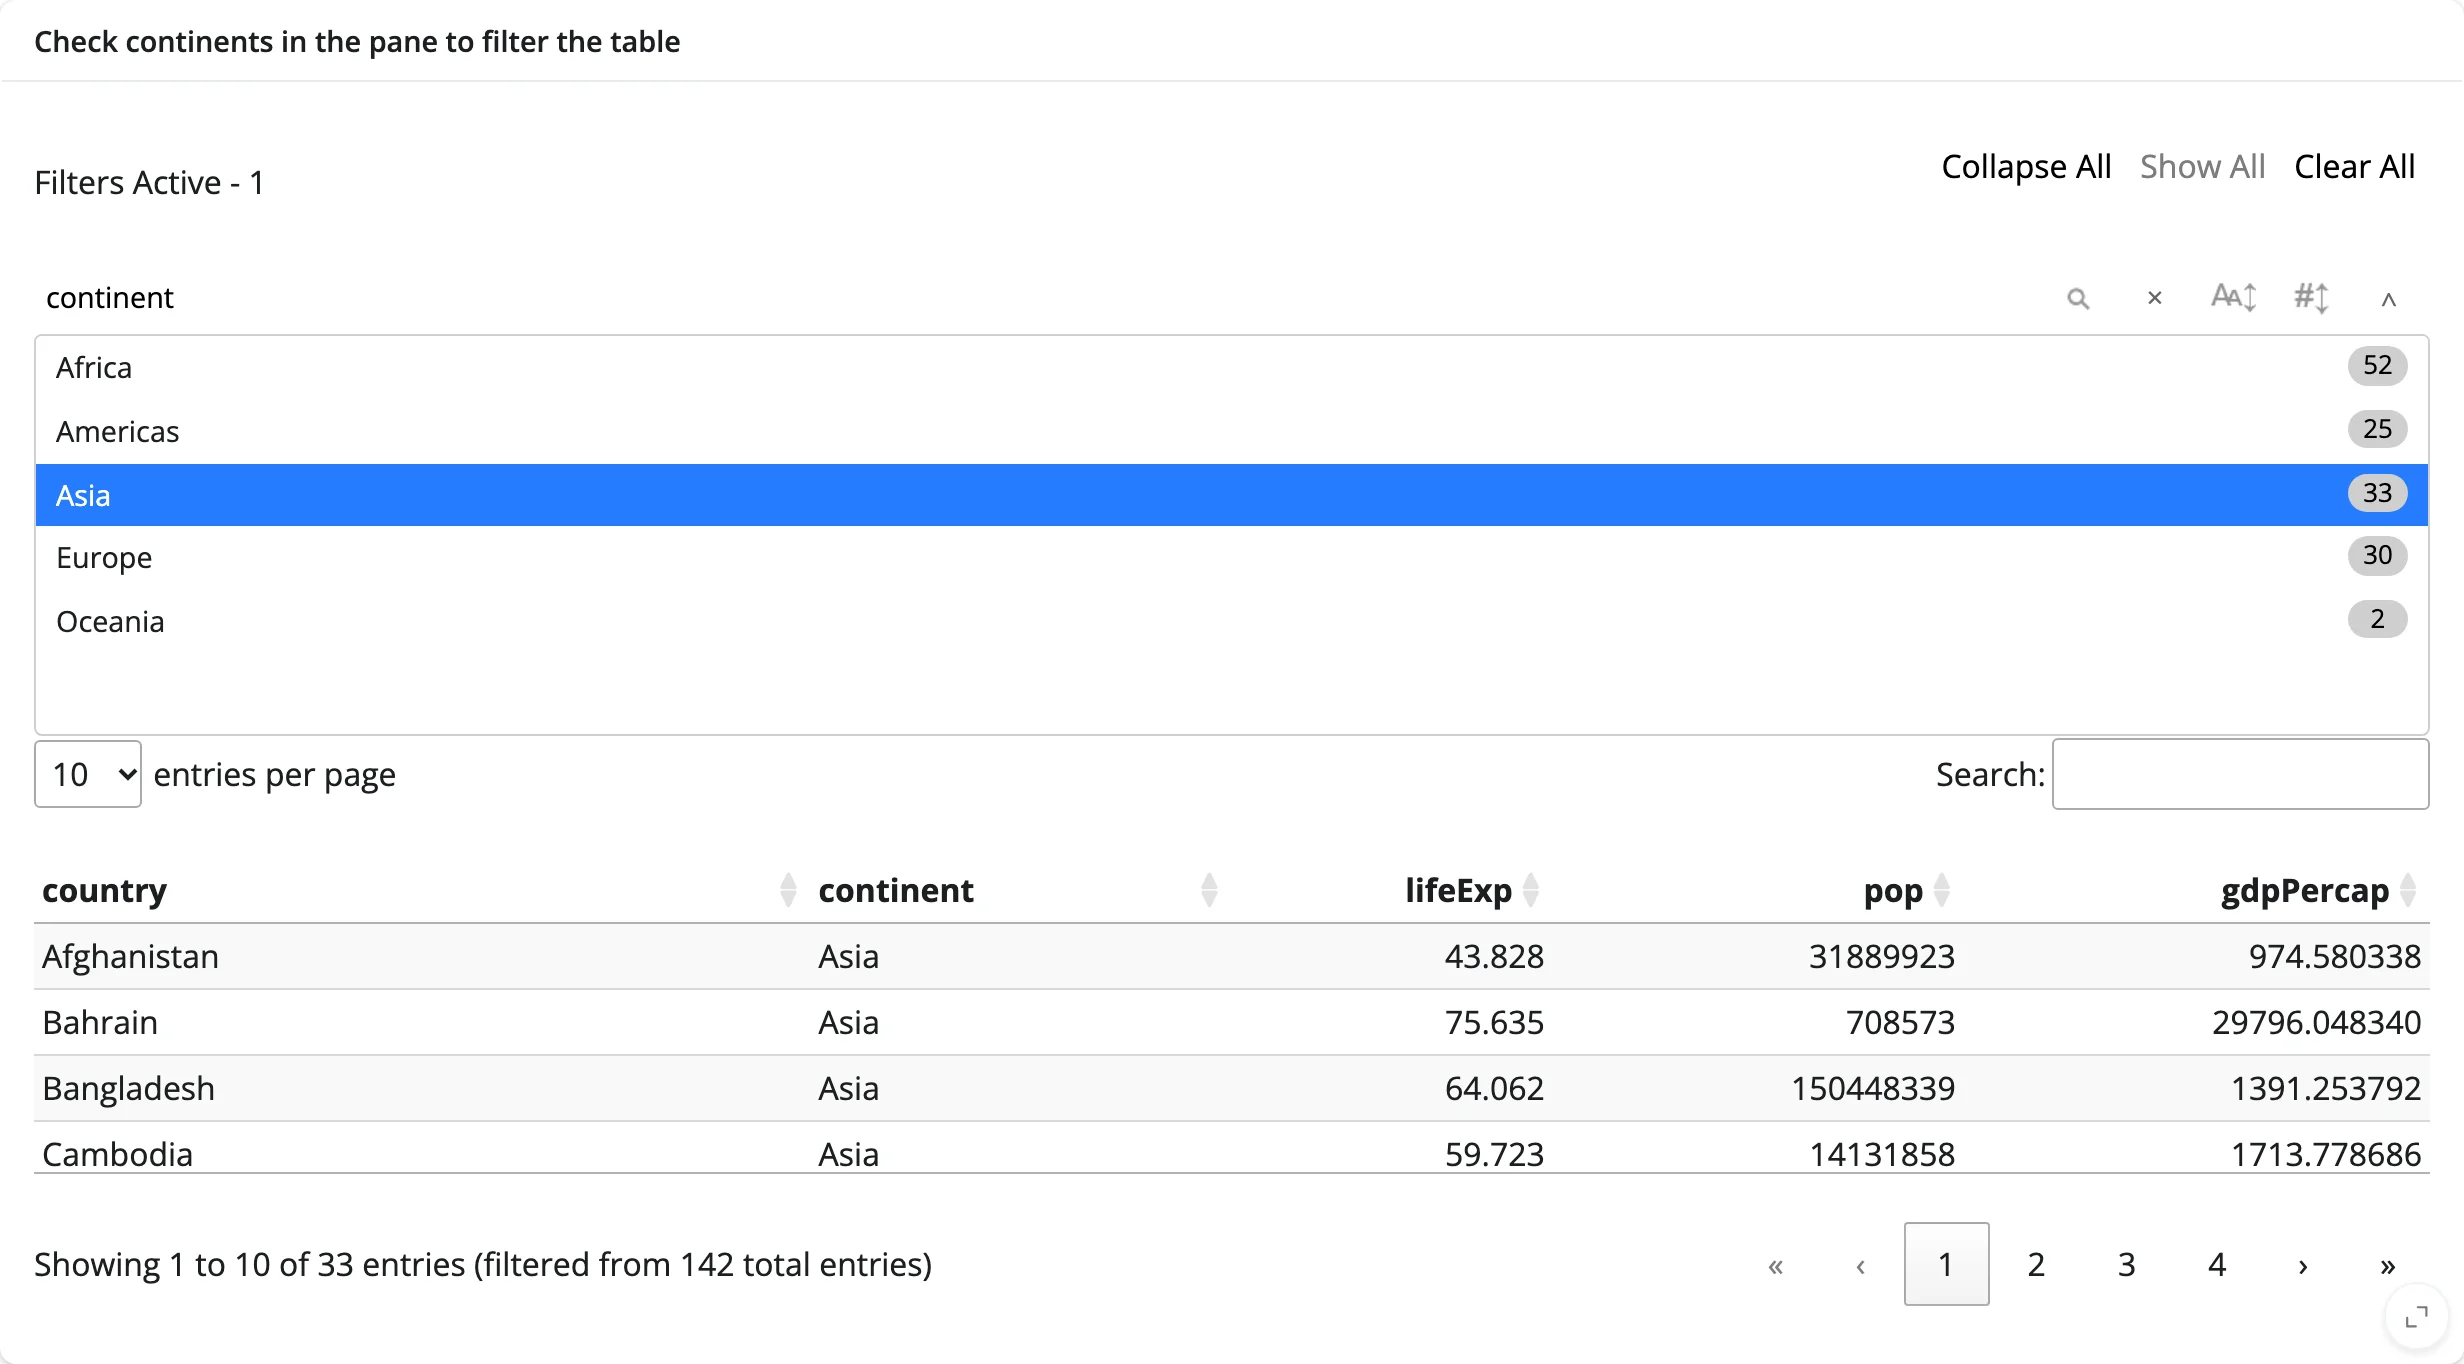
For a categorical column, SearchPanes draws a checkbox panel with a live row count per value – closer to a BI tool’s filter pane than a text box.
    @render_itables
    def table():
        # SearchPanes draws a faceted filter panel (one pane per listed column,
        # with row counts) above the table; checking a value filters like a
        # column search would.
        return ITable(
            countries,
            layout={"top1": "searchPanes"},
            searchPanes={"layout": "columns-1", "columns": [1]},
            select=True,
        )
Before (unfiltered) and after checking “Asia”:
Export buttons
The Buttons extension adds copy-to-clipboard and CSV/Excel export, with no server round trip – the browser already has the data.
    @render_itables
    def table():
        return ITable(countries, buttons=["copyHtml5", "csvHtml5"], select=True)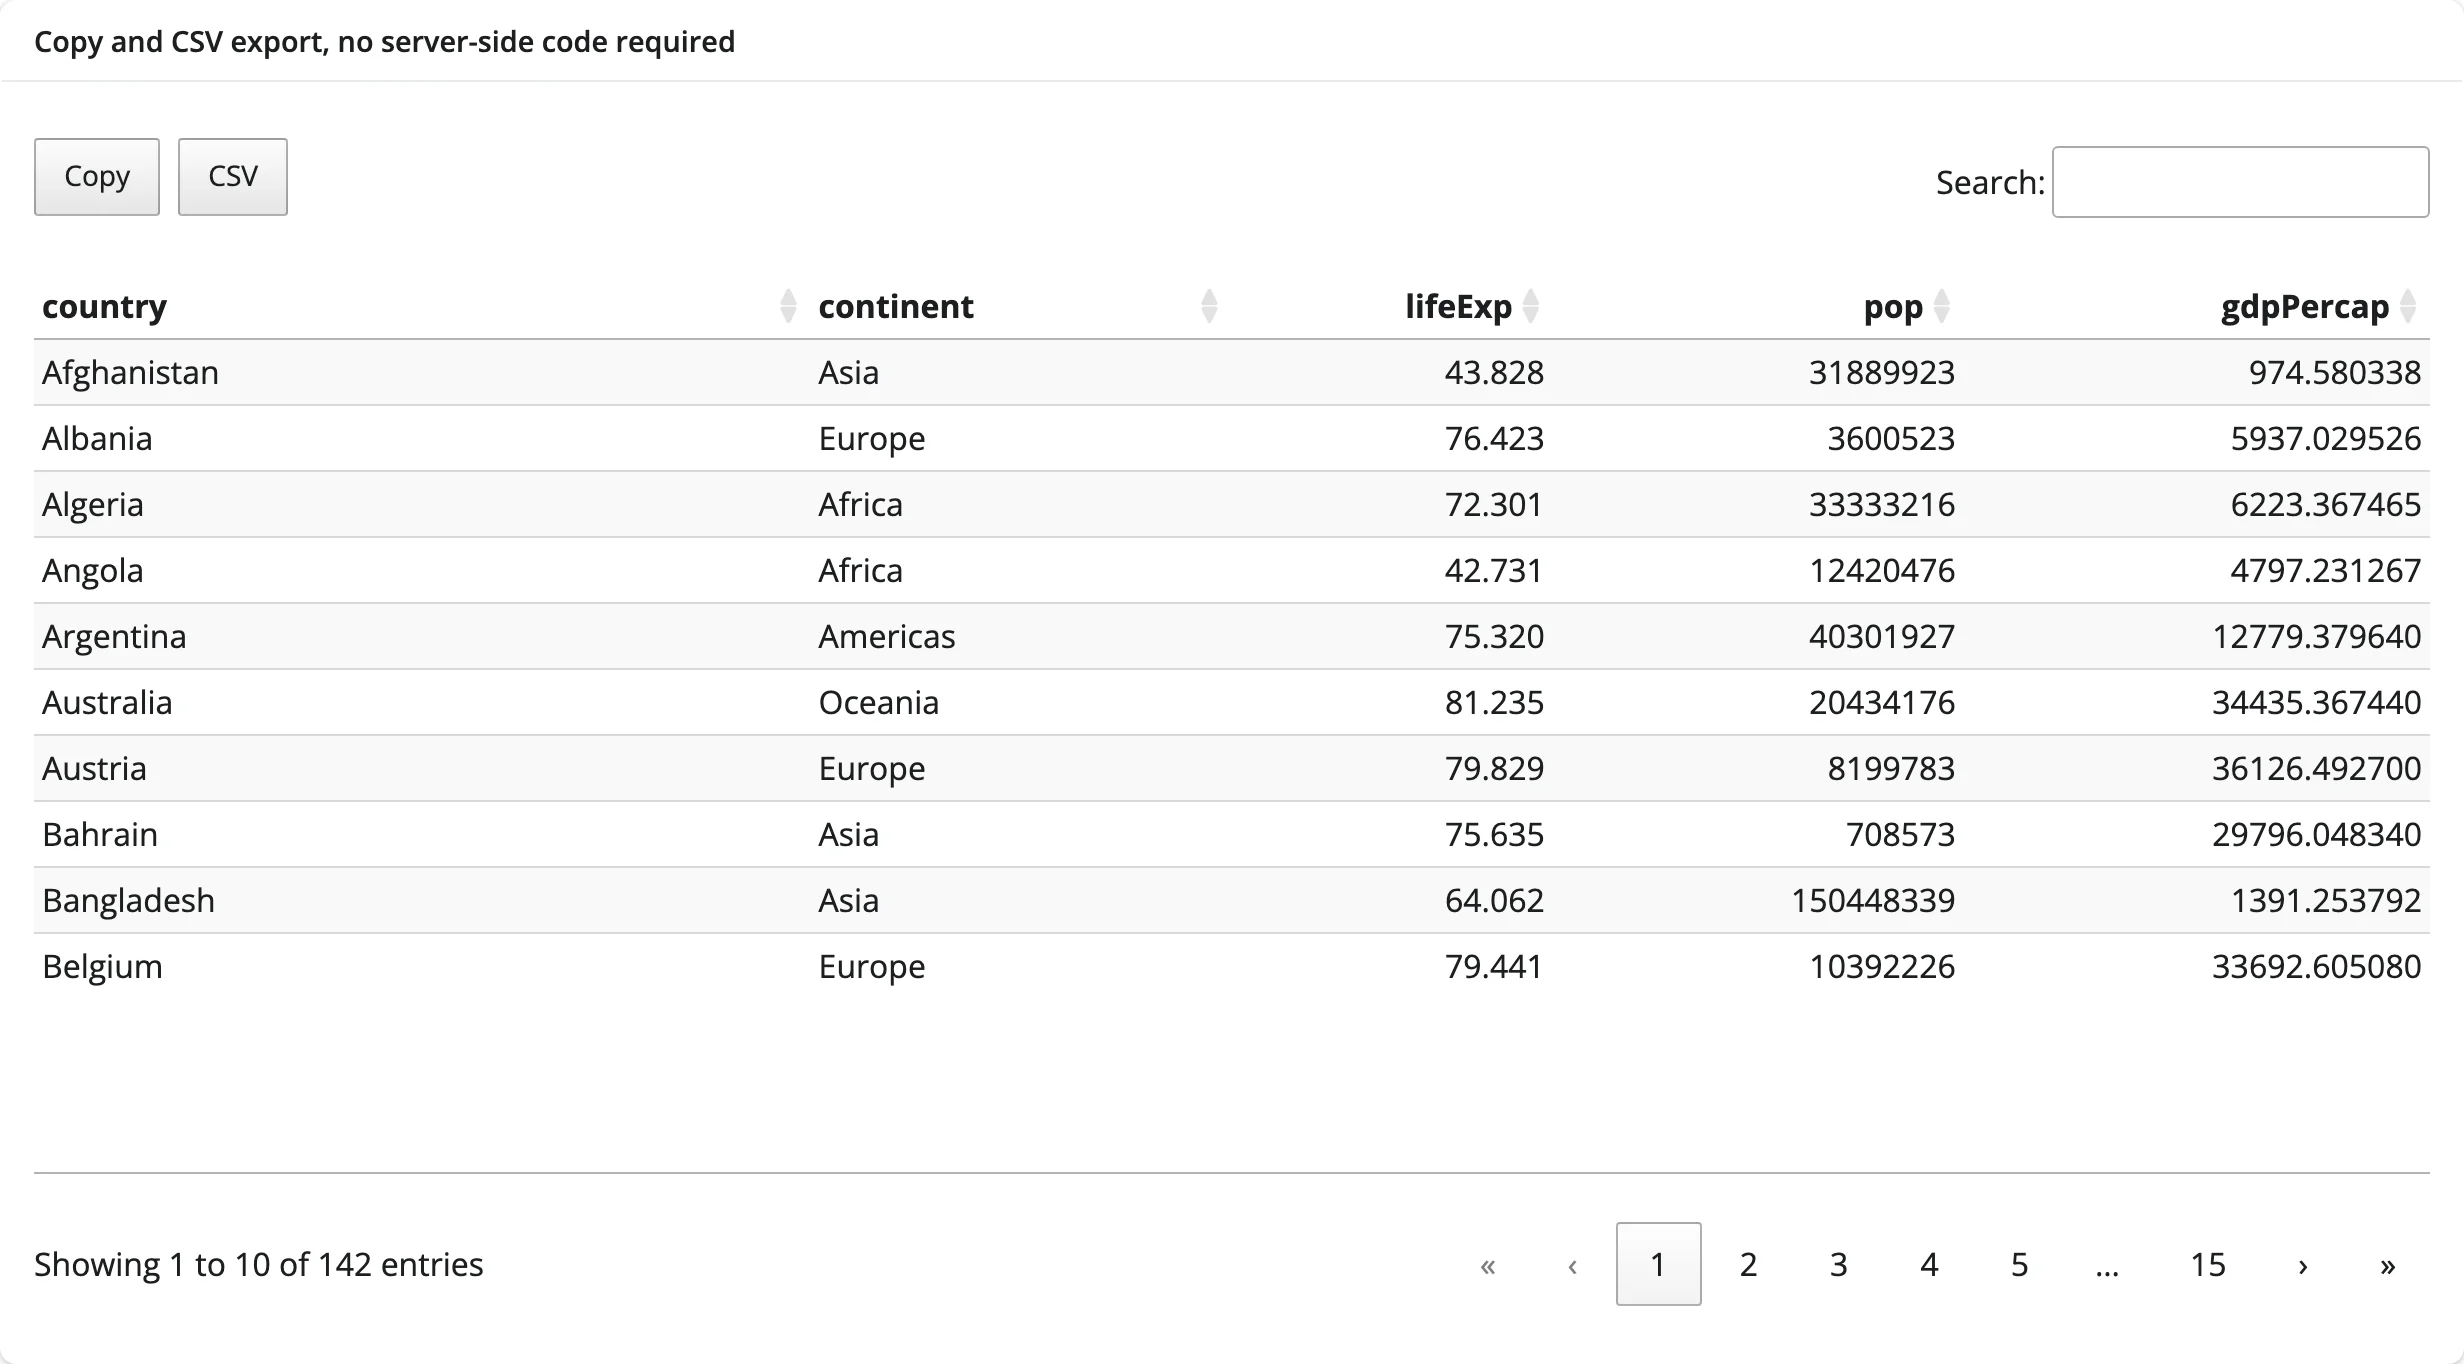
Cell formatting and conditional styling
columnDefs accepts a DataTables render (reformat a cell’s display value) or createdCell (restyle the <td> after it’s built) as a JavascriptFunction. This runs in the browser, so it costs nothing server-side and applies as the user sorts, searches, and pages.
    @render_itables
    def table():
        return ITable(
            countries,
            columnDefs=[
                {
                    # Format gdpPercap (column index 4) as currency on display,
                    # but keep the raw number for sorting/filtering.
                    "targets": [4],
                    "render": JavascriptFunction(
                        "function(data, type) {"
                        "  return type === 'display' "
                        "    ? '$' + Number(data).toLocaleString() : data;"
                        "}"
                    ),
                },
                {
                    # Color the life-expectancy cell by value. Without a
                    # `render` of its own, this column's cell data arrives as
                    # itables' own [display_string, raw_number] pair, not a
                    # plain number -- index into it rather than comparing it
                    # directly.
                    "targets": [2],
                    "createdCell": JavascriptFunction(
                        "function(td, data) {"
                        "  var v = Array.isArray(data) ? data[1] : data;"
                        "  td.style.color = v < 60 ? '#c0392b'"
                        "    : v >= 75 ? '#1e8449' : '';"
                        "}"
                    ),
                },
            ],
        )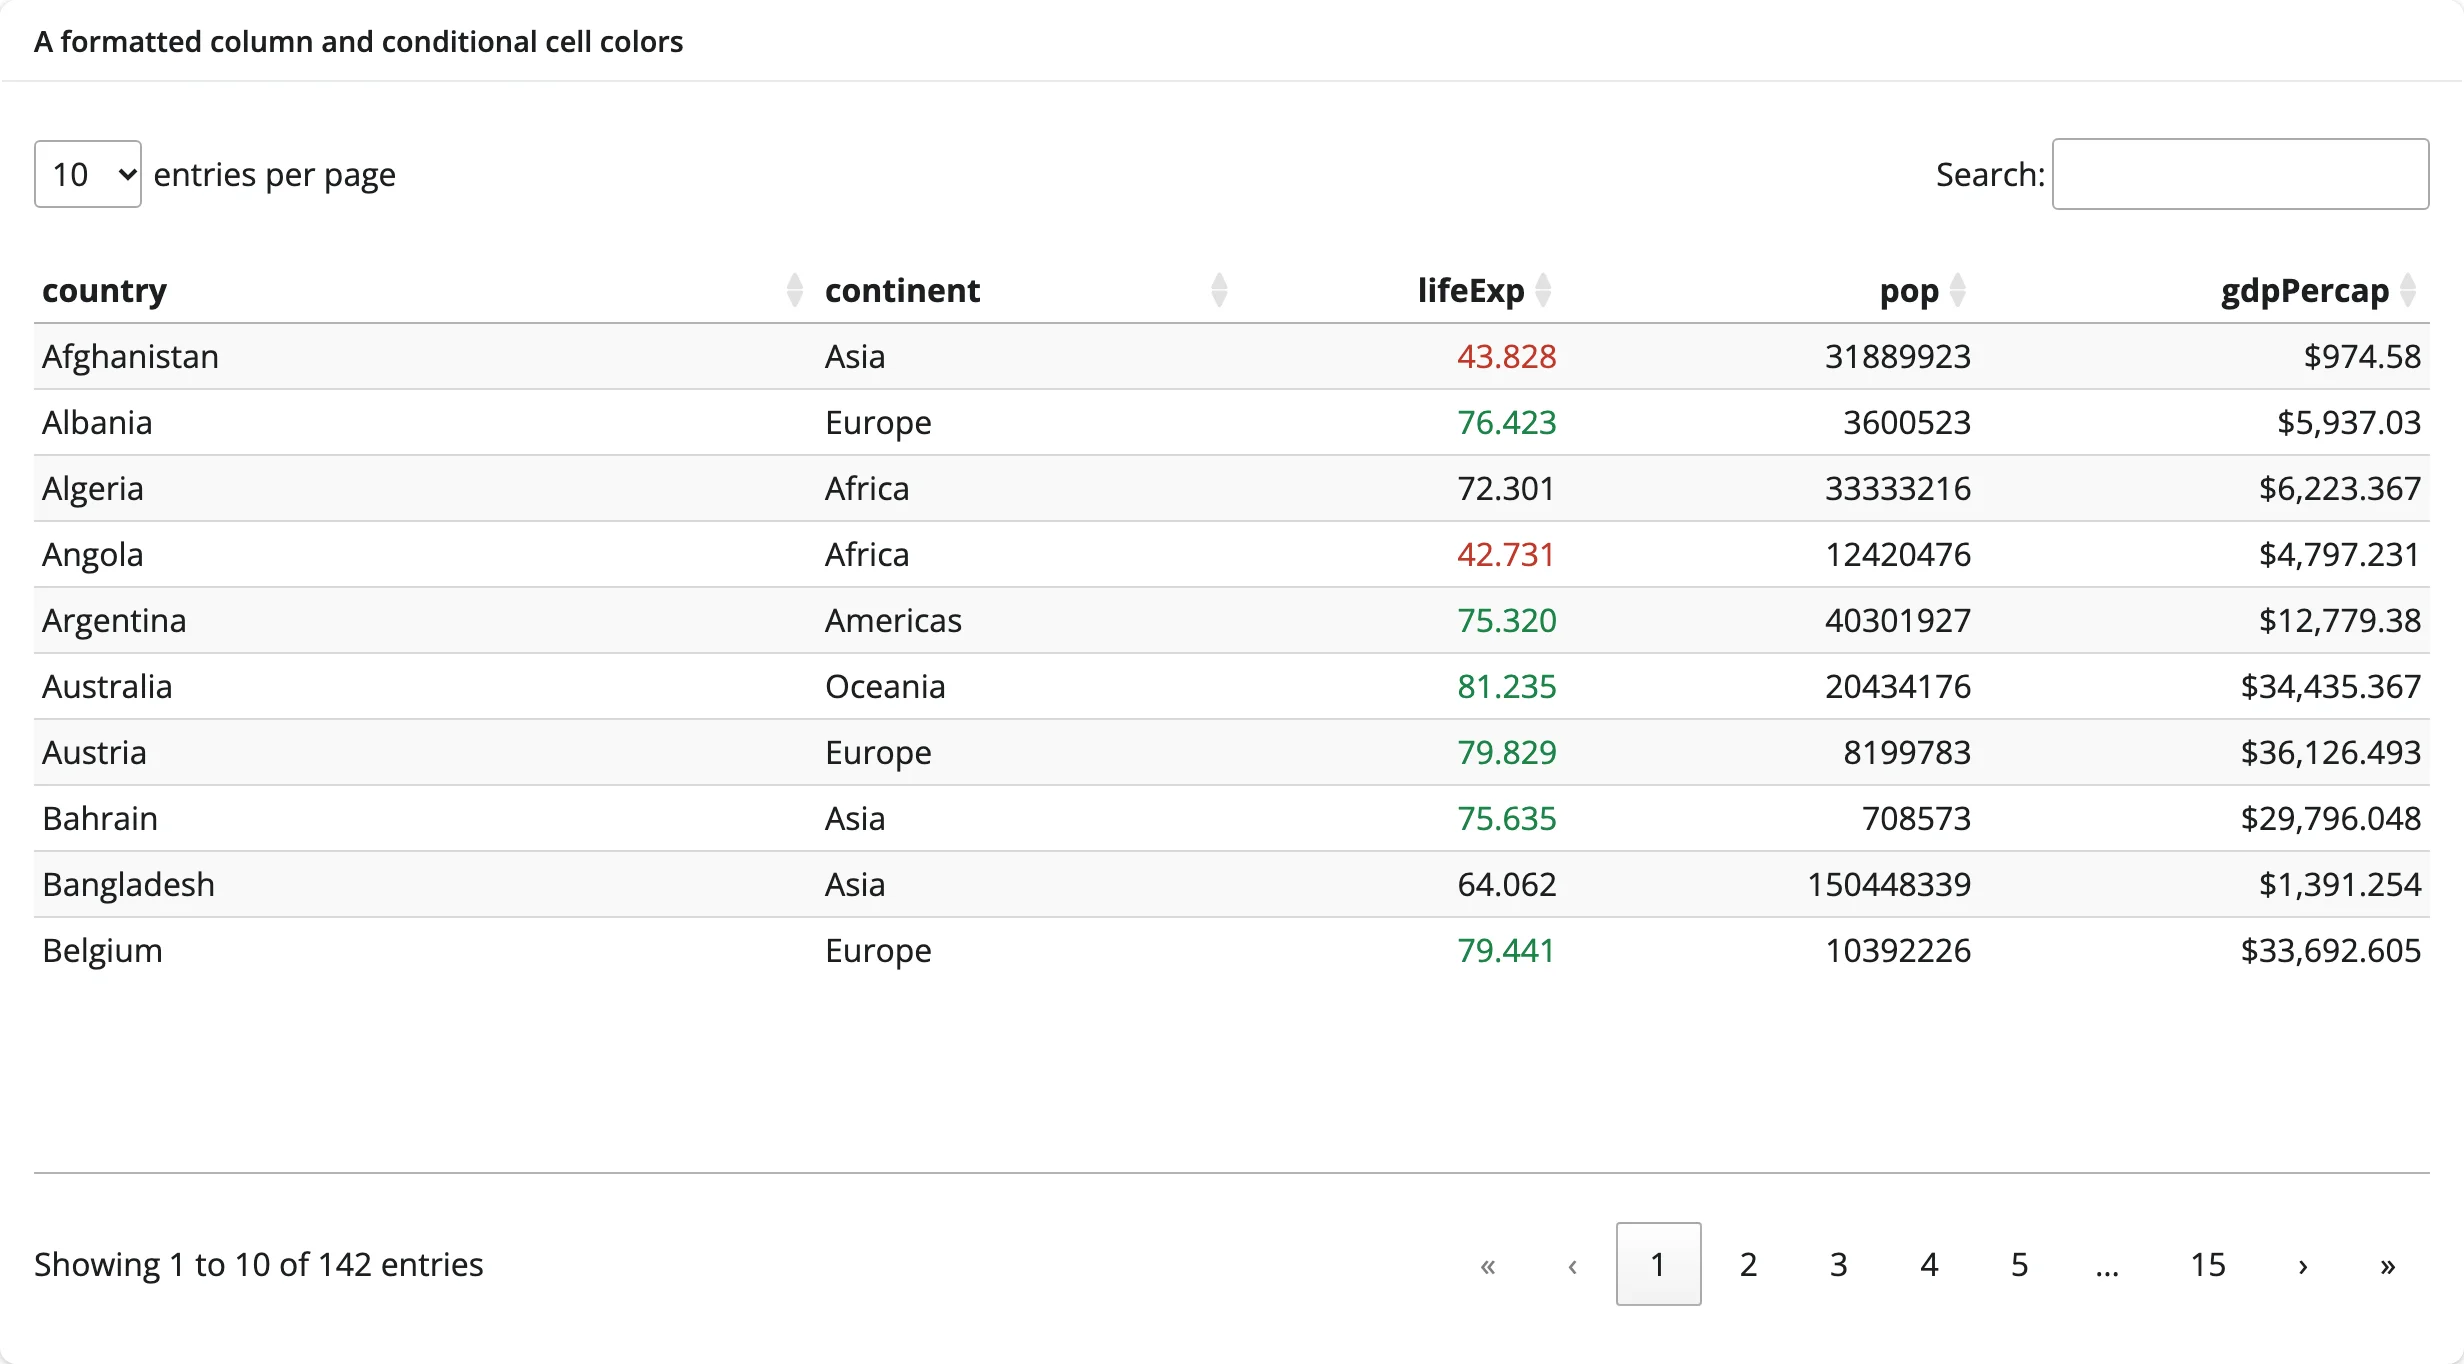
A gotcha verified while building this: a numeric column with no render of its own hands createdCell itables’ internal [display_string, raw_number] pair rather than a plain number (a column with its own render, like gdpPercap above, isn’t affected). Comparing that pair directly (data < 60) always comes out false. Index into it (data[1]) as shown.
pandas Styler, rendered as-is
Pass a Styler (e.g. from .style.background_gradient() or .format()) with allow_html=True, and itables renders its computed HTML and inline styles unchanged – gradients, bold, custom number formats, anything Styler can produce.
    @render_itables
    def table():
        styler = (
            countries.style.background_gradient(subset=["lifeExp"], cmap="RdYlGn")
            .format({"lifeExp": "{:.1f}", "gdpPercap": "${:,.0f}", "pop": "{:,.0f}"})
        )
        # A Styler always carries HTML (its inline styles), so itables requires
        # an explicit opt-in to render it.
        return ITable(styler, allow_html=True, select=True)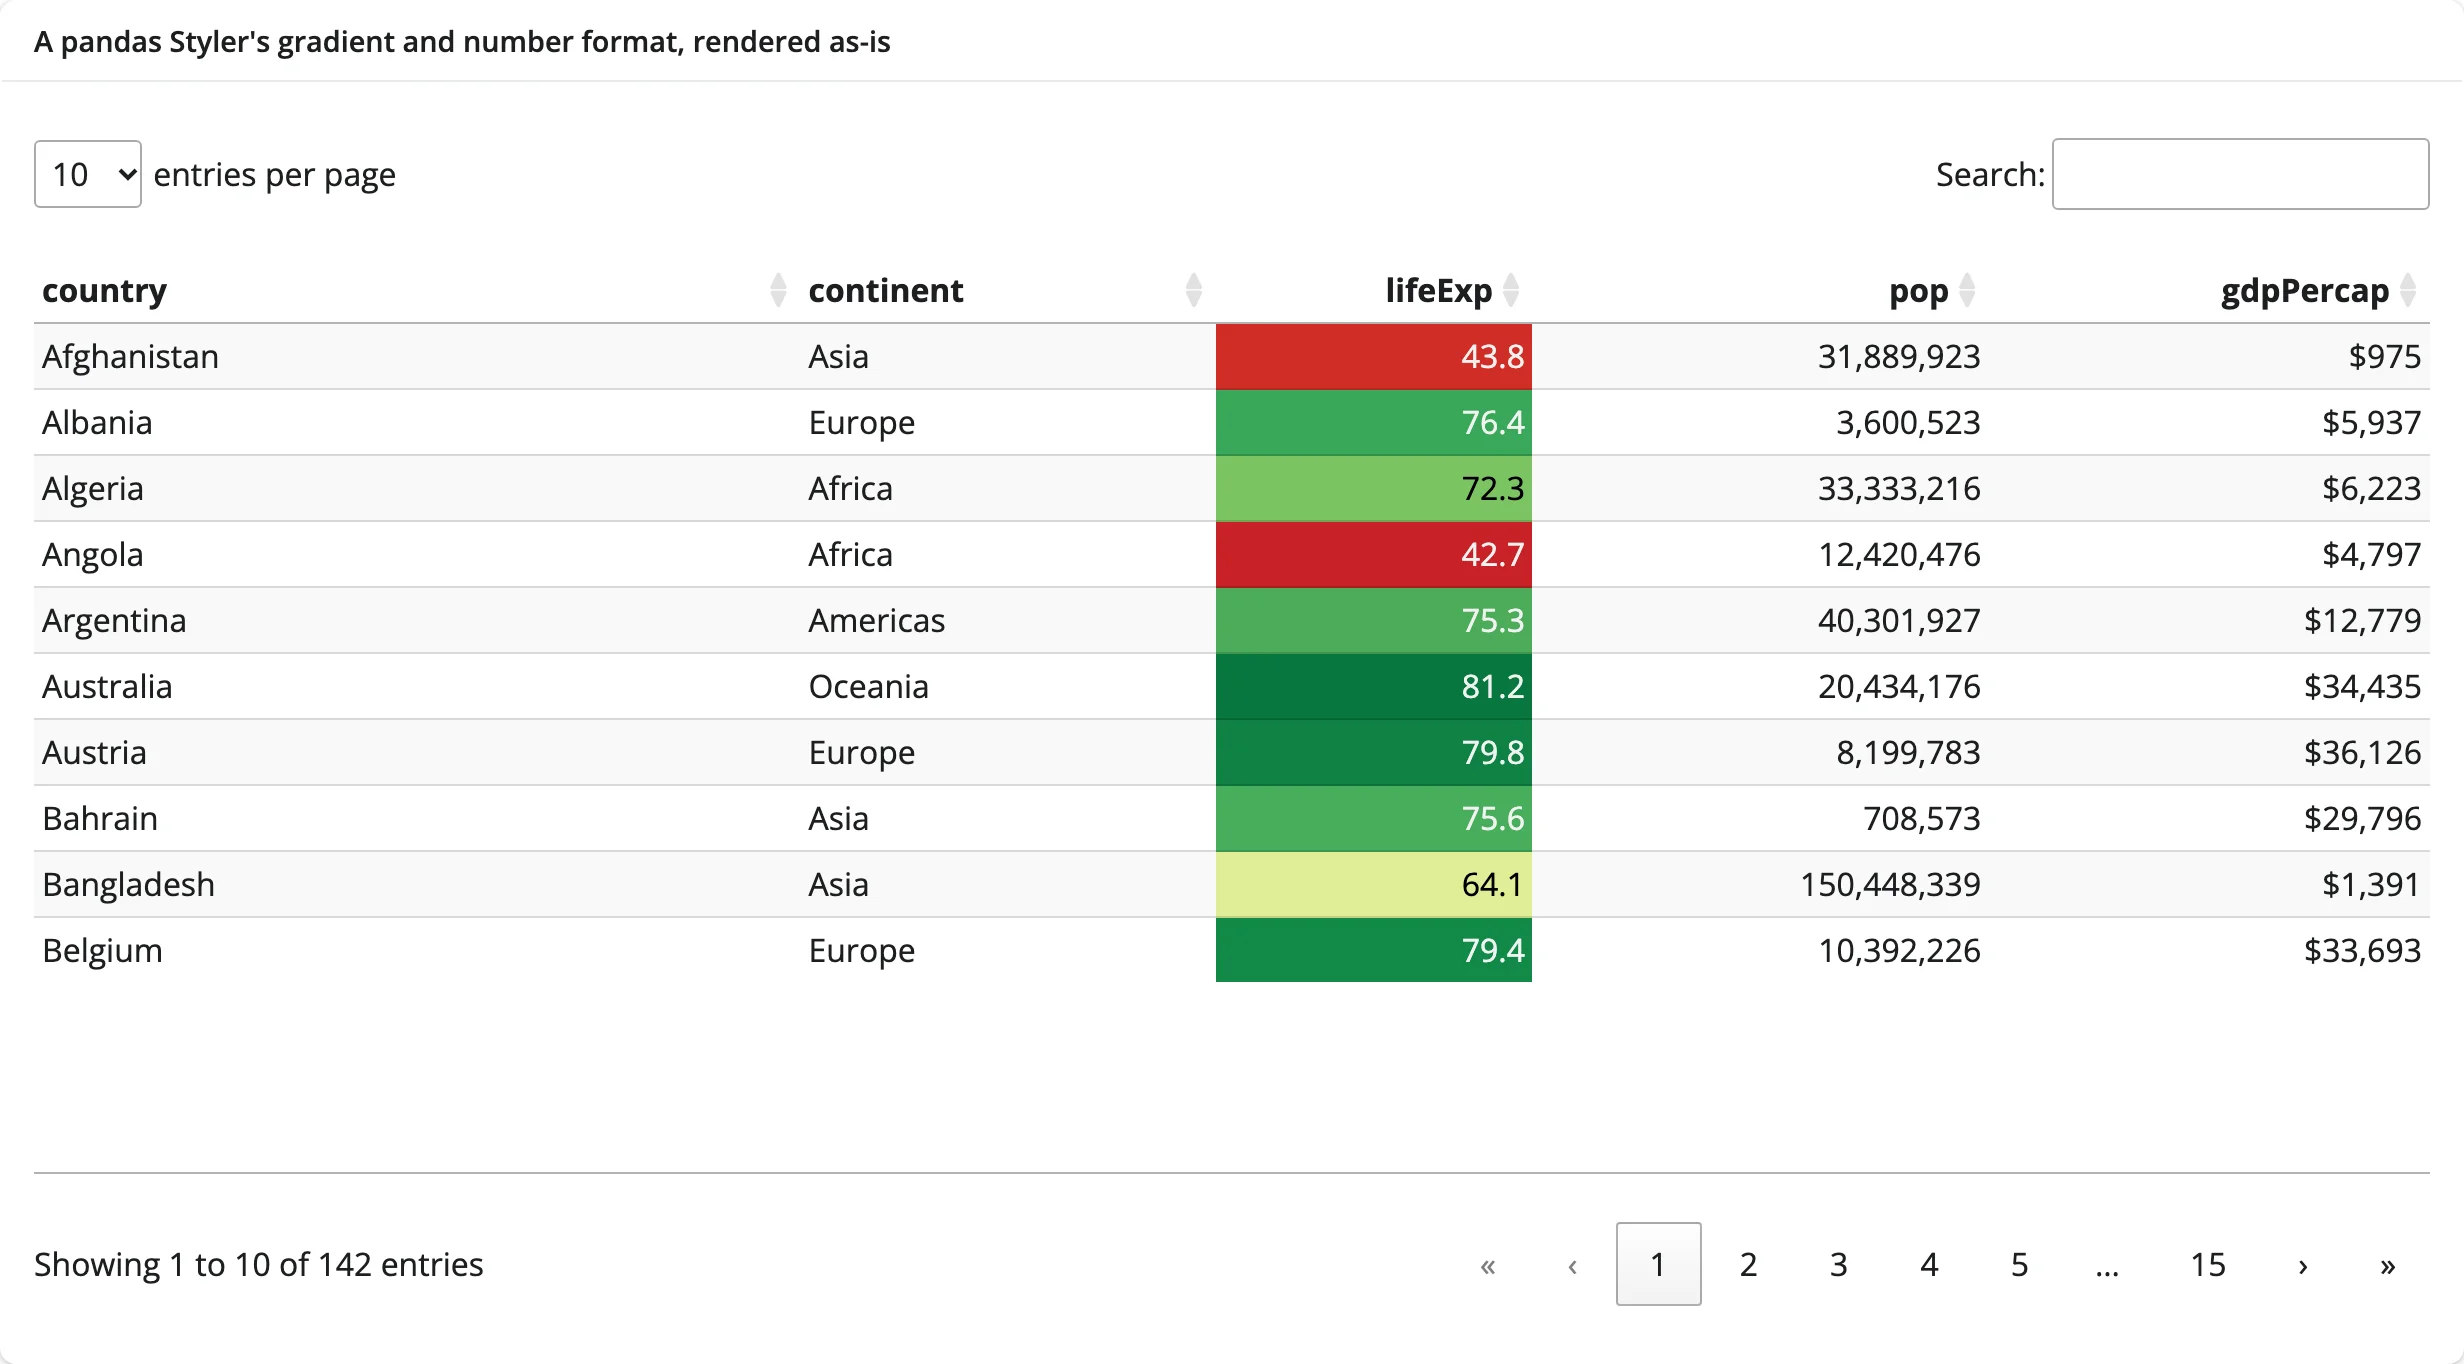
allow_html=True means the content is trusted; don’t point it at user-supplied HTML.
polars, unchanged
ITable accepts a polars DataFrame directly – no conversion to pandas. selected_rows() still returns plain positions, so index the polars frame the usual way (pl_df[rows]).
countries = pl.from_pandas(
    px.data.gapminder()
    .query("year == 2007")[["country", "continent", "lifeExp", "pop", "gdpPercap"]]
    .reset_index(drop=True)
)
The table sits next to a selected-rows output that indexes the polars frame directly (examples/07_polars.py):
with ui.layout_columns(col_widths=[8, 4]):
    with ui.card(full_screen=True):

        @render_itables
        def table():
            # itables accepts a polars DataFrame directly; no pandas conversion
            return ITable(countries, select=True)

    with ui.card():
        ui.card_header("Selected rows (polars indexing)")

        @render.data_frame
        def selected():
            return countries[table.selected_rows()]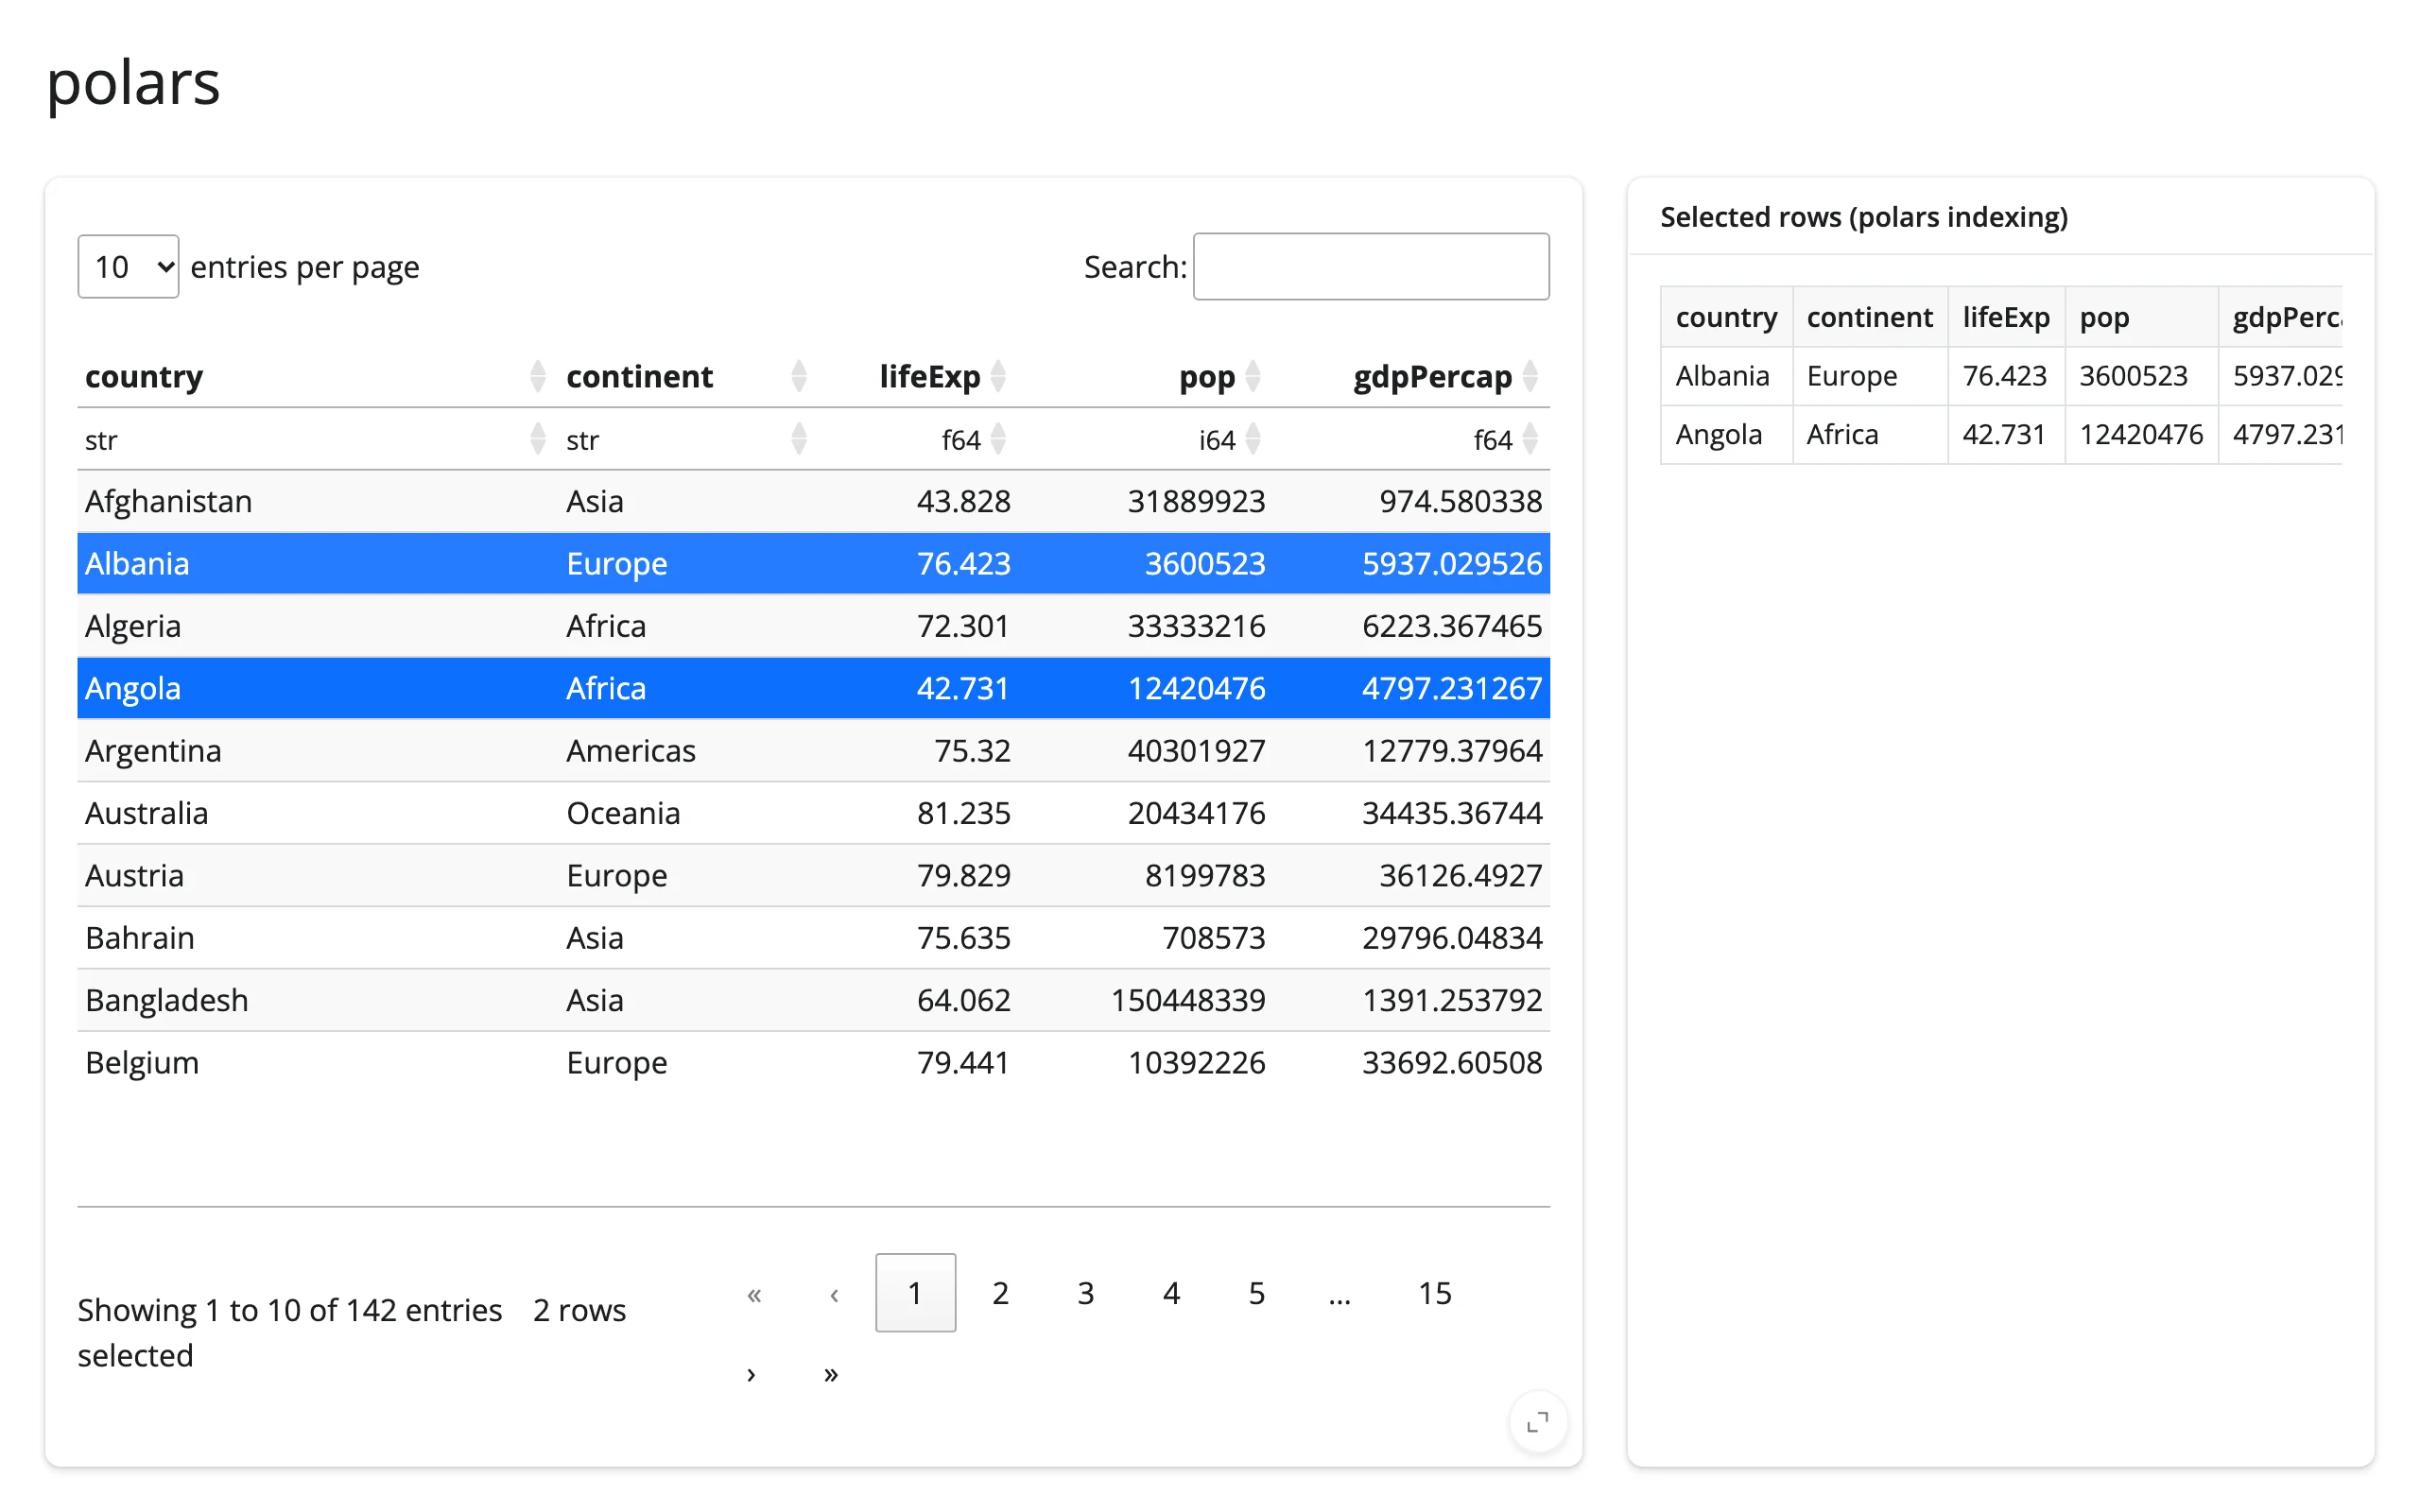
Reacting to user interaction
Accessor reference
| accessor | returns | before any interaction | across re-render | default rate policy |
|---|---|---|---|---|
selected_rows() |
list[int] |
seeded [] (the widget’s initial selected_rows trait) |
re-seeded from the new table (starts [] unless the new ITable(...) is constructed with selected_rows= set) |
not rate-limited – fires once per click |
selected_rows()
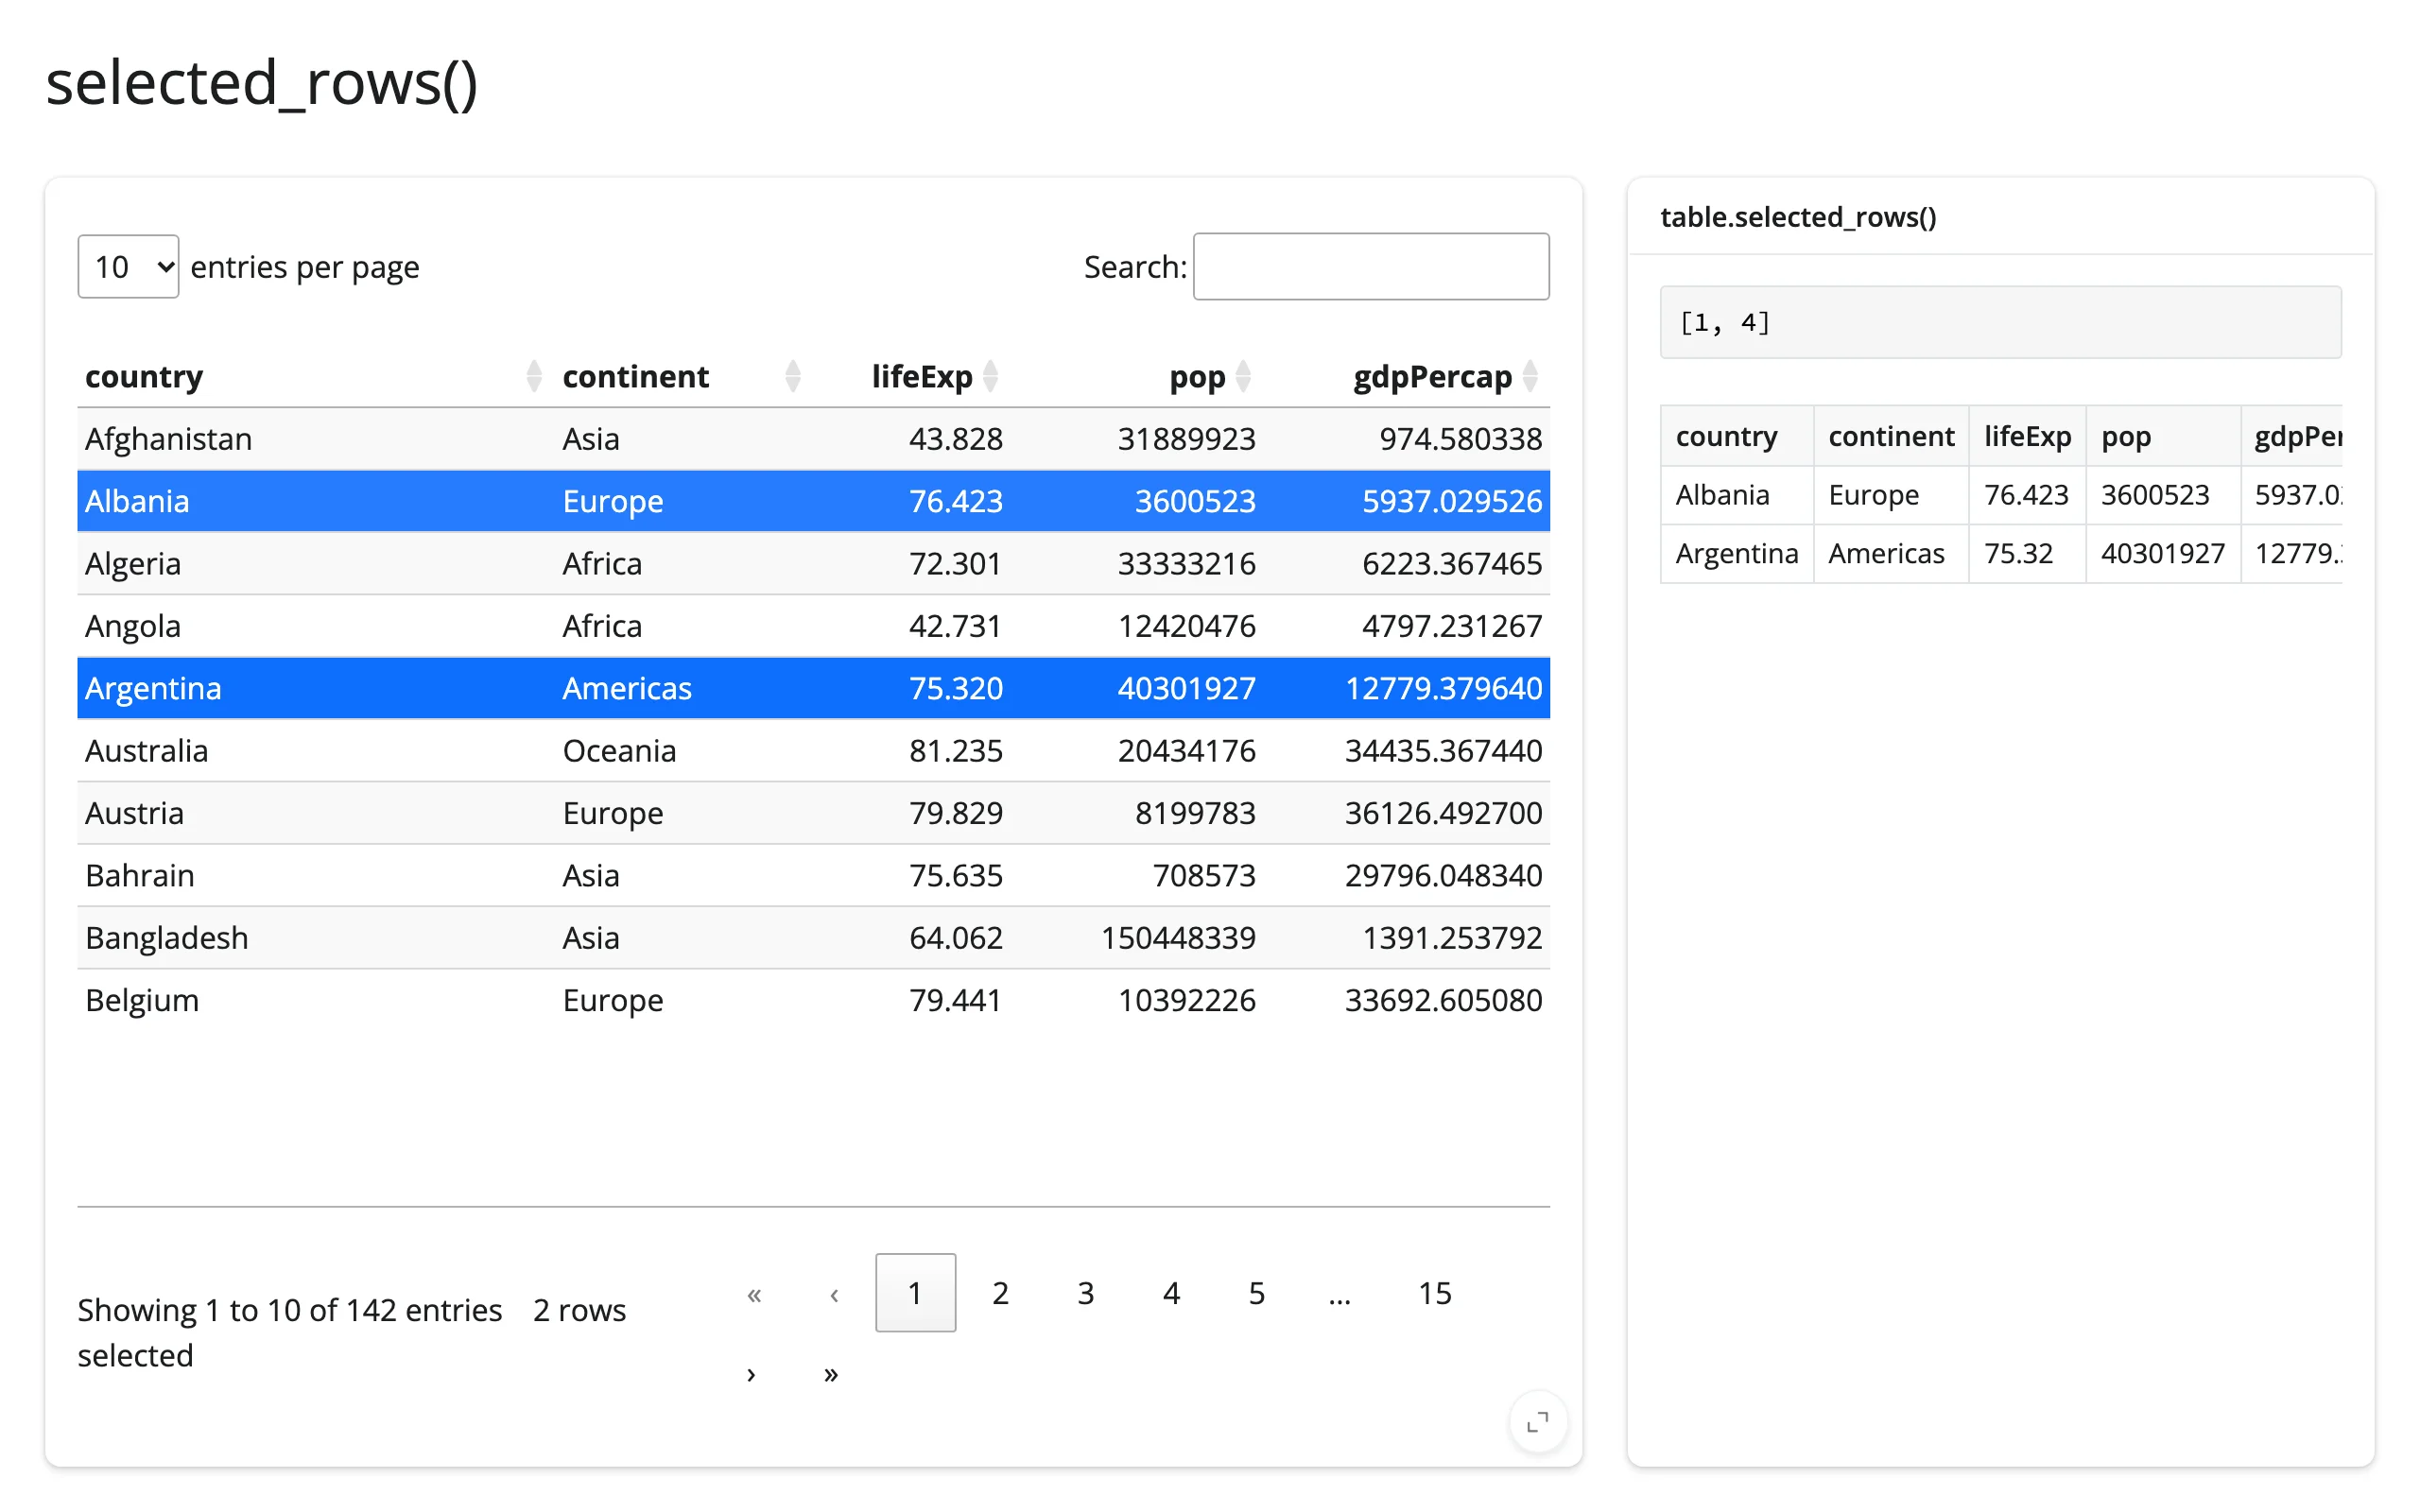
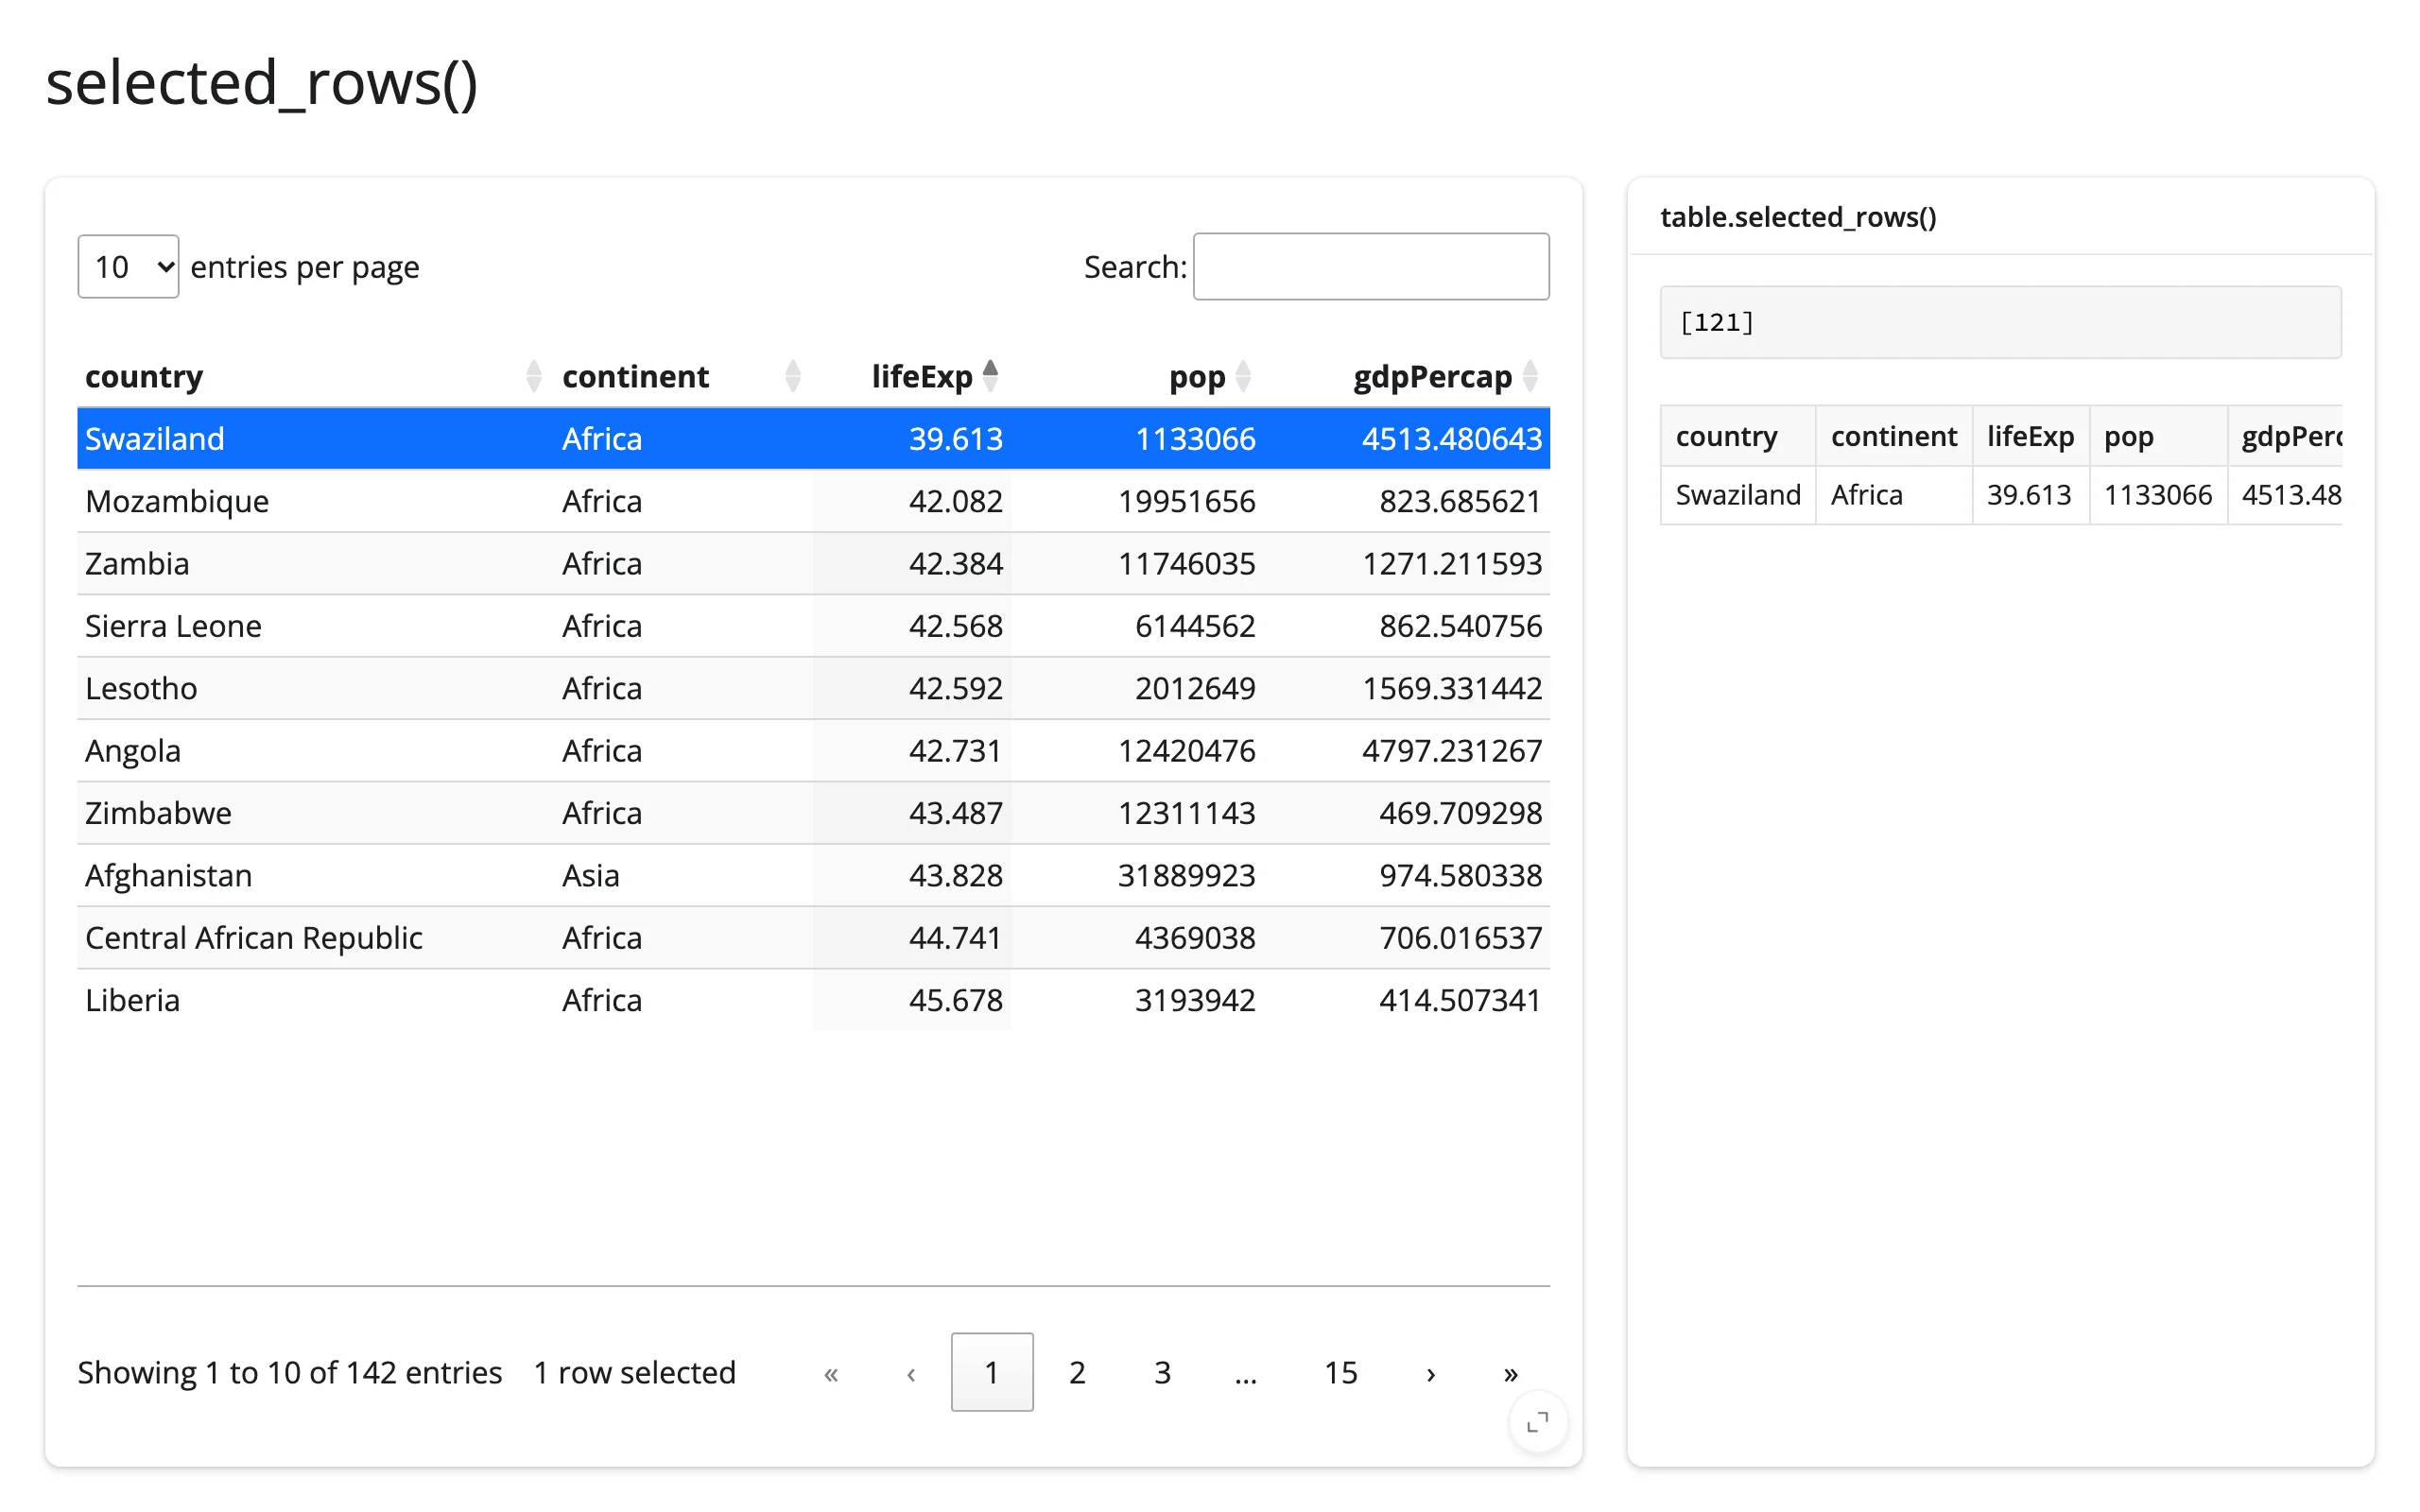
Positions are into the table’s data, not its current display: they survive sorting, searching, and paging. They don’t survive the data itself changing, in either of the two ways it can: a re-render (a new ITable(...) from the decorated function) resets selected_rows() to the new table’s own selection ([] unless you set one), so there’s no stale-position risk there; .widget.update(df) (in place, same widget) is the risky one – the old positions carry over unchanged, now pointing into the new frame, which silently selects the wrong rows if the position happens to still be in range. Either way, a plain integer position is only meaningful against whatever data frame is currently shown. If your table’s data can change, track selections by a stable key (an ID column) instead of trusting the raw position across the change – see A filter control updates the table in place, keeping the selection for the pattern.
with ui.layout_columns(col_widths=[8, 4]):
    with ui.card(full_screen=True):

        @render_itables
        def table():
            return ITable(countries, select=True)

    with ui.card():
        ui.card_header("table.selected_rows()")

        @render.code
        def rows():
            return str(table.selected_rows())

        @render.data_frame
        def selected():
            # Positions are into the data, not the display: they survive
            # sorting and searching.
            return countries.iloc[table.selected_rows()]
Click two rows, then sort by life expectancy and click the new first row – the position tracks the row, not the screen location:
Read on demand: export selected rows
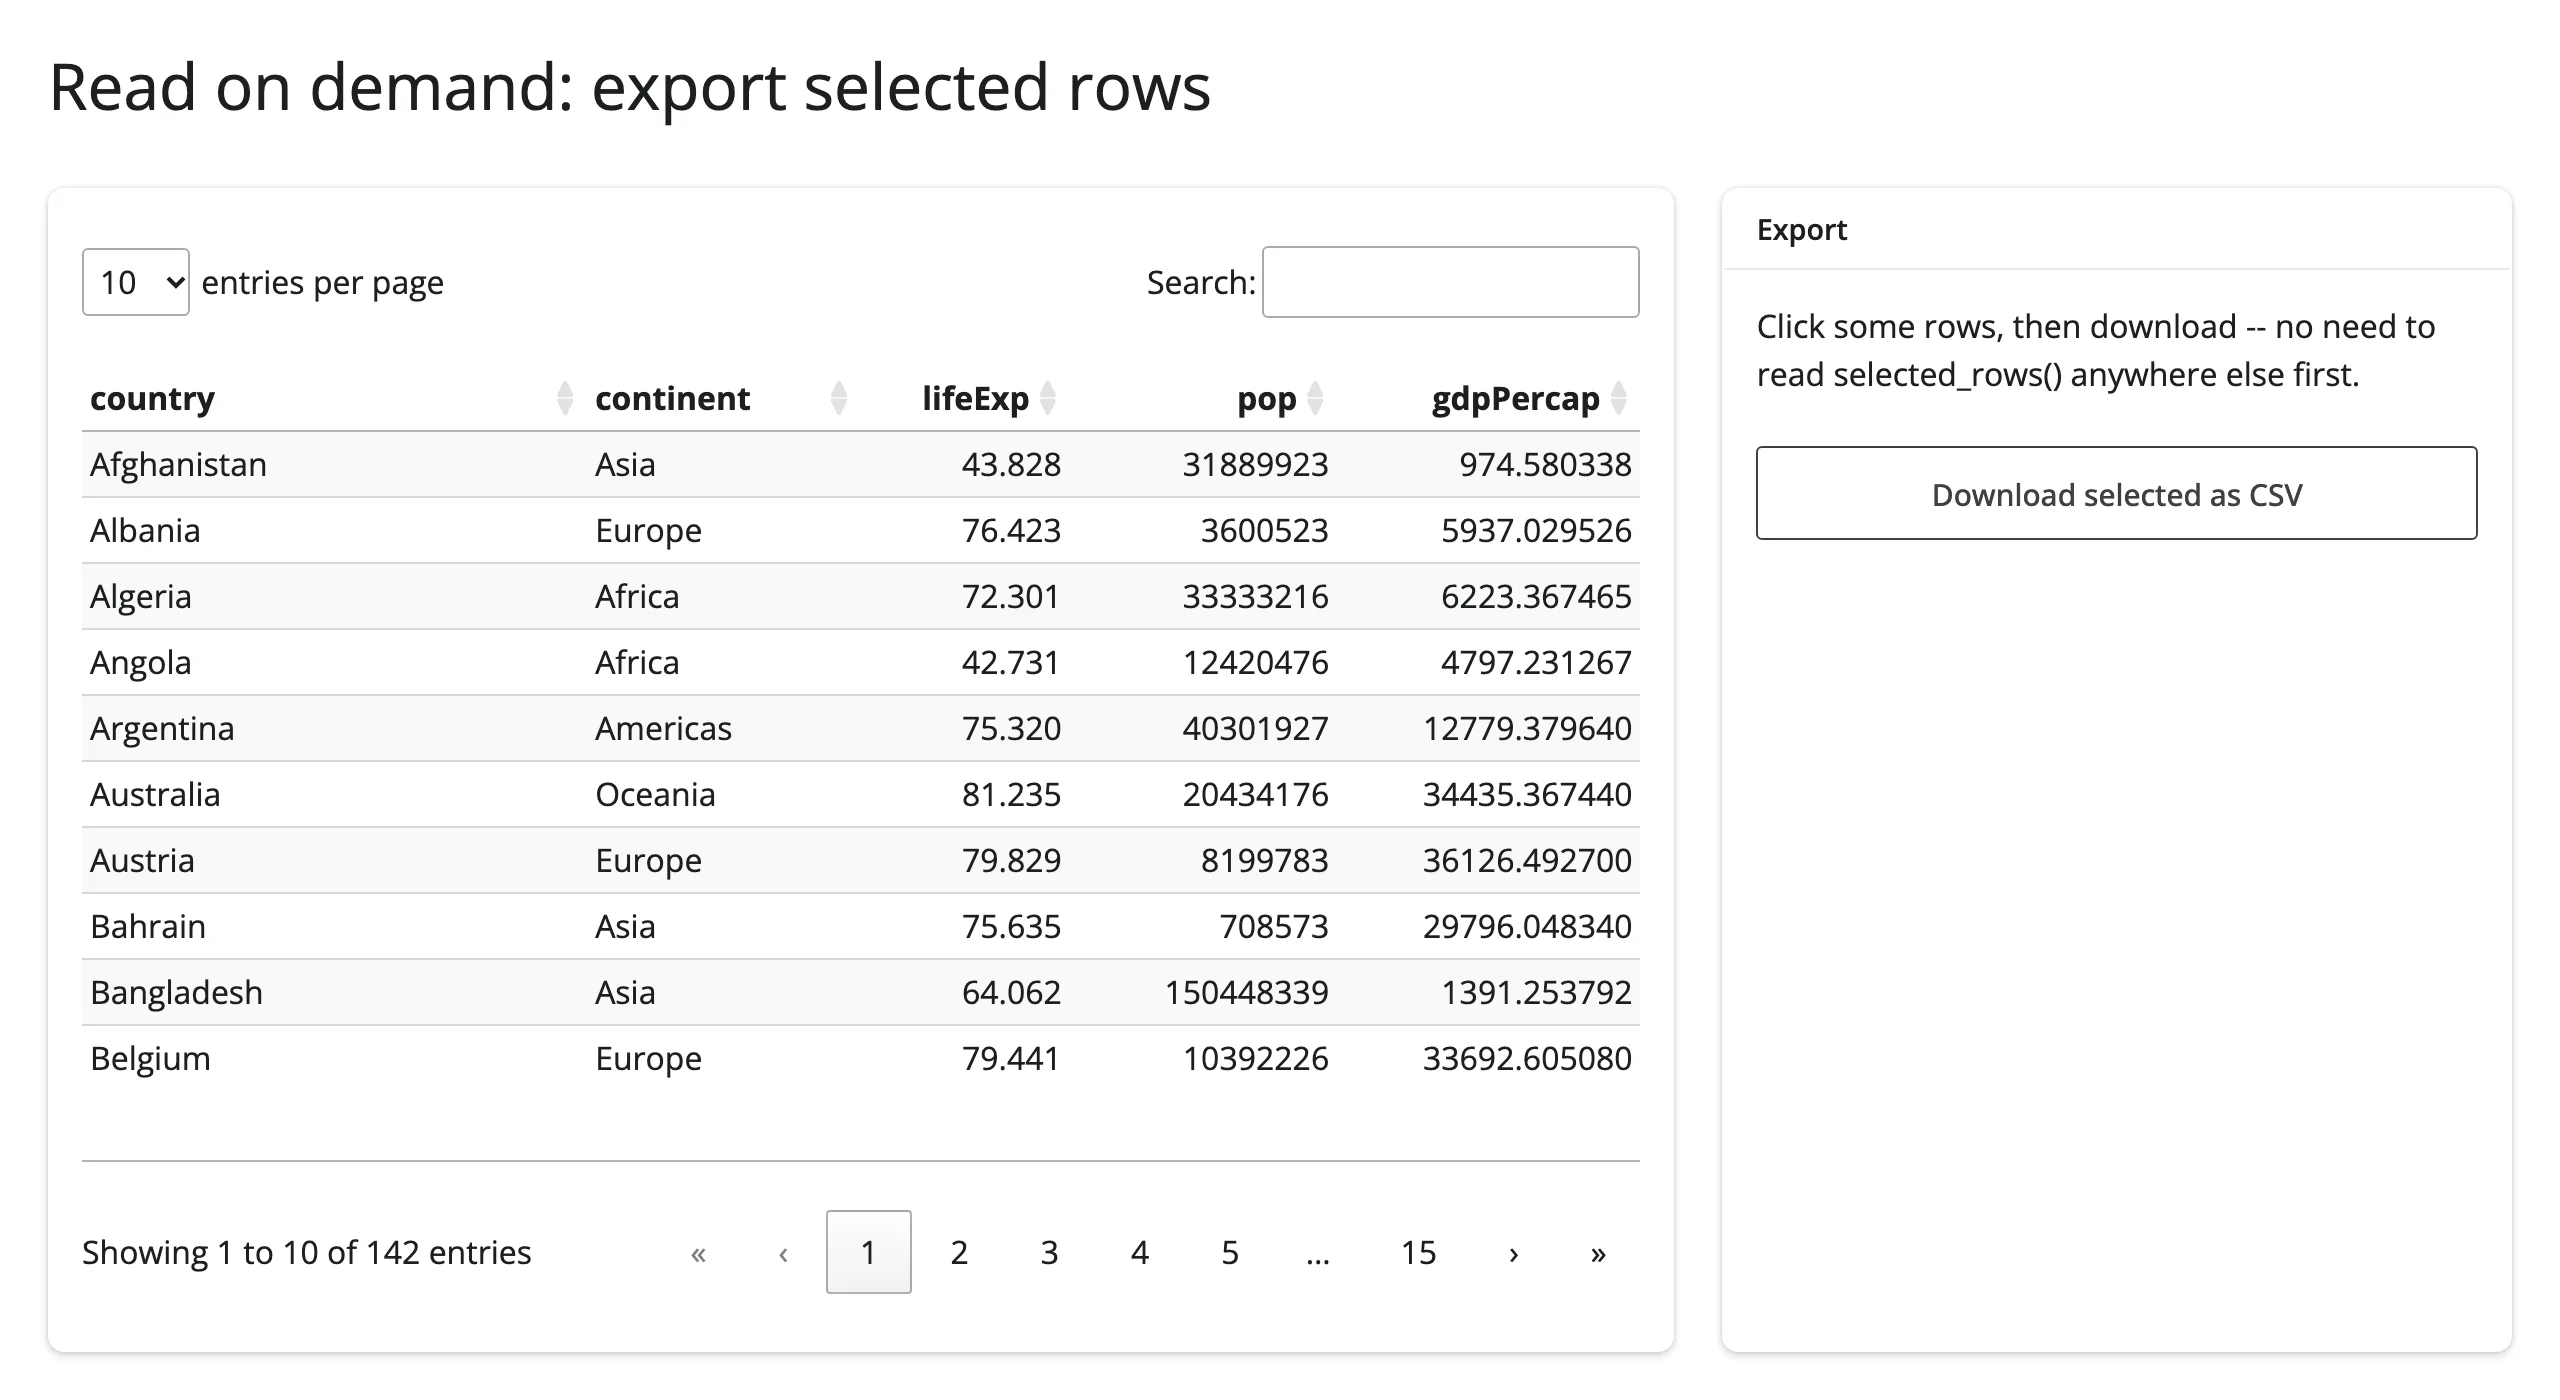
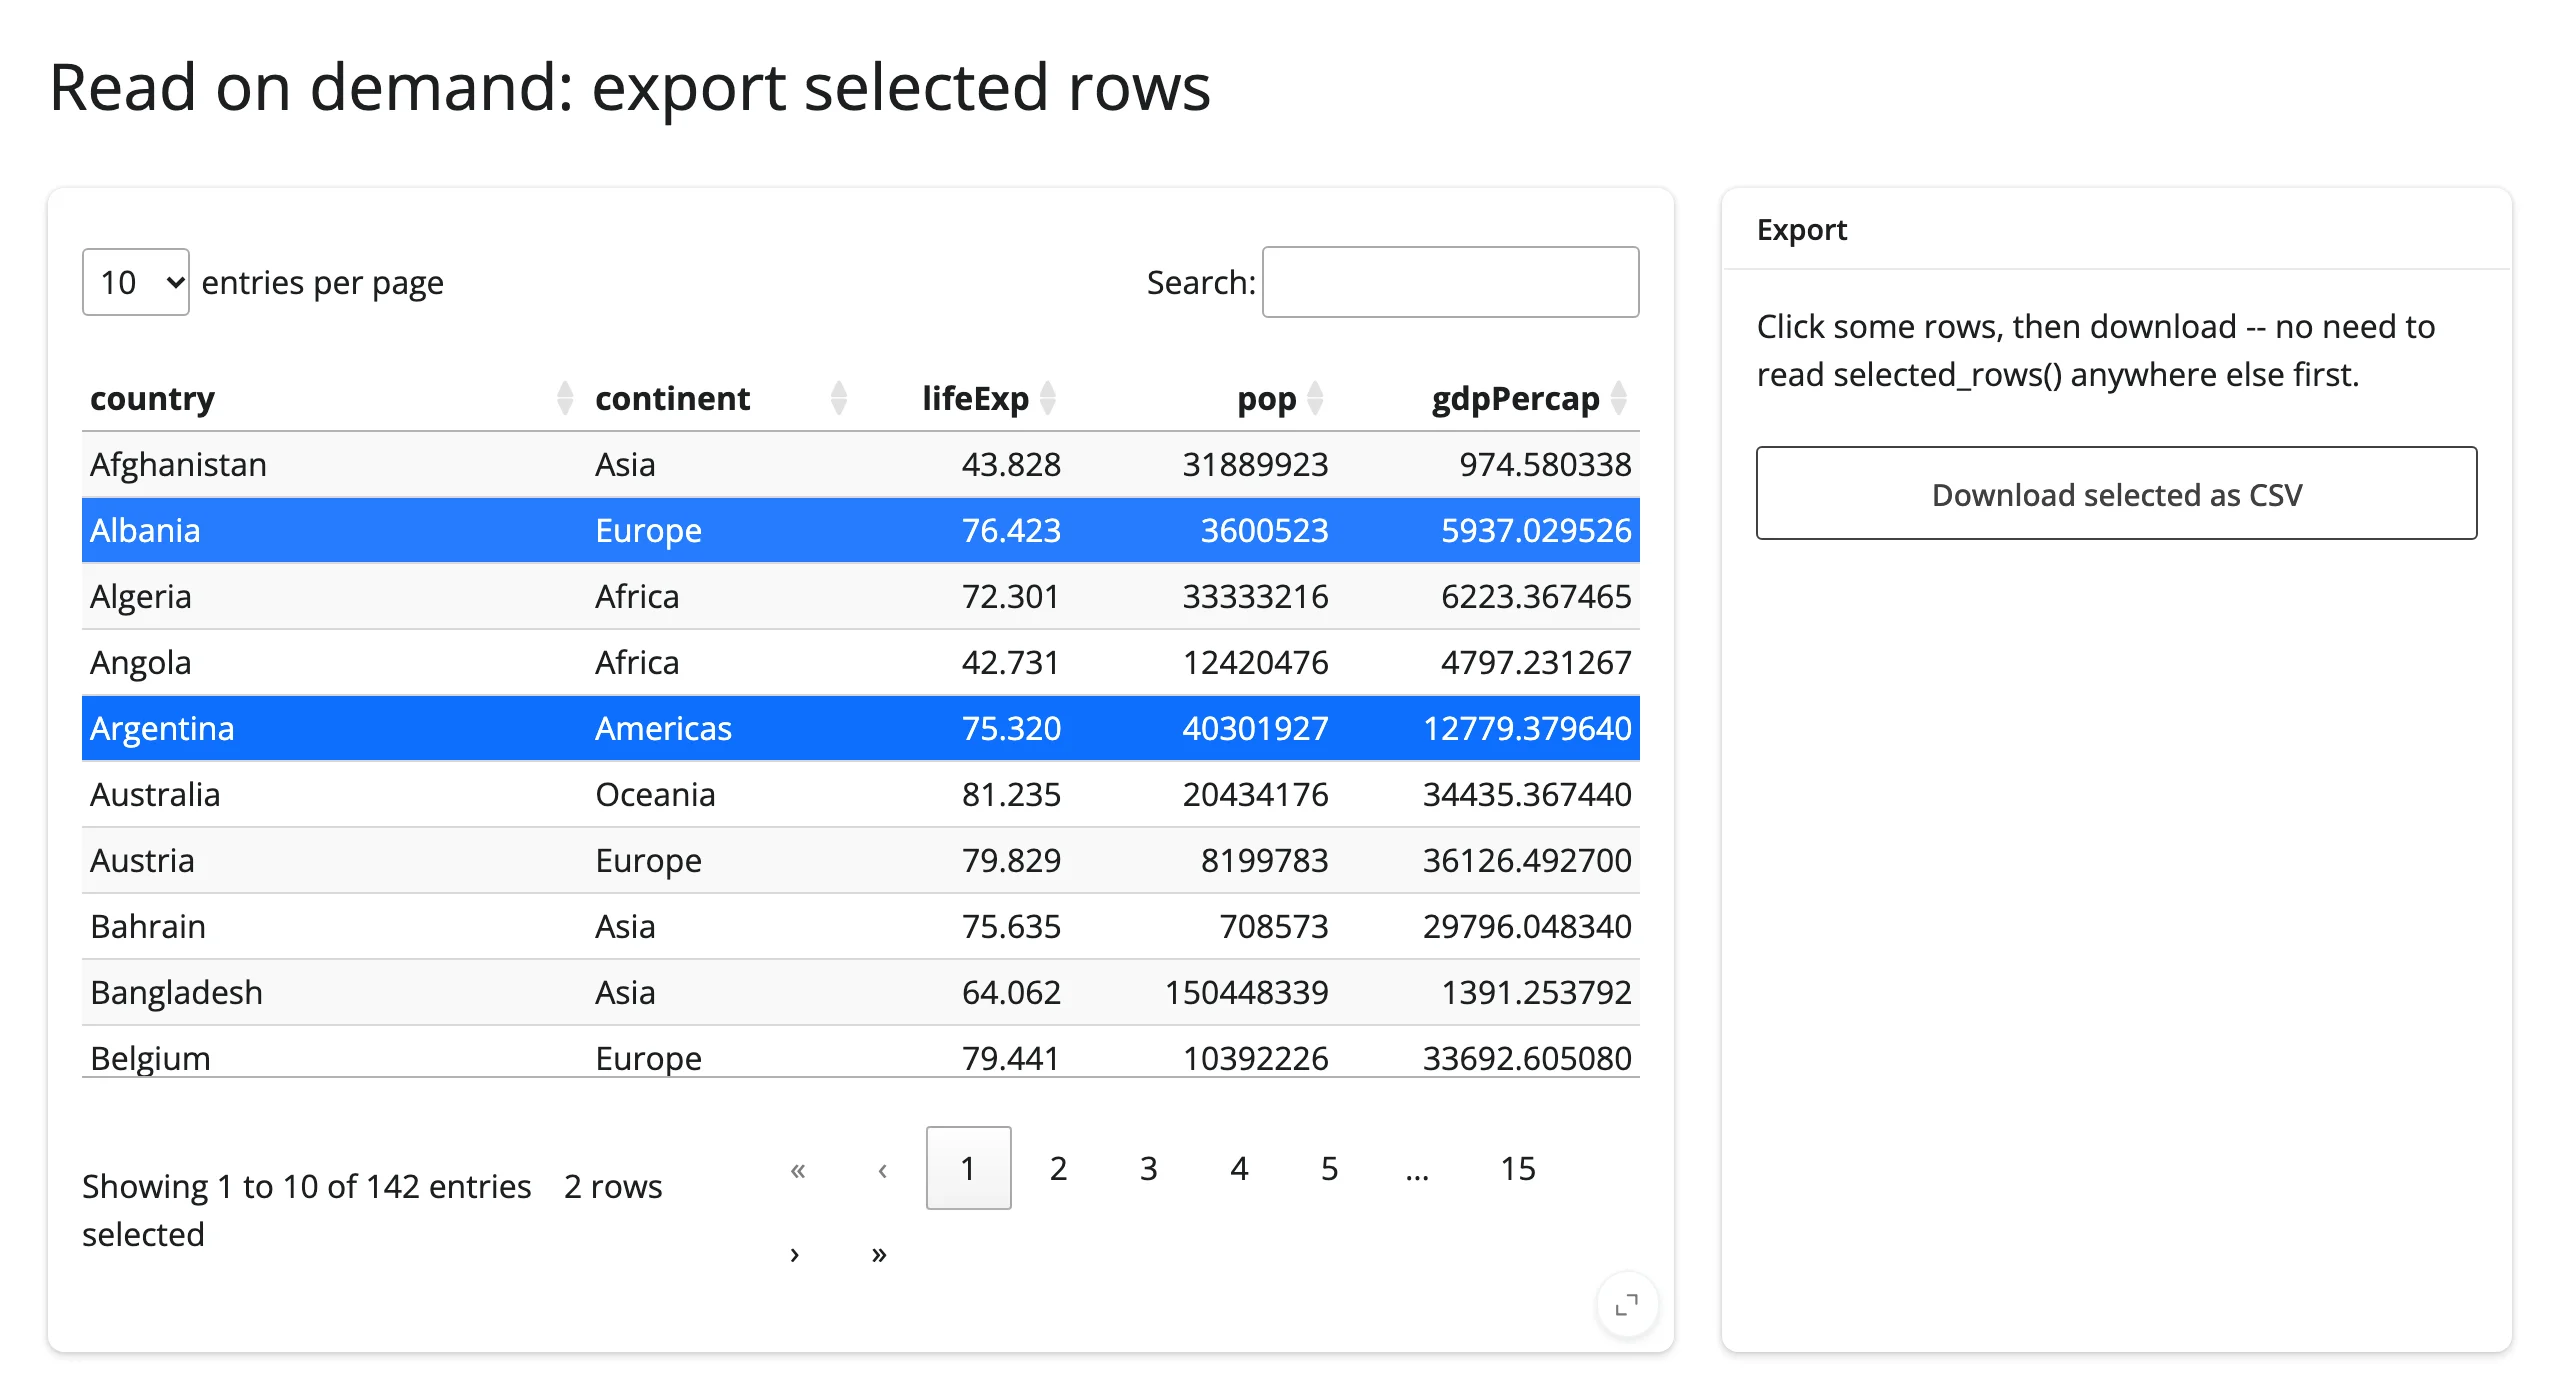
Because the accessor is live from the moment the table renders, you can read it the instant you need the value – in a download handler, a button click, a chat tool call – with no reader warming it up first. examples/15_export_selected.py:
import io

import plotly.express as px
from itables.widget import ITable
from shiny.express import render, ui
from shinywidgets import render_itables

ui.page_opts(title="Read on demand: export selected rows", fillable=True)

countries = px.data.gapminder().query("year == 2007")[
    ["country", "continent", "lifeExp", "pop", "gdpPercap"]
].reset_index(drop=True)

with ui.layout_columns(col_widths=[8, 4]):
    with ui.card(full_screen=True):

        @render_itables
        def table():
            return ITable(countries, select=True)

    with ui.card():
        ui.card_header("Export")
        ui.p("Click some rows, then download -- no need to read selected_rows() anywhere else first.")

        # selected_rows() is live from the moment the table renders, whether
        # or not anything has read it yet, so this handler can read it cold,
        # the instant the user clicks download: no warm-up reader required.
        @render.download_button(filename="selected_countries.csv", label="Download selected as CSV")
        def download_csv():
            rows = table.selected_rows()
            buf = io.StringIO()
            countries.iloc[rows].to_csv(buf, index=False)
            yield buf.getvalue()
Clicking Albania and Ctrl/Cmd-clicking Argentina, then downloading – the exported CSV contains exactly those two rows, read cold at click time:
Beyond the accessors: reactive_read
ITable has little else worth reading reactively: selected_rows is the only trait a user interaction changes. caption and the DataTables options are write side (set from Python, not read back), and the data itself isn’t a trait at all. table.read("selected_rows") (or reactive_read(table.widget, "selected_rows")) behaves identically to table.selected_rows() except for rate limiting (next section) – there’s no other synced trait worth reaching for read() or reactive_read() over the named accessor.
Rate limiting
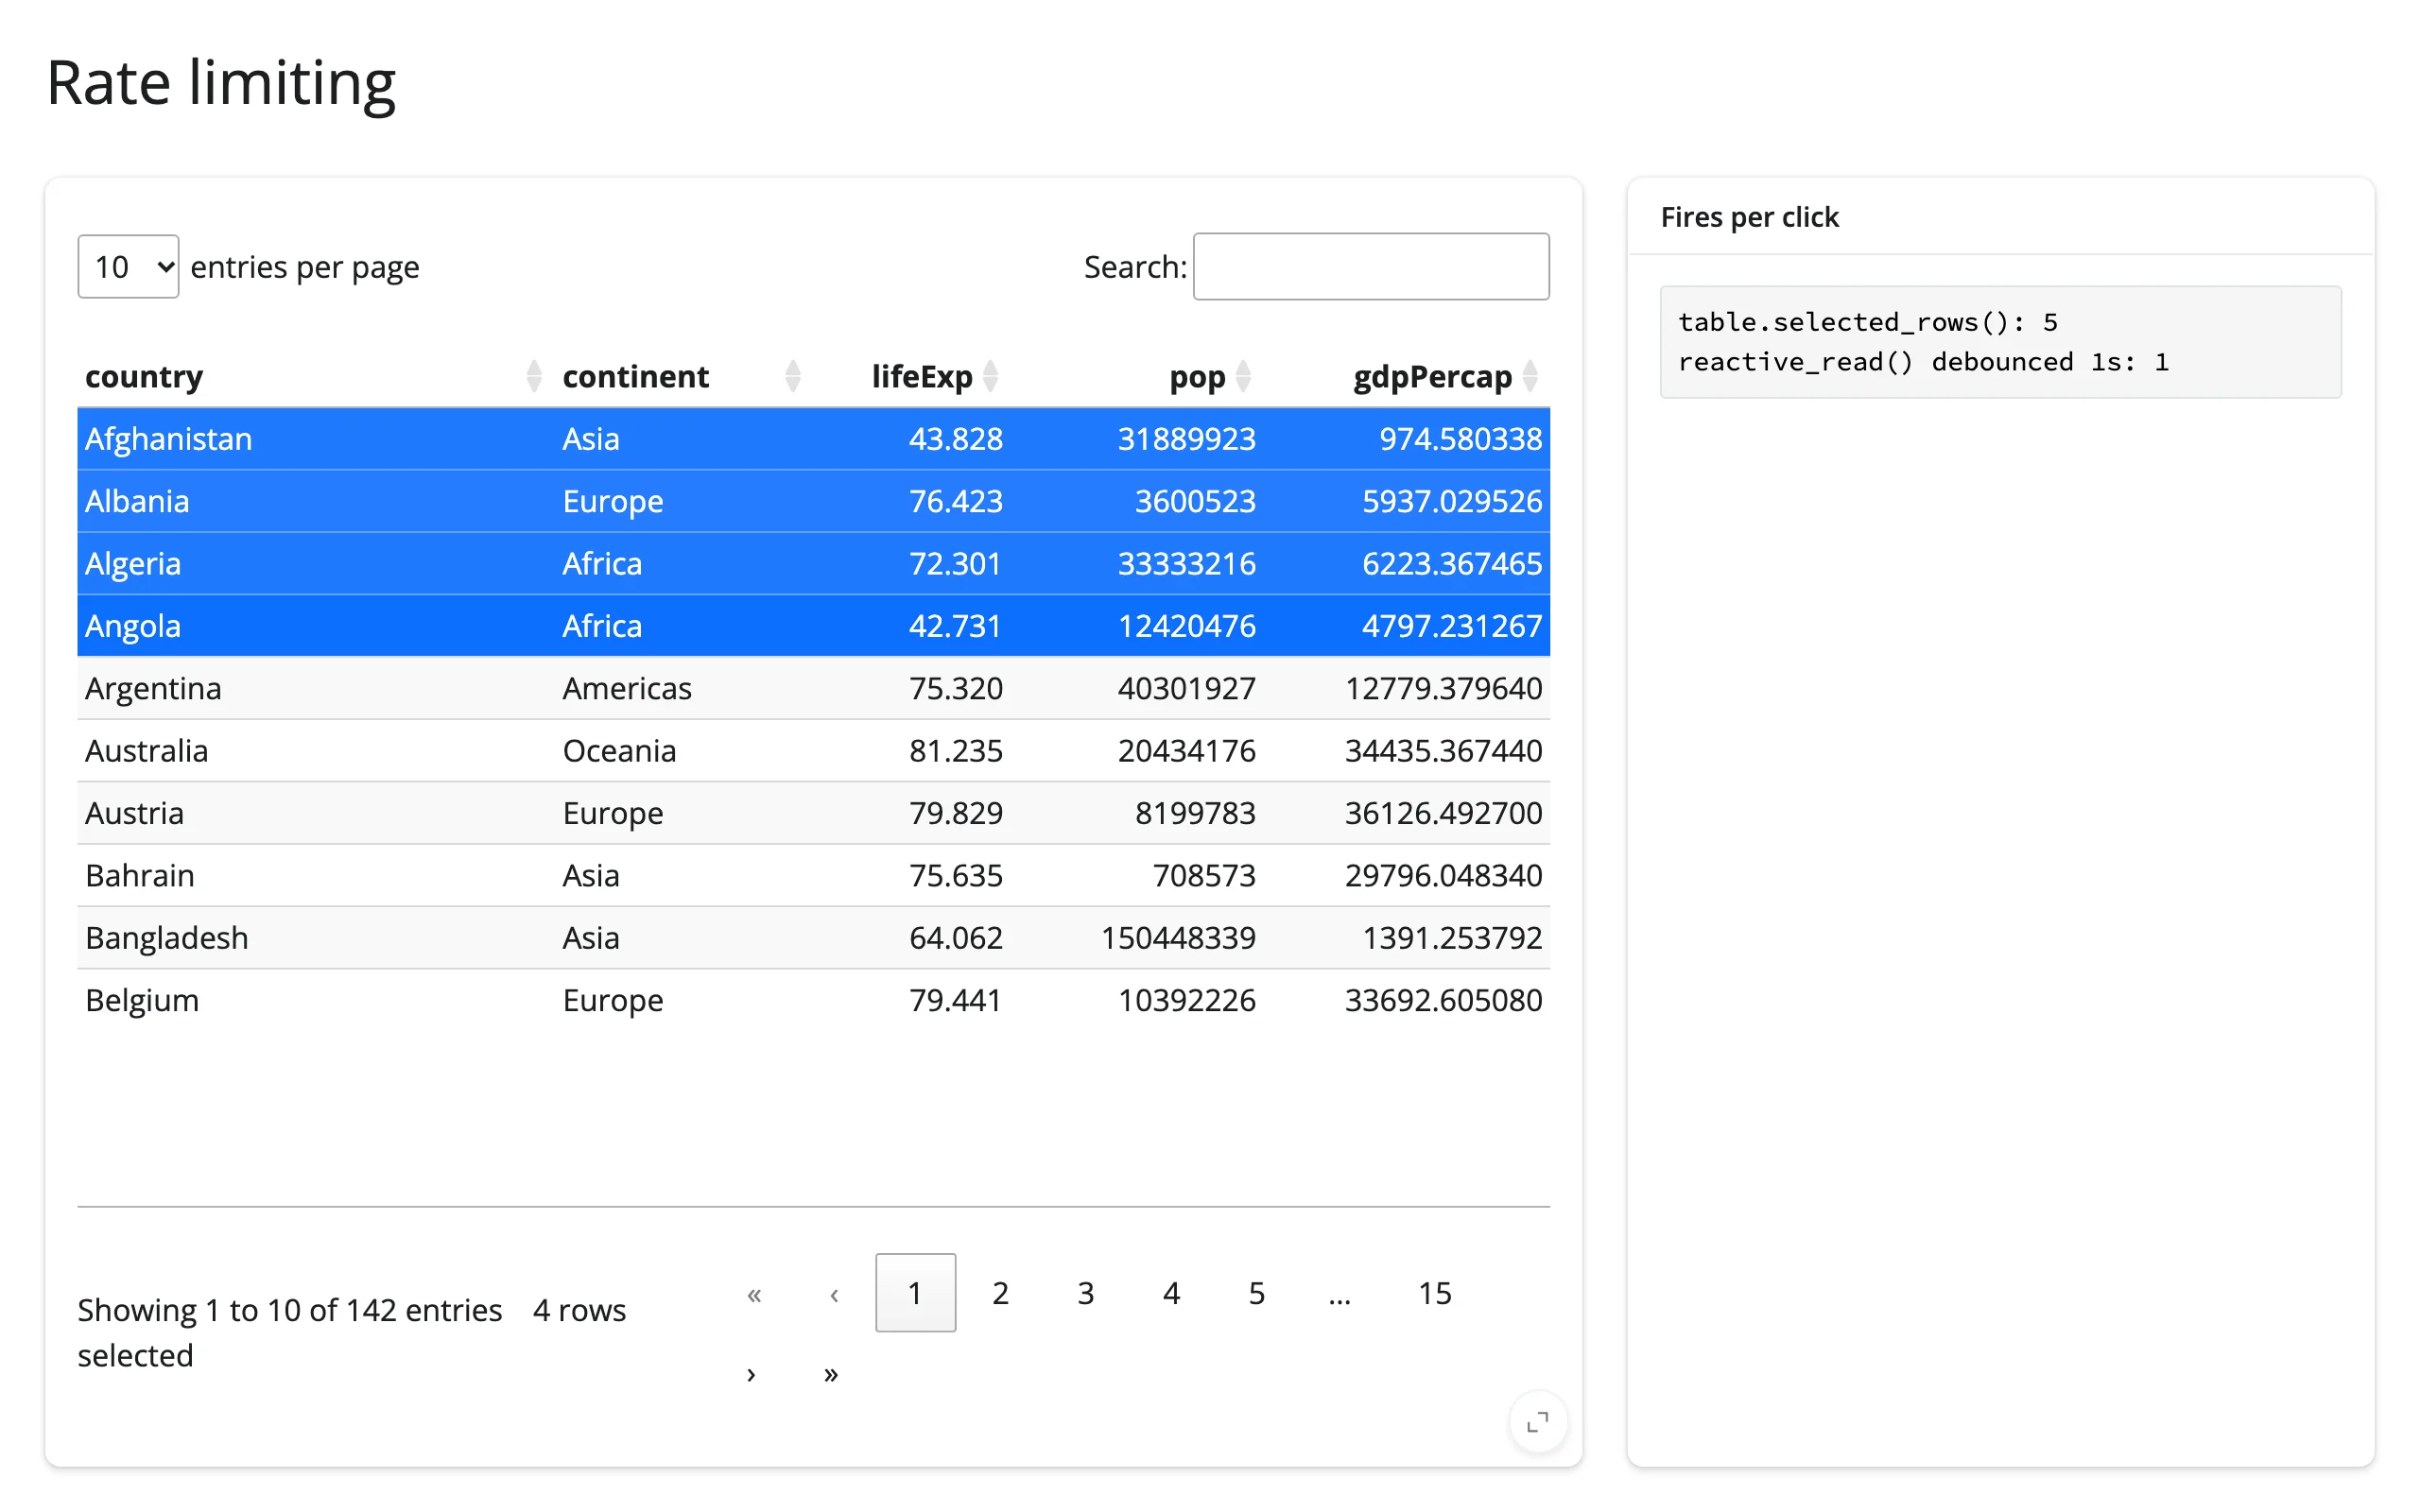
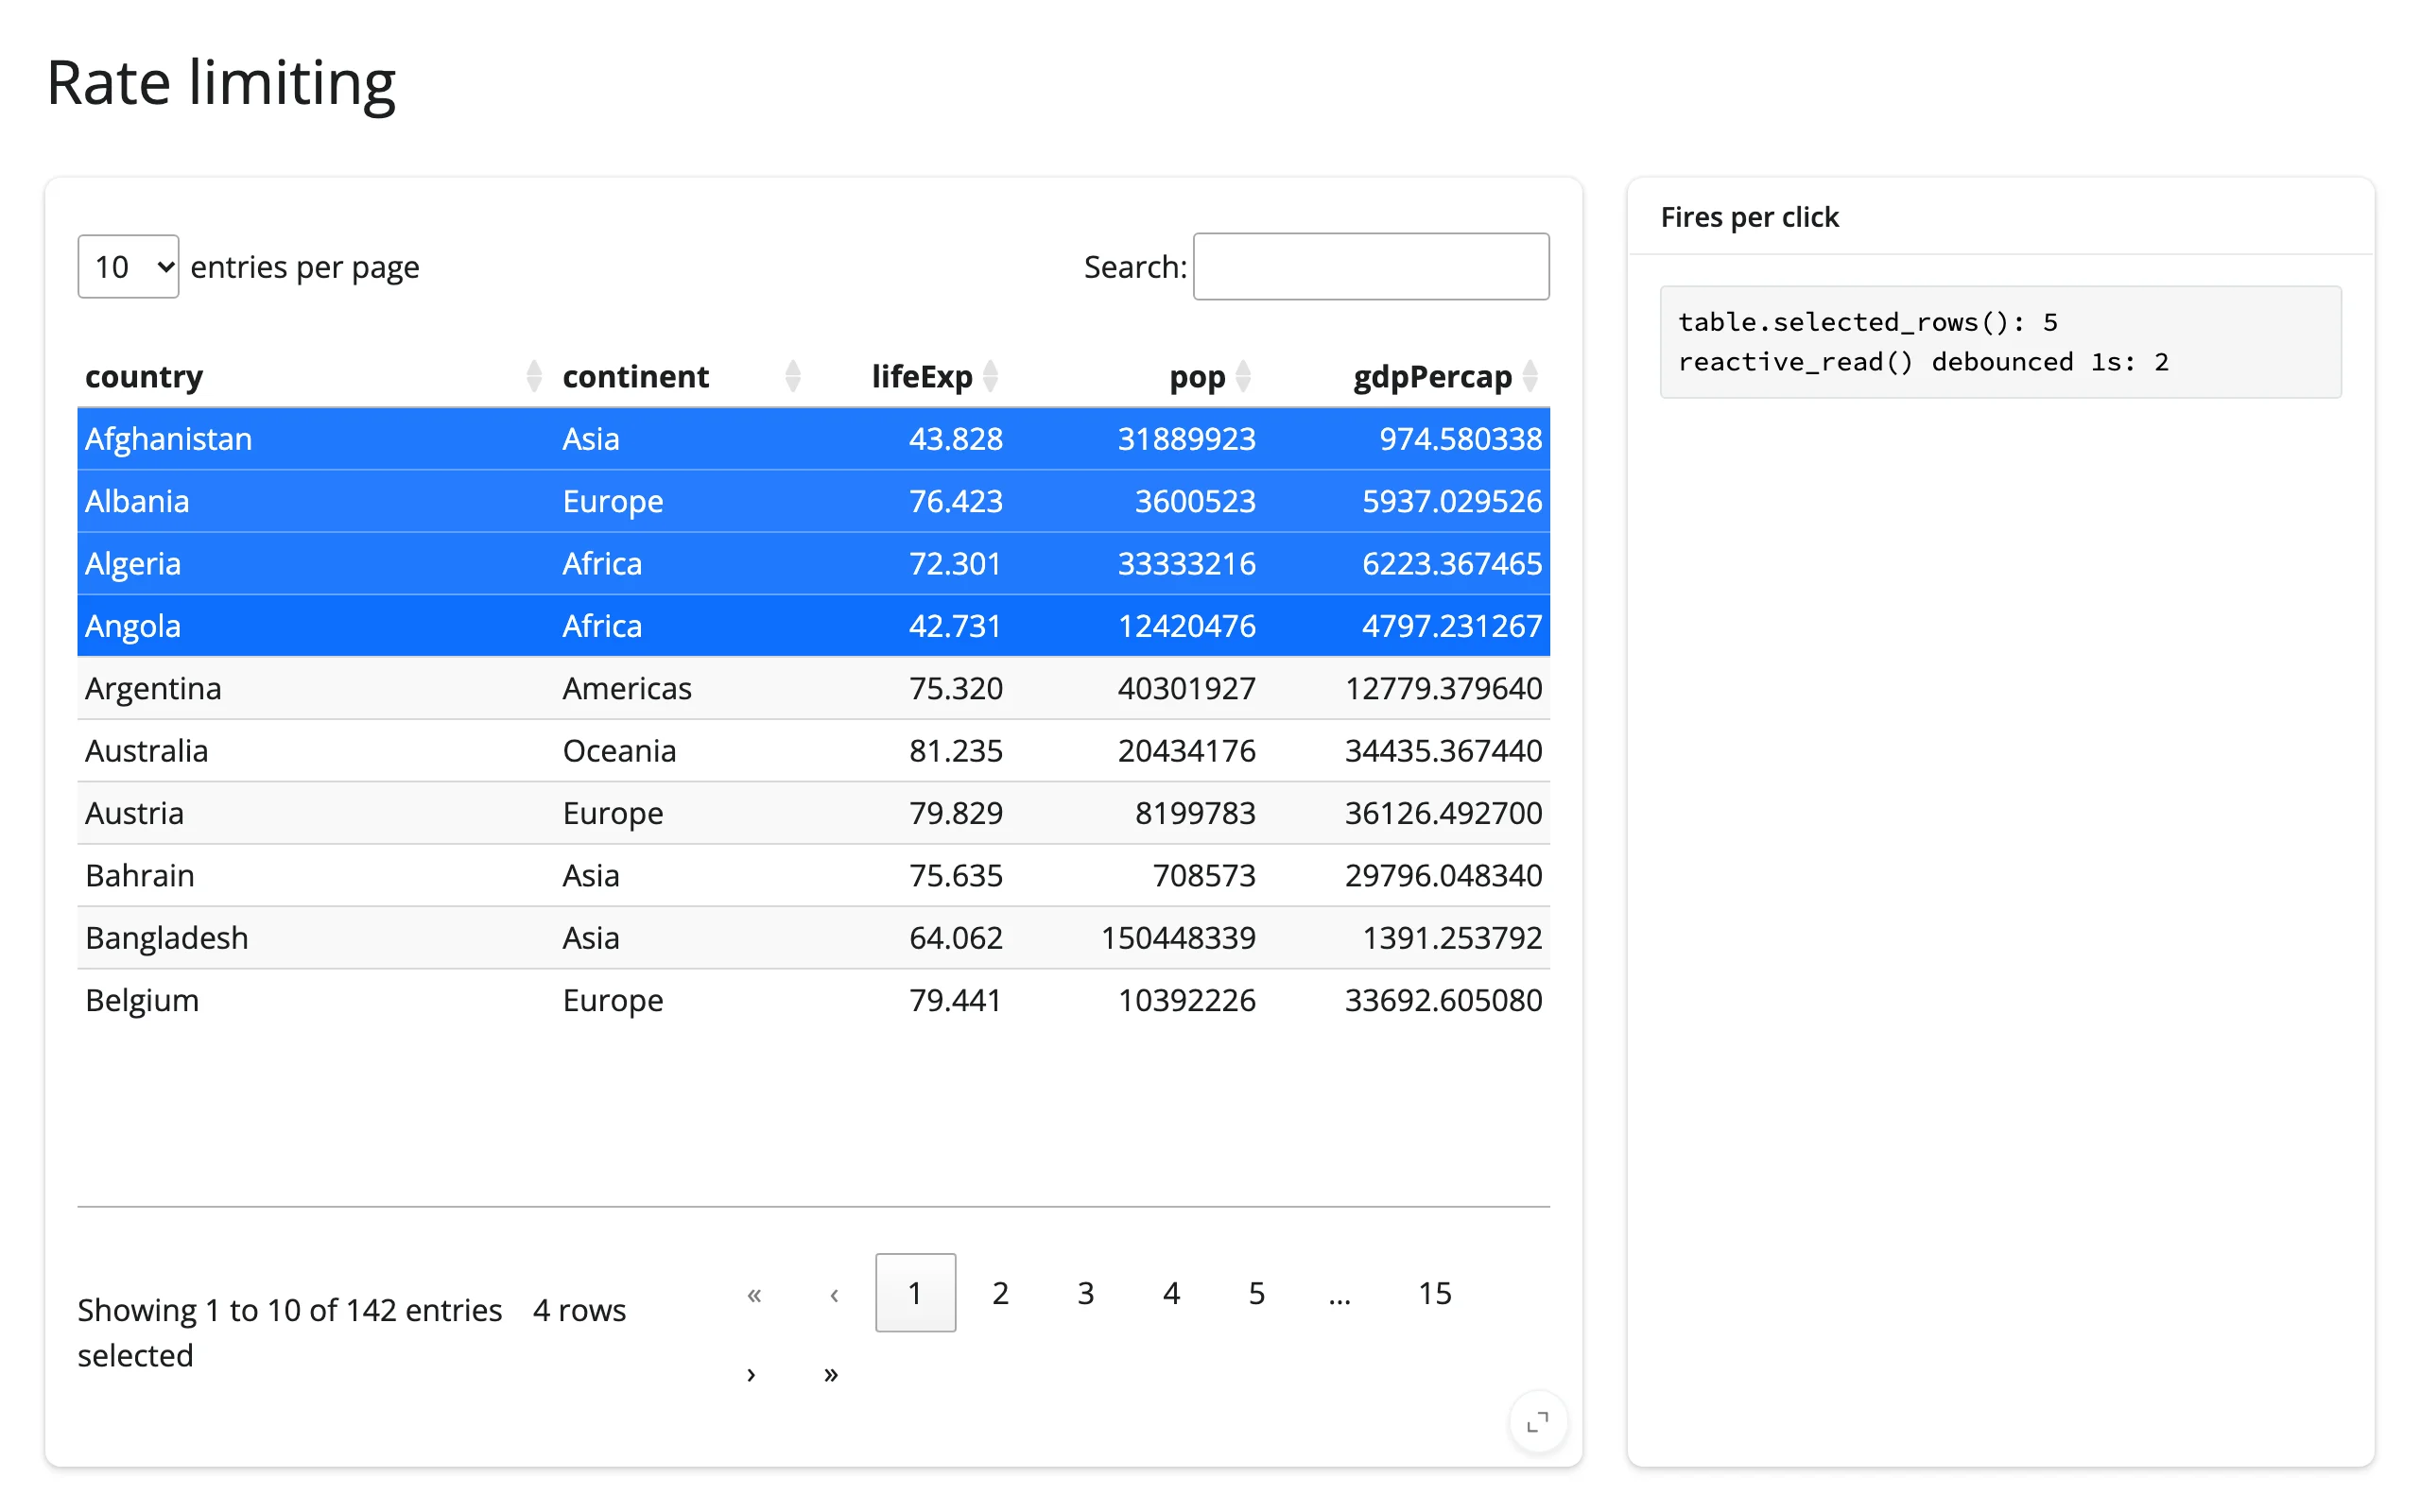
selected_rows() fires once per click, not a continuous stream, so there’s nothing to smooth: the renderer’s rate_policy/rate_delay kwargs have no effect on the accessor. They rate-limit reactive_read() on the widget instead (any trait, not just selected_rows) – useful if a burst of clicks (e.g. Shift-clicking across many rows) would otherwise each trigger an expensive recompute downstream.
with ui.layout_columns(col_widths=[8, 4]):
    with ui.card(full_screen=True):

        @render_itables(rate_policy="debounce", rate_delay=1)
        def table():
            return ITable(countries, select=True)

    with ui.card():
        ui.card_header("Fires per click")
        accessor_count = reactive.value(0)
        read_count = reactive.value(0)

        @reactive.effect
        def _count_accessor():
            table.selected_rows()
            with reactive.isolate():
                accessor_count.set(accessor_count() + 1)

        @reactive.effect
        def _count_reactive_read():
            req(table.widget)
            reactive_read(table.widget, "selected_rows")
            with reactive.isolate():
                read_count.set(read_count() + 1)

        @render.code
        def counts():
            return (
                f"table.selected_rows(): {accessor_count()}\n"
                f"reactive_read() debounced 1s: {read_count()}"
            )
Four quick clicks: the accessor-driven counter climbs with every click; the reactive_read() counter, debounced to 1 second, is still waiting out the window:
A second later, the debounce fires once and the counter catches up by exactly one:
Updating the widget from Python
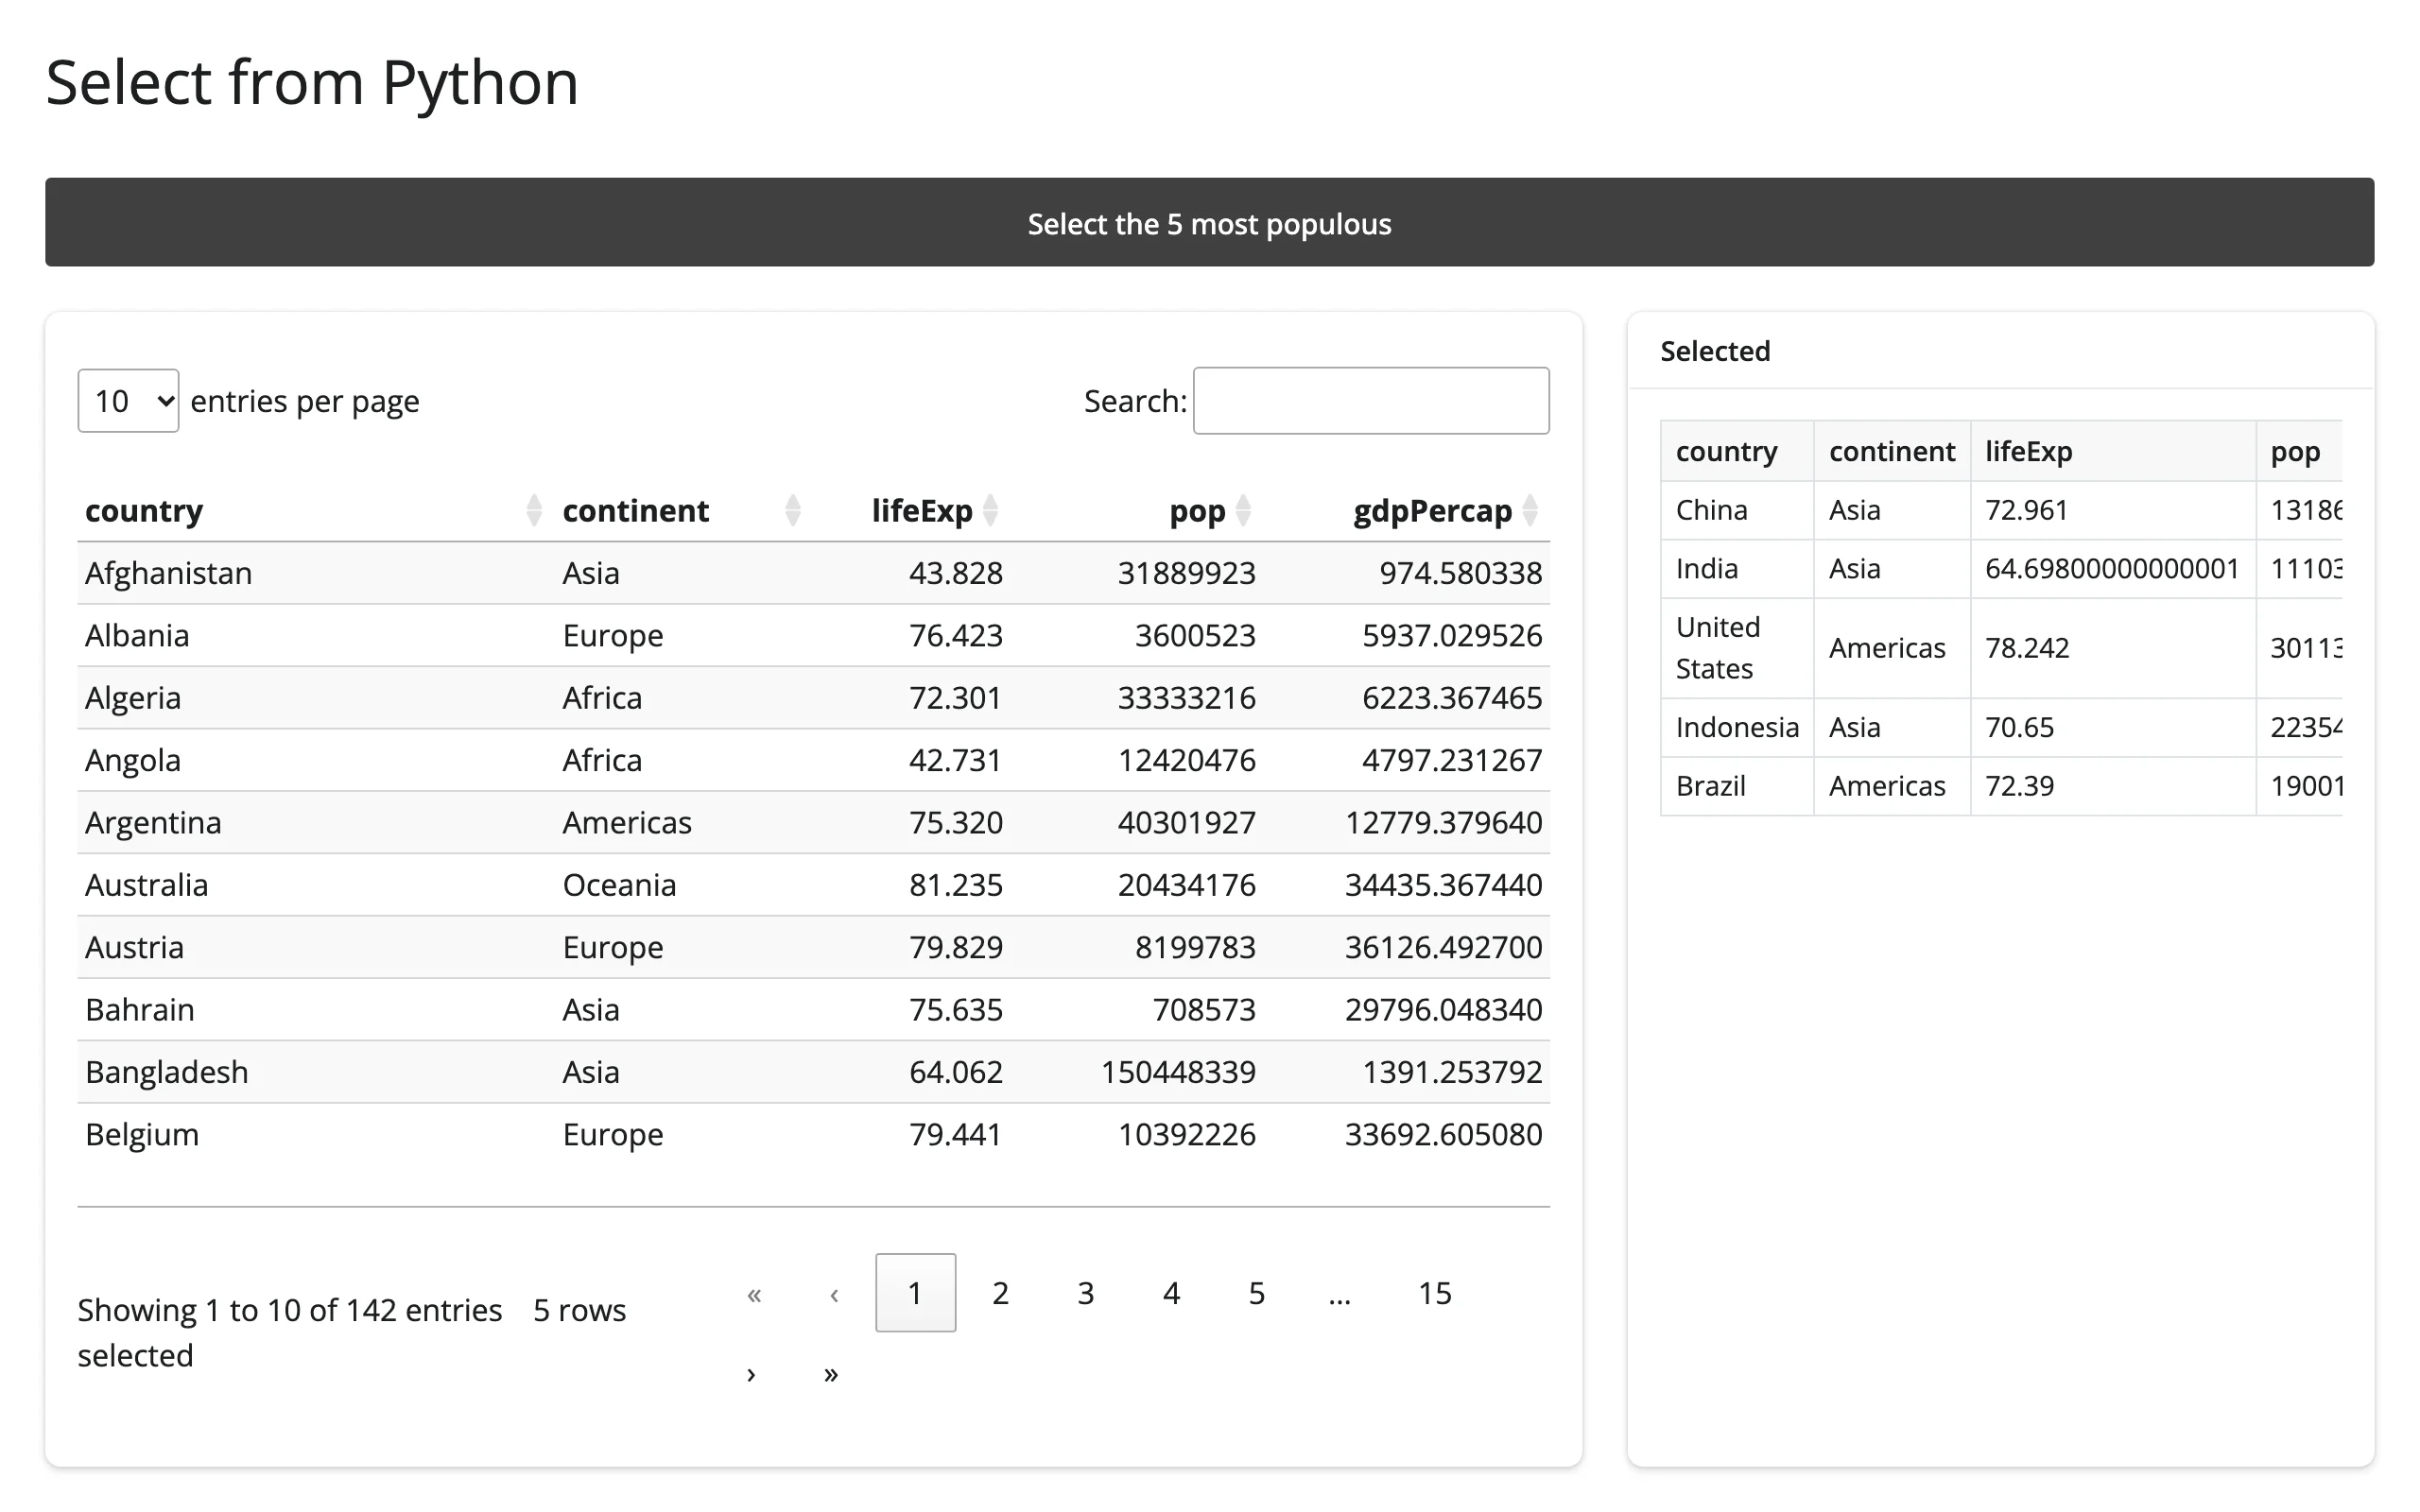
Selection, set directly, applies immediately in the browser exactly as if the user had clicked – no re-render, so the rest of the table’s state (sort, search, scroll, page) is untouched:
@reactive.effect
@reactive.event(input.top5)
def _select_top5():
    # Setting .selected_rows on the widget highlights those rows in the
    # browser immediately, exactly as if the user had clicked them -- no
    # re-render, so sort/search/scroll state is untouched.
    top5 = countries.nlargest(5, "pop").index.tolist()
    table.widget.selected_rows = top5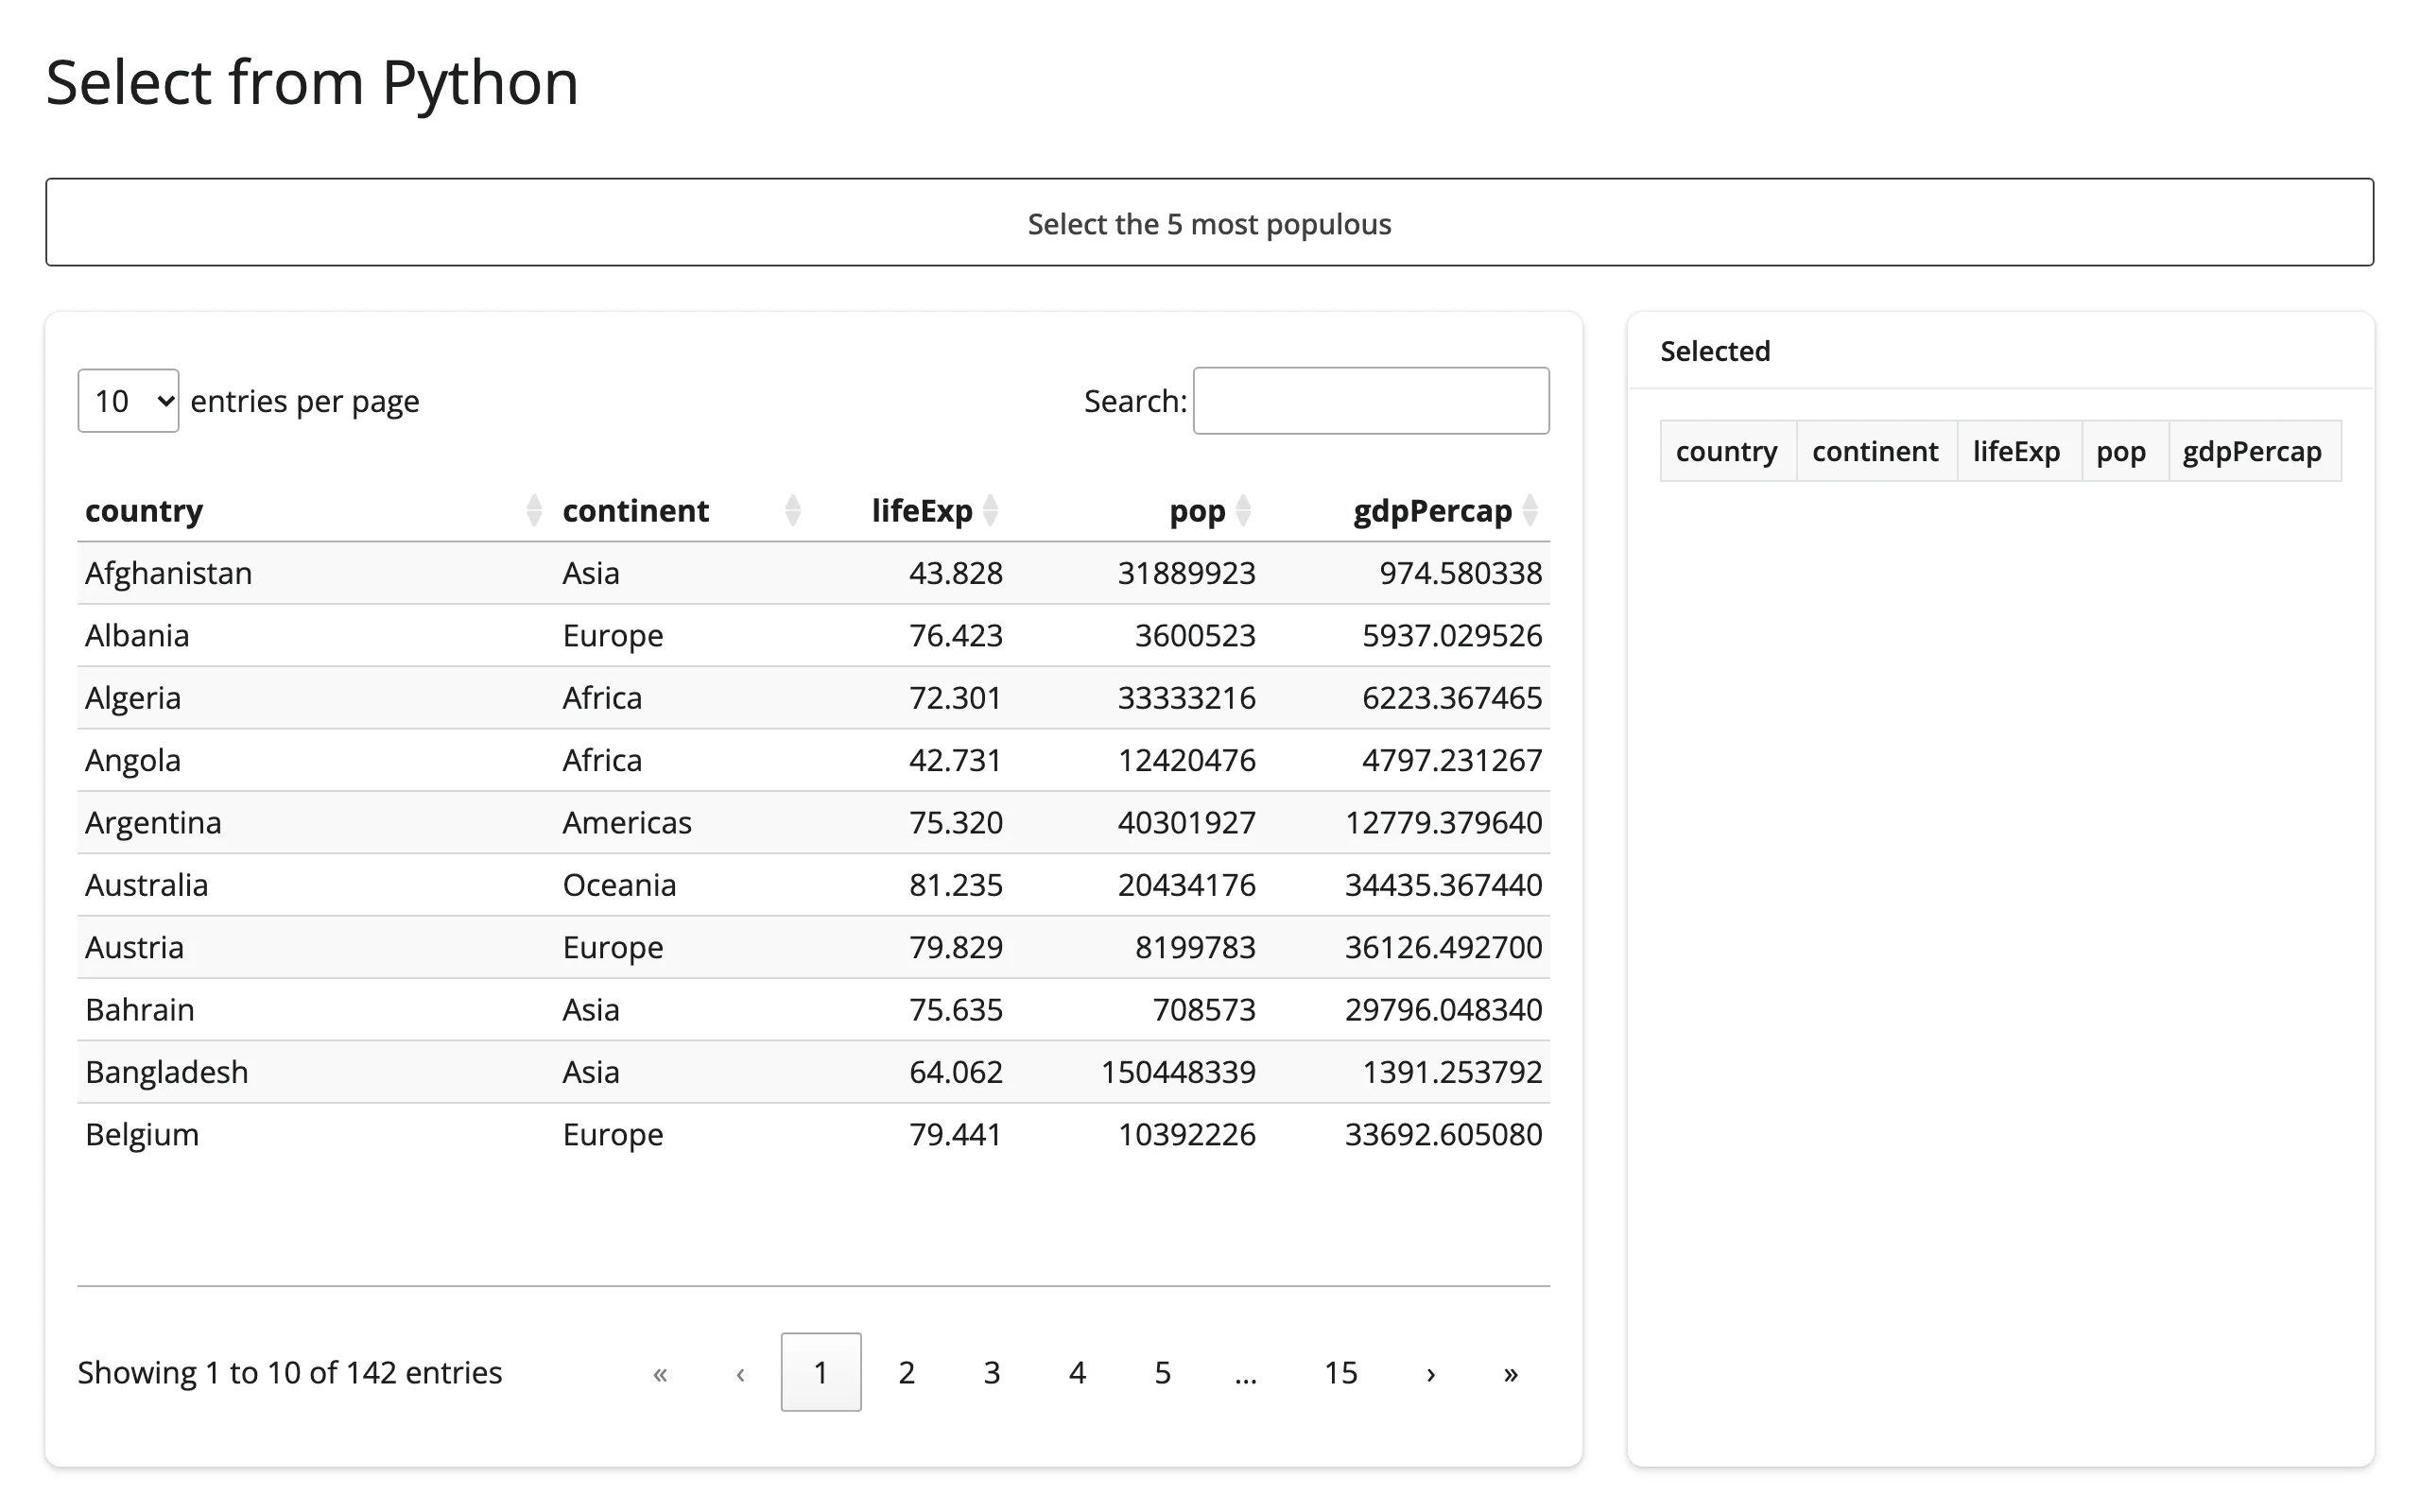
Data, swapped with .widget.update(df, **options), updates in place rather than tearing down and rebuilding the DataTables instance a re-render would cause – the browser never re-fetches itables’ JS bundle, and anything the update doesn’t touch (sort column, scroll position) survives. The catch: update(df) drops options like columnDefs and buttons unless you pass them again, so keep them in one dict and reuse it everywhere:
    @render_itables
    def table():
        return ITable(countries, select=True, buttons=["copyHtml5"])


@reactive.effect
@reactive.event(input.shrink)
def _shrink():
    top10 = countries.nlargest(10, "pop")
    # Re-passing `buttons` matters: .update(df) without it silently drops the
    # button row (and any columnDefs) that the original ITable(...) call set.
    table.widget.update(top10, buttons=["copyHtml5"])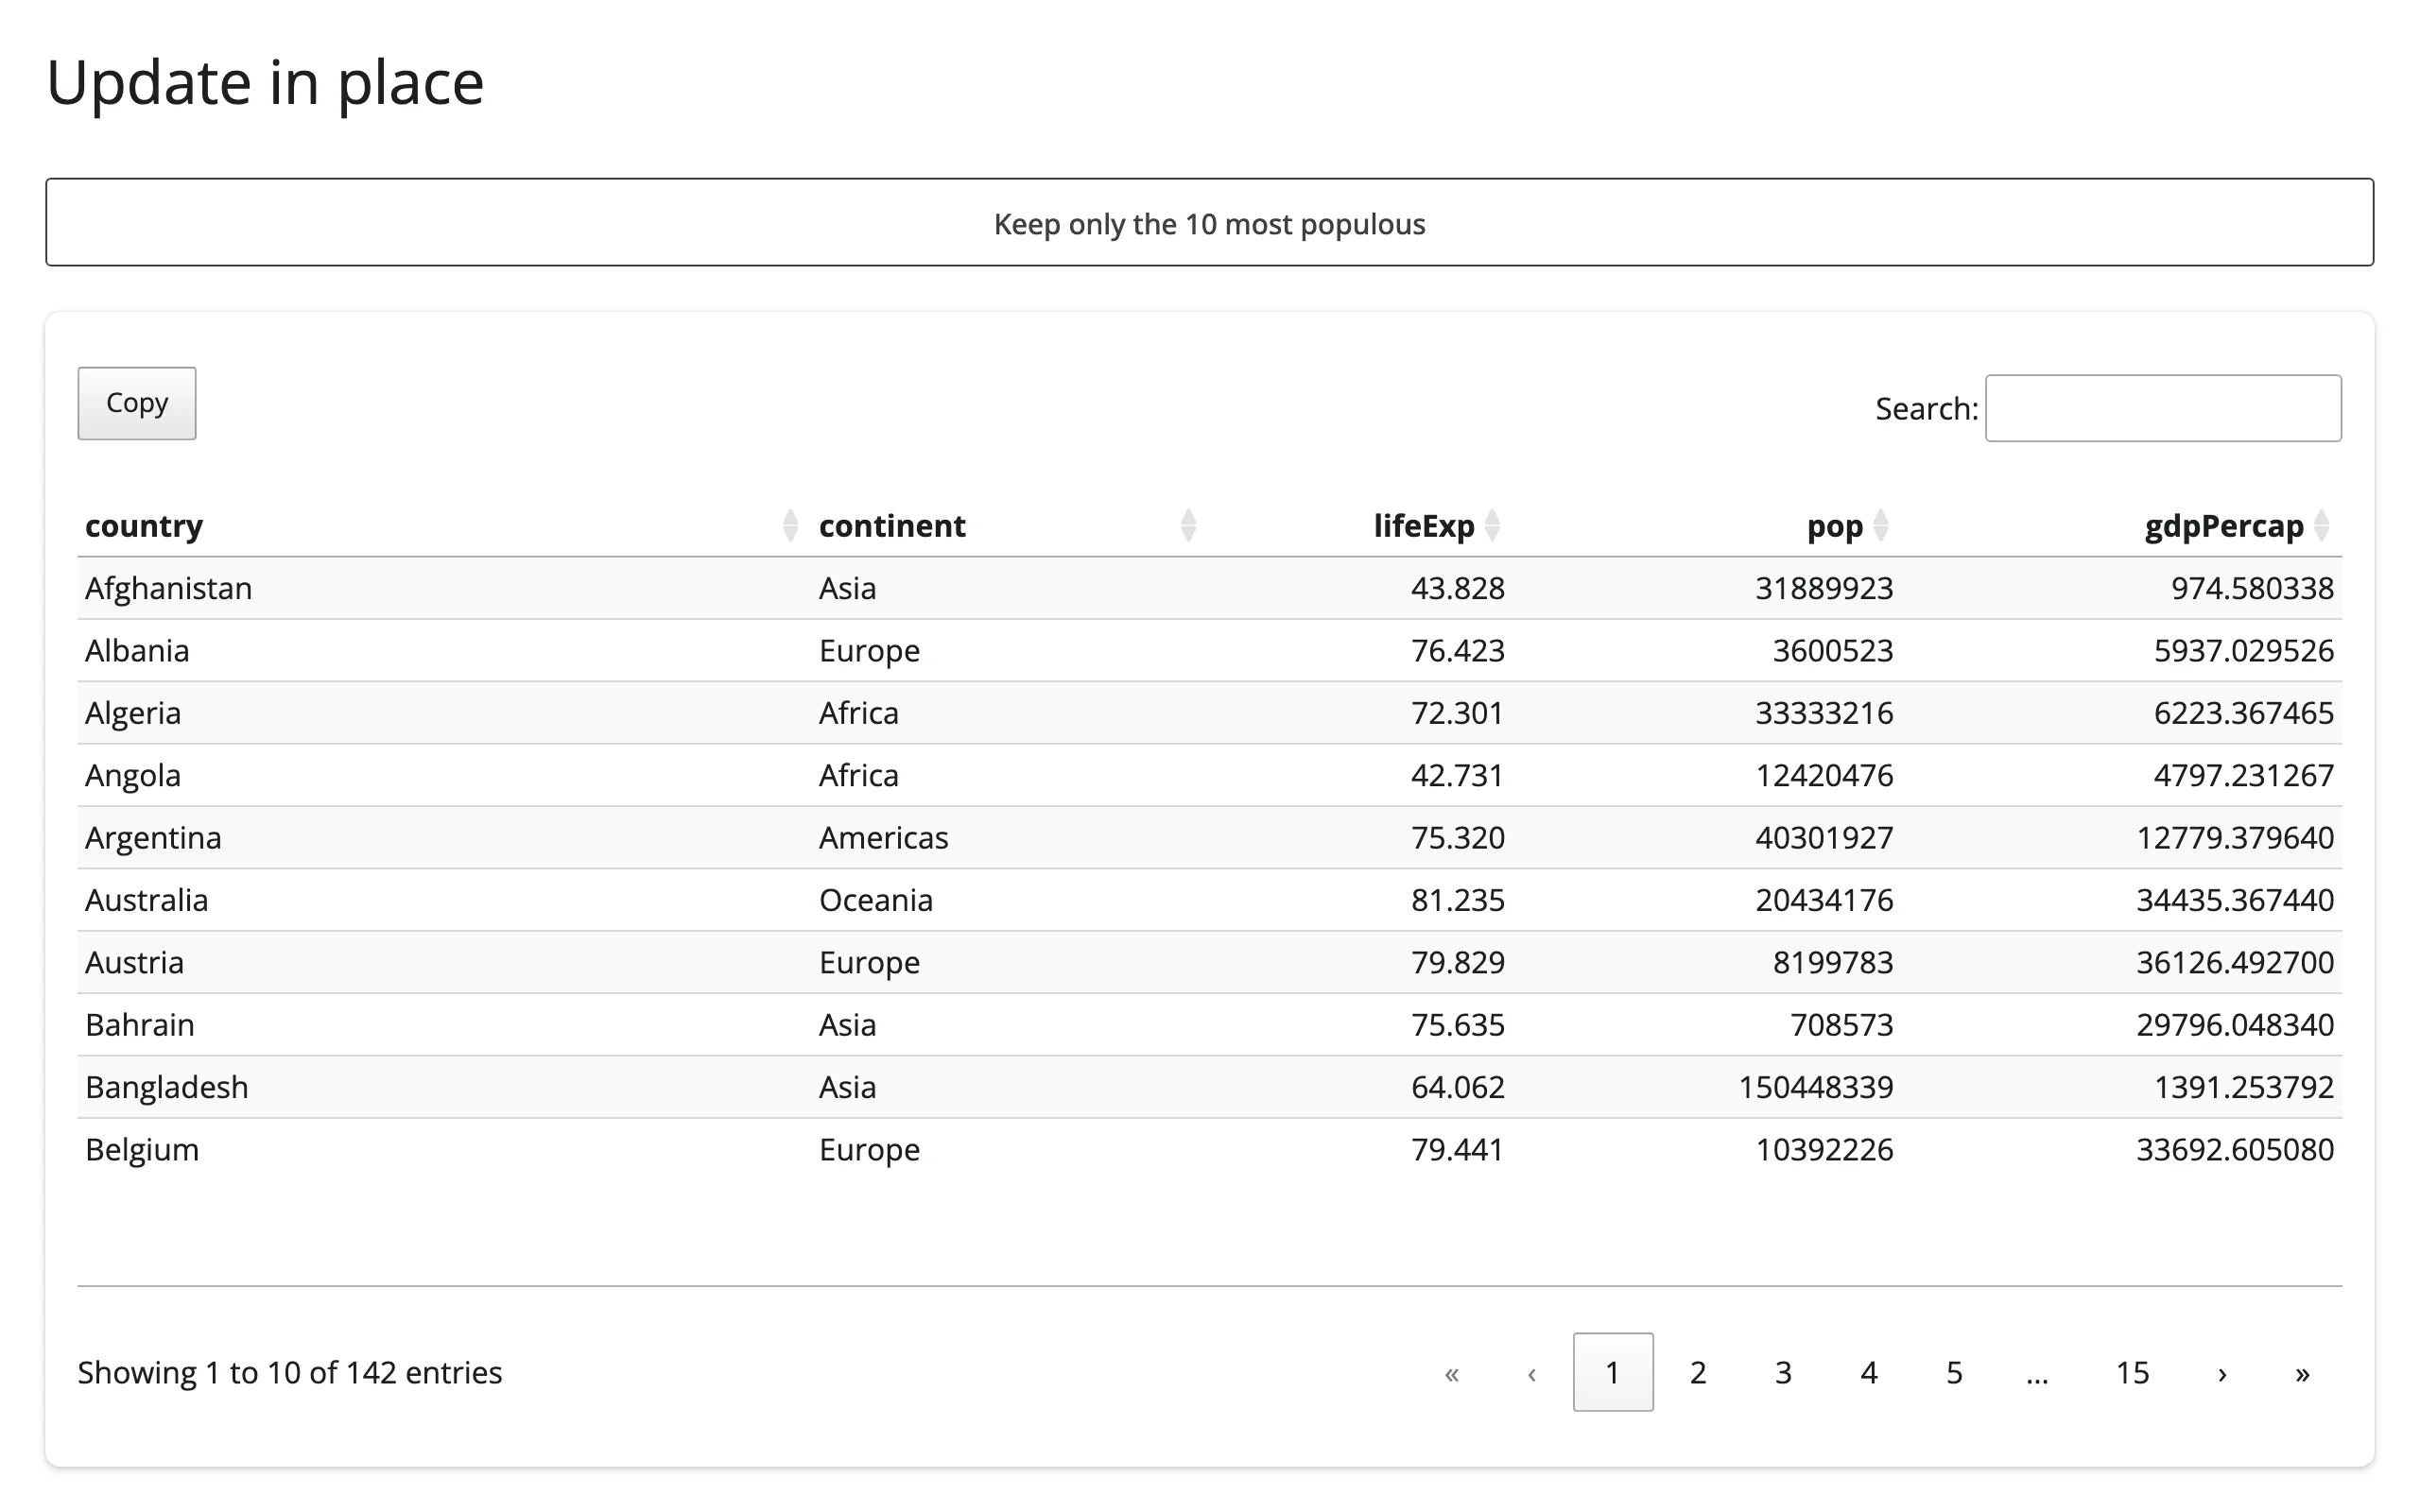
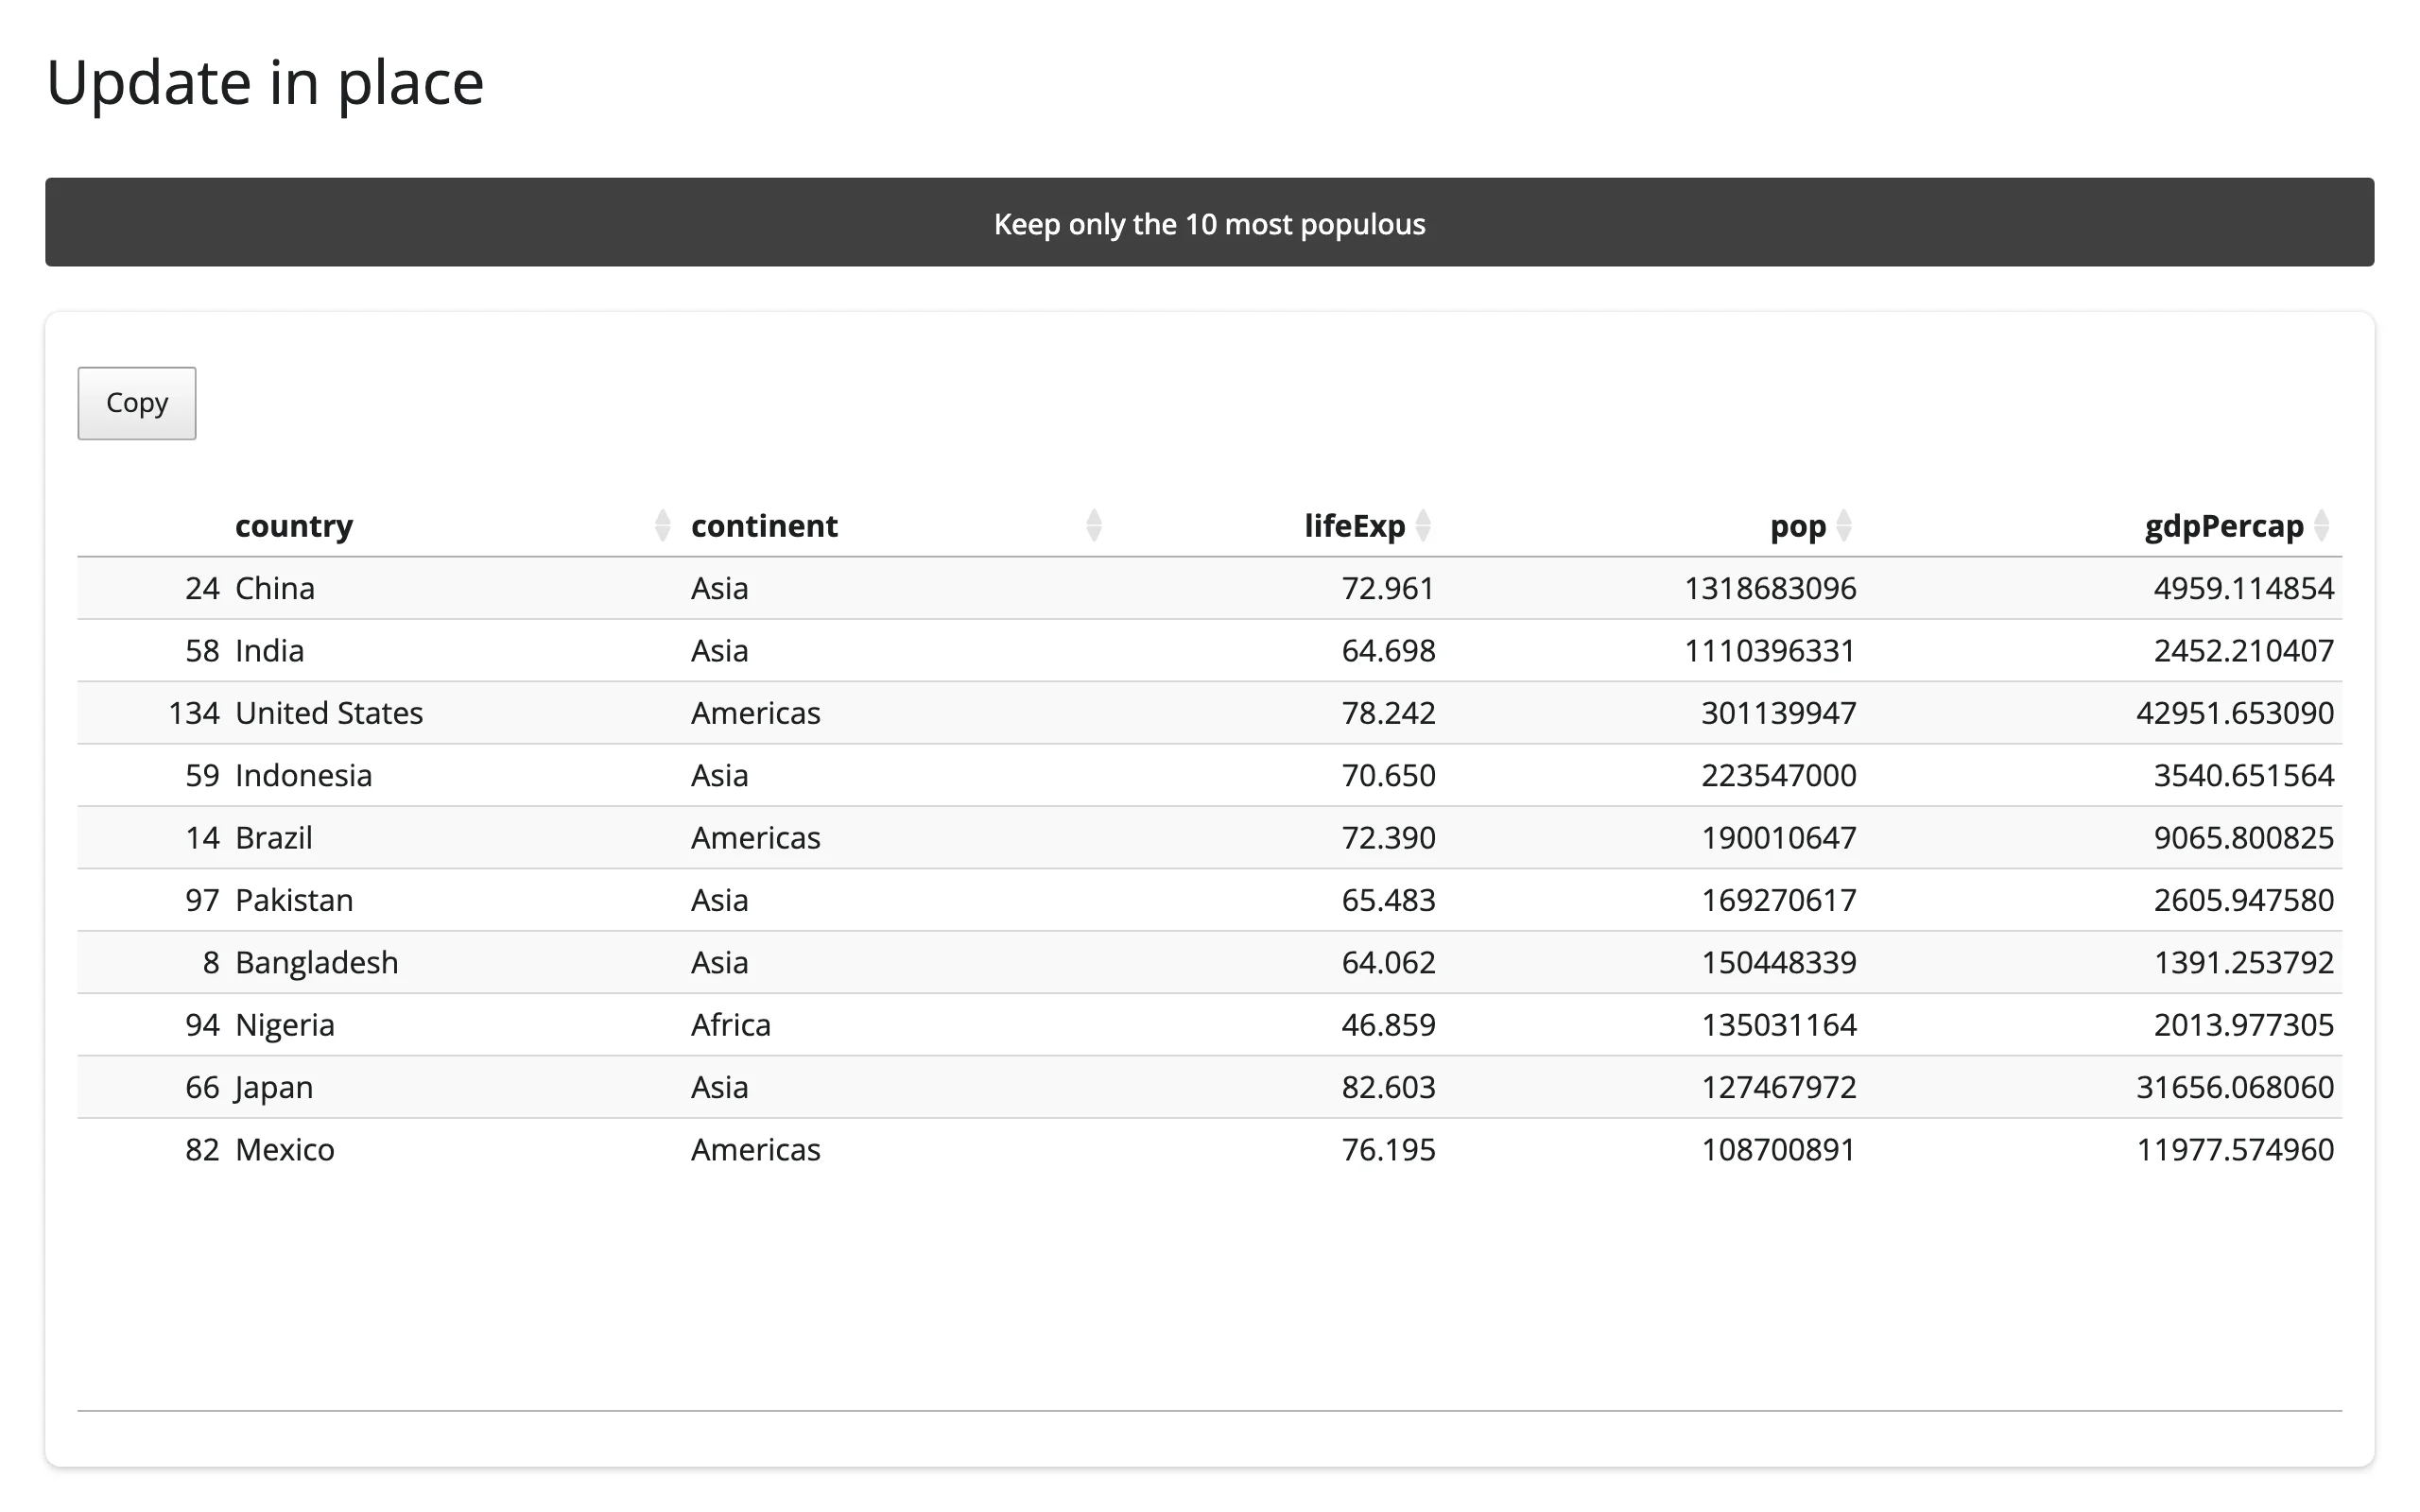
Re-rendering (returning a new value from the decorated function) is simpler and fine for an unrelated input change, but it always starts the table over: sort, search, scroll position, and selection all reset. Prefer .widget.update() when the user is mid-exploration of the same table and you don’t want to throw that away – see Coordinating multiple views for keeping the selection too.
Coordinating multiple views
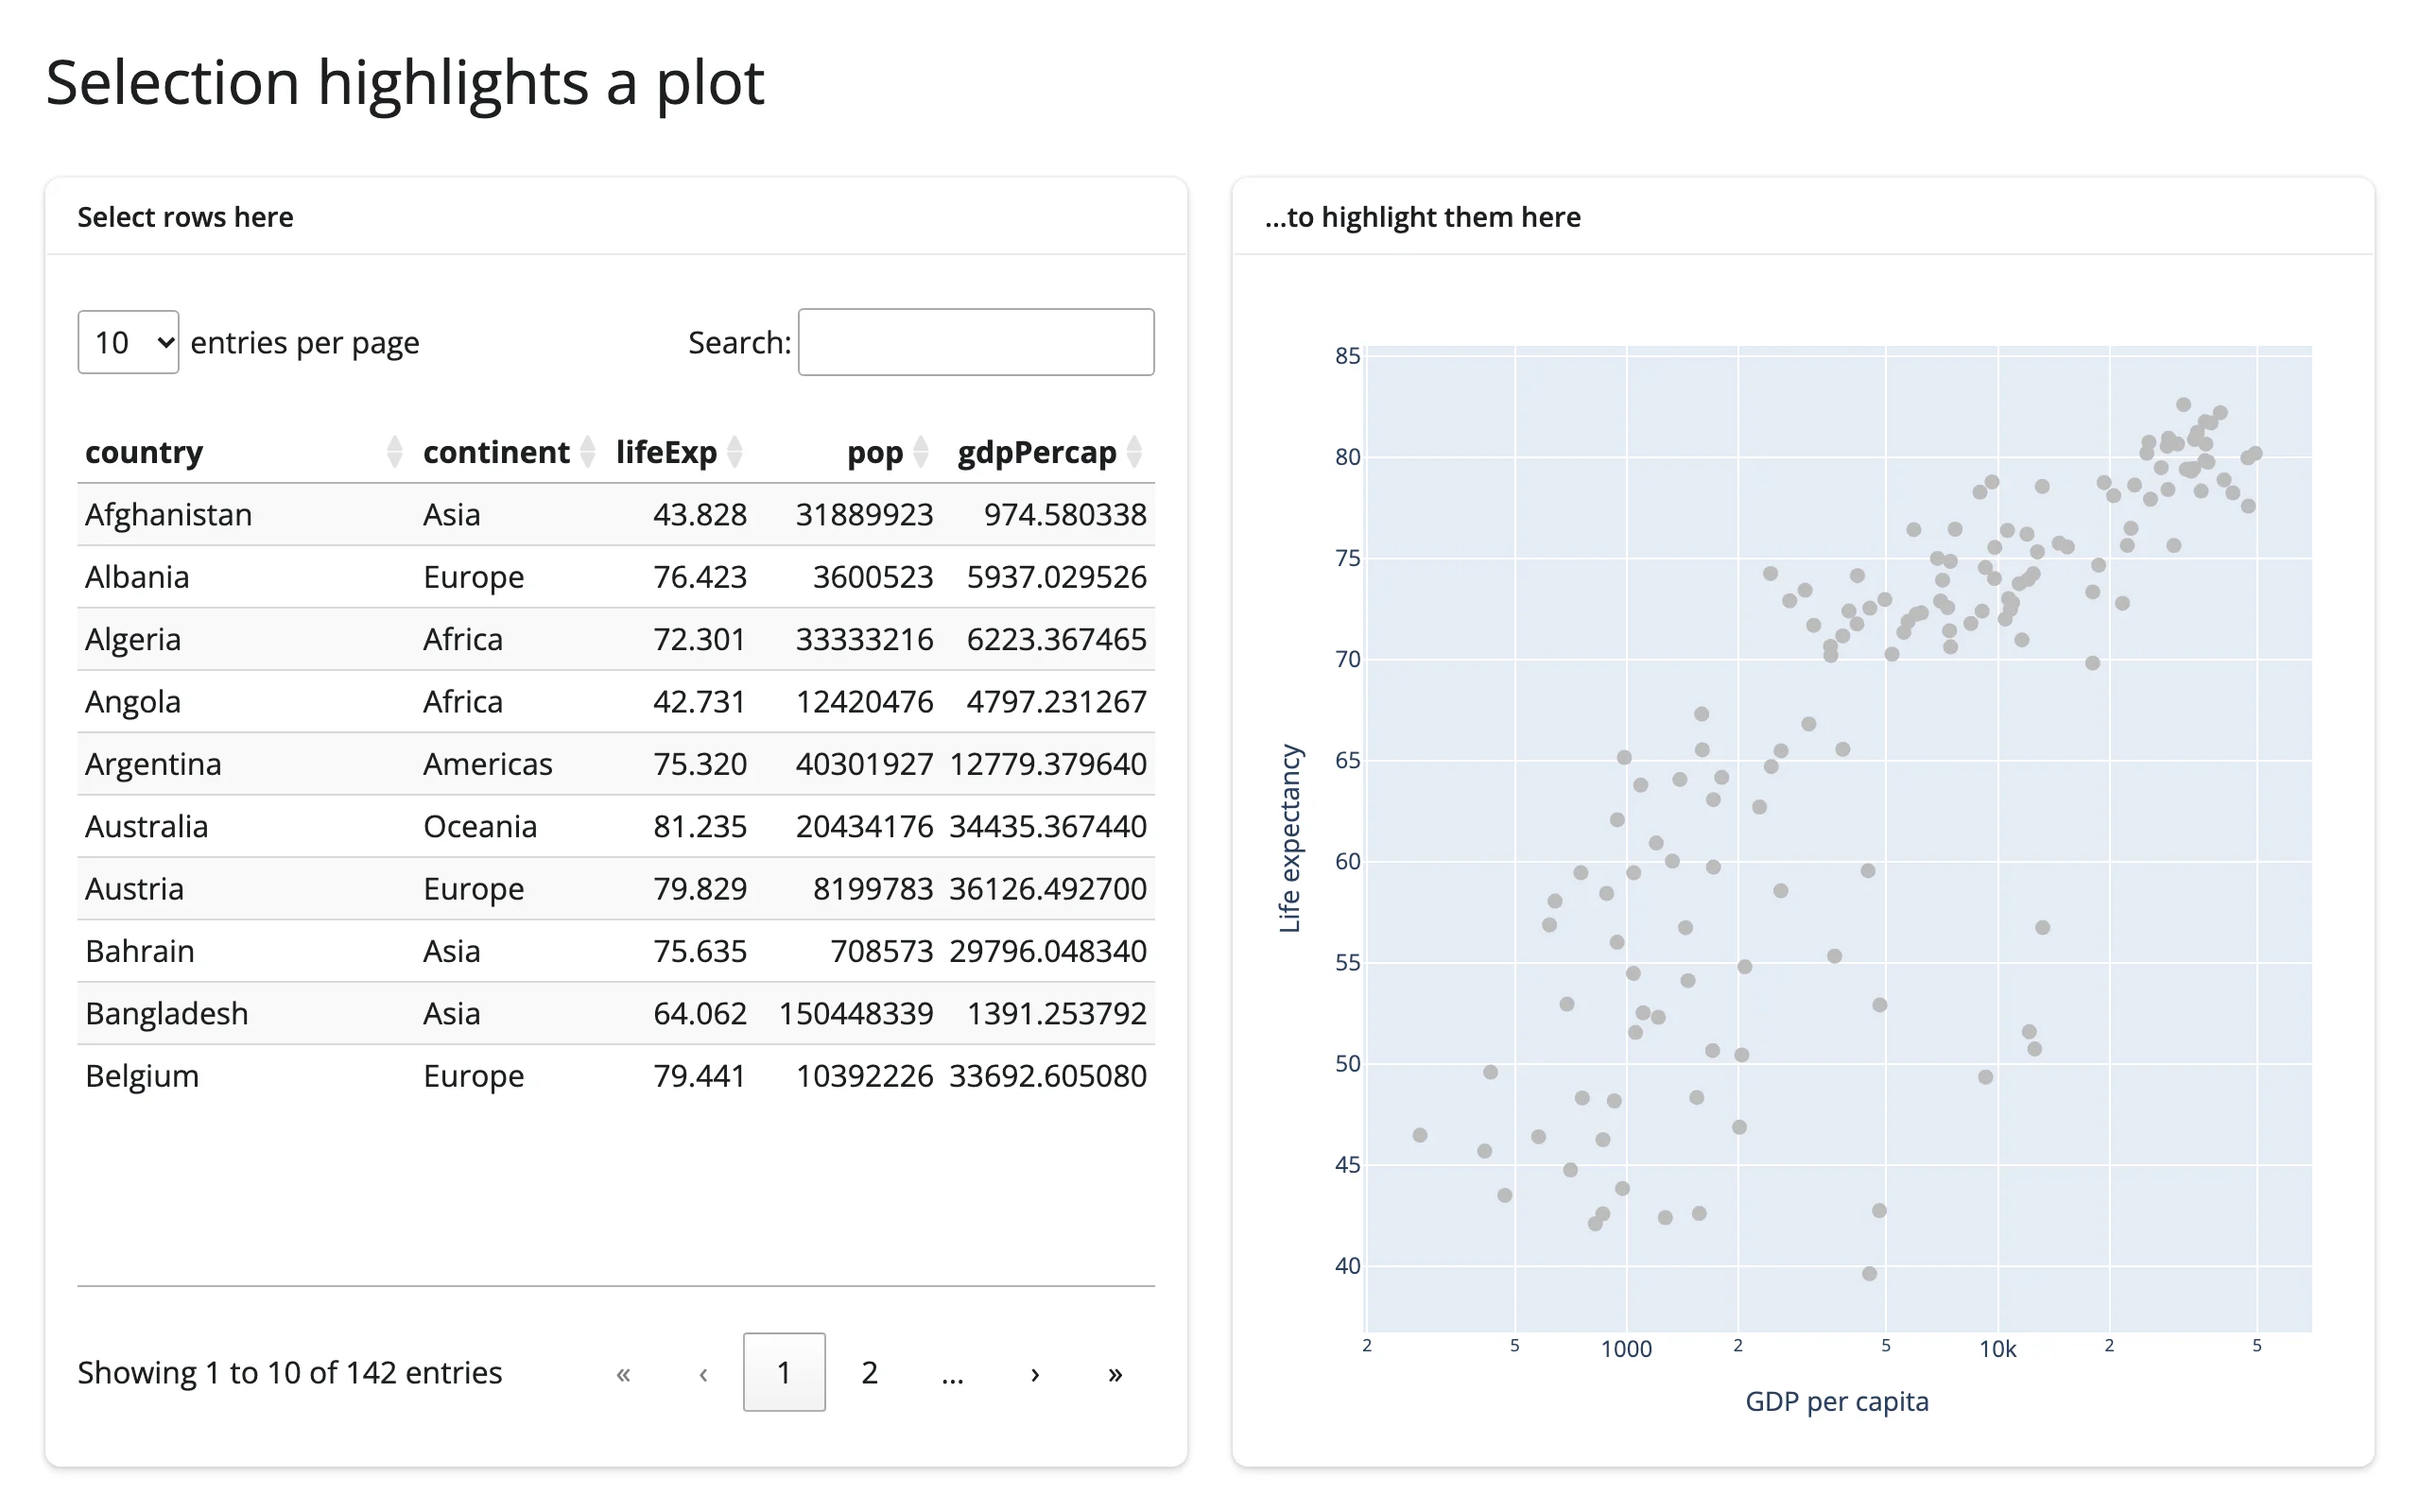
Selection highlights a plot
Read table.selected_rows() in an effect and write the result into another widget’s trait in place (inside reactive.isolate(), so the write doesn’t re-trigger the effect). The plot keeps its zoom/pan state across every selection change, unlike re-rendering it each time.
@reactive.effect
def _highlight_selection():
    selected = set(table.selected_rows())
    with reactive.isolate():
        # In place: the scatter keeps its zoom/pan state across selections,
        # instead of rebuilding (and resending) the whole figure.
        scatter.widget.data[0].marker.color = [
            "#e41a1c" if i in selected else "#bbb" for i in range(len(countries))
        ]
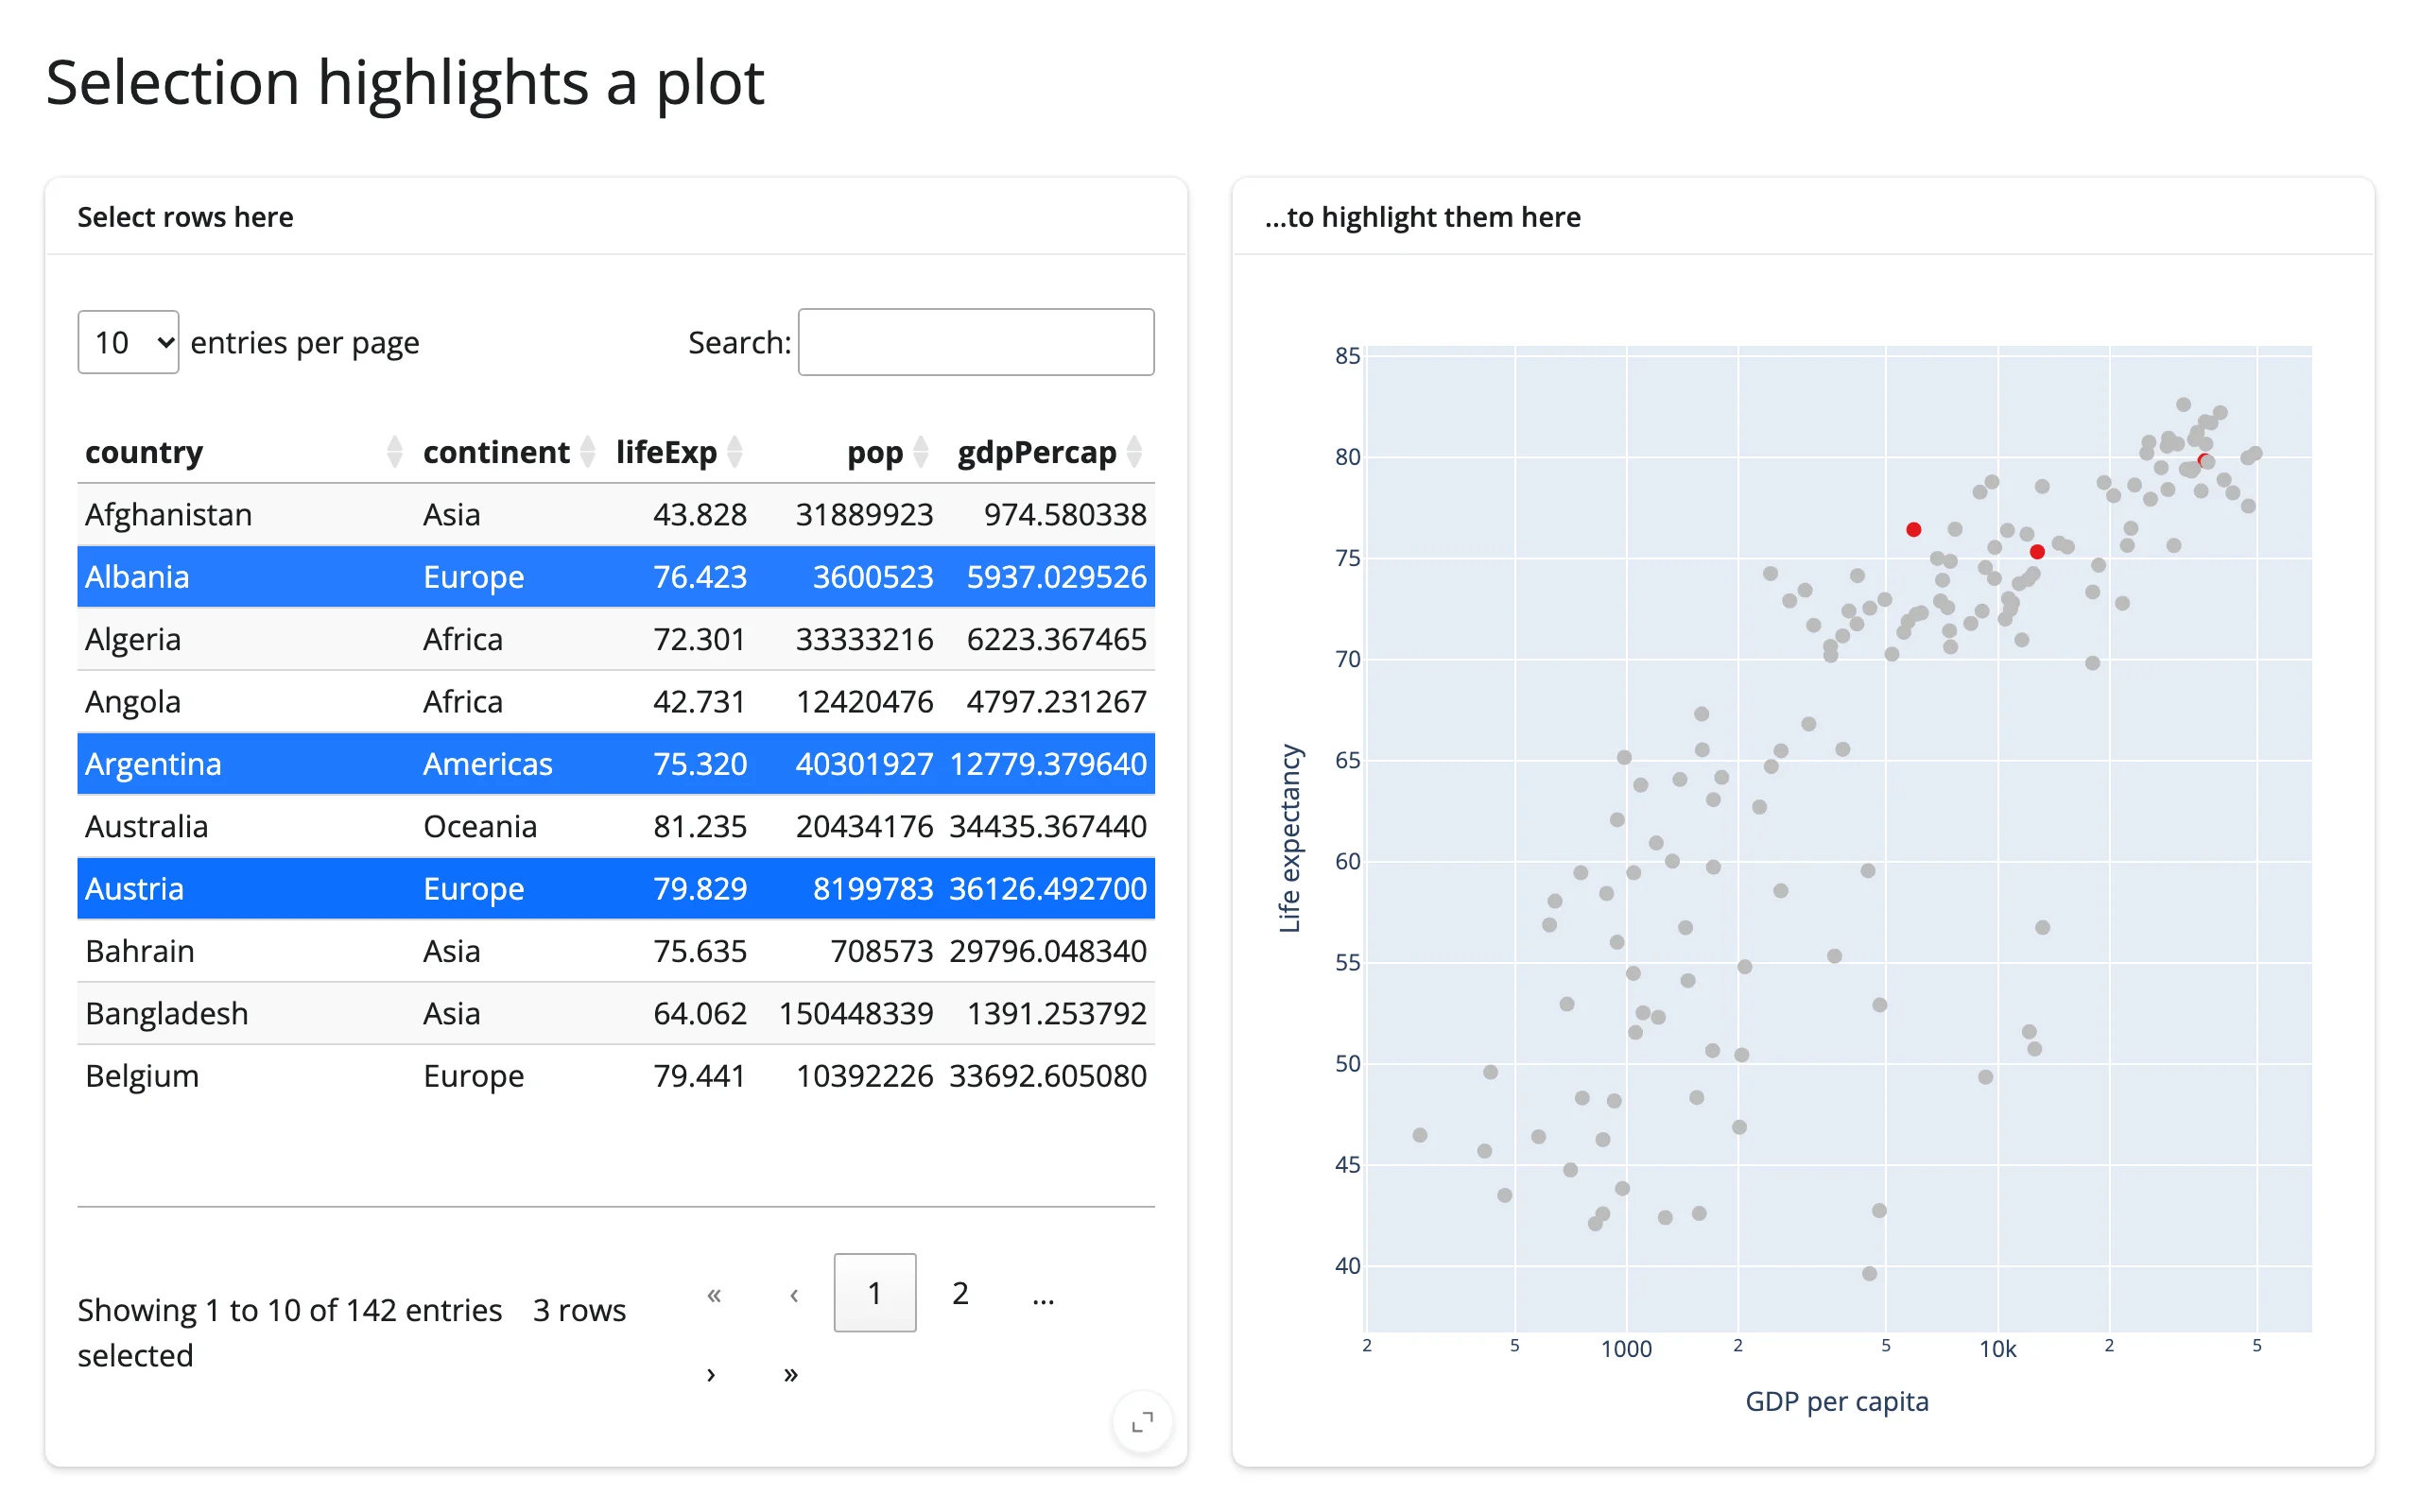
(Pairs well with plotly; the same pattern works with any renderer whose widget exposes a settable trait.)
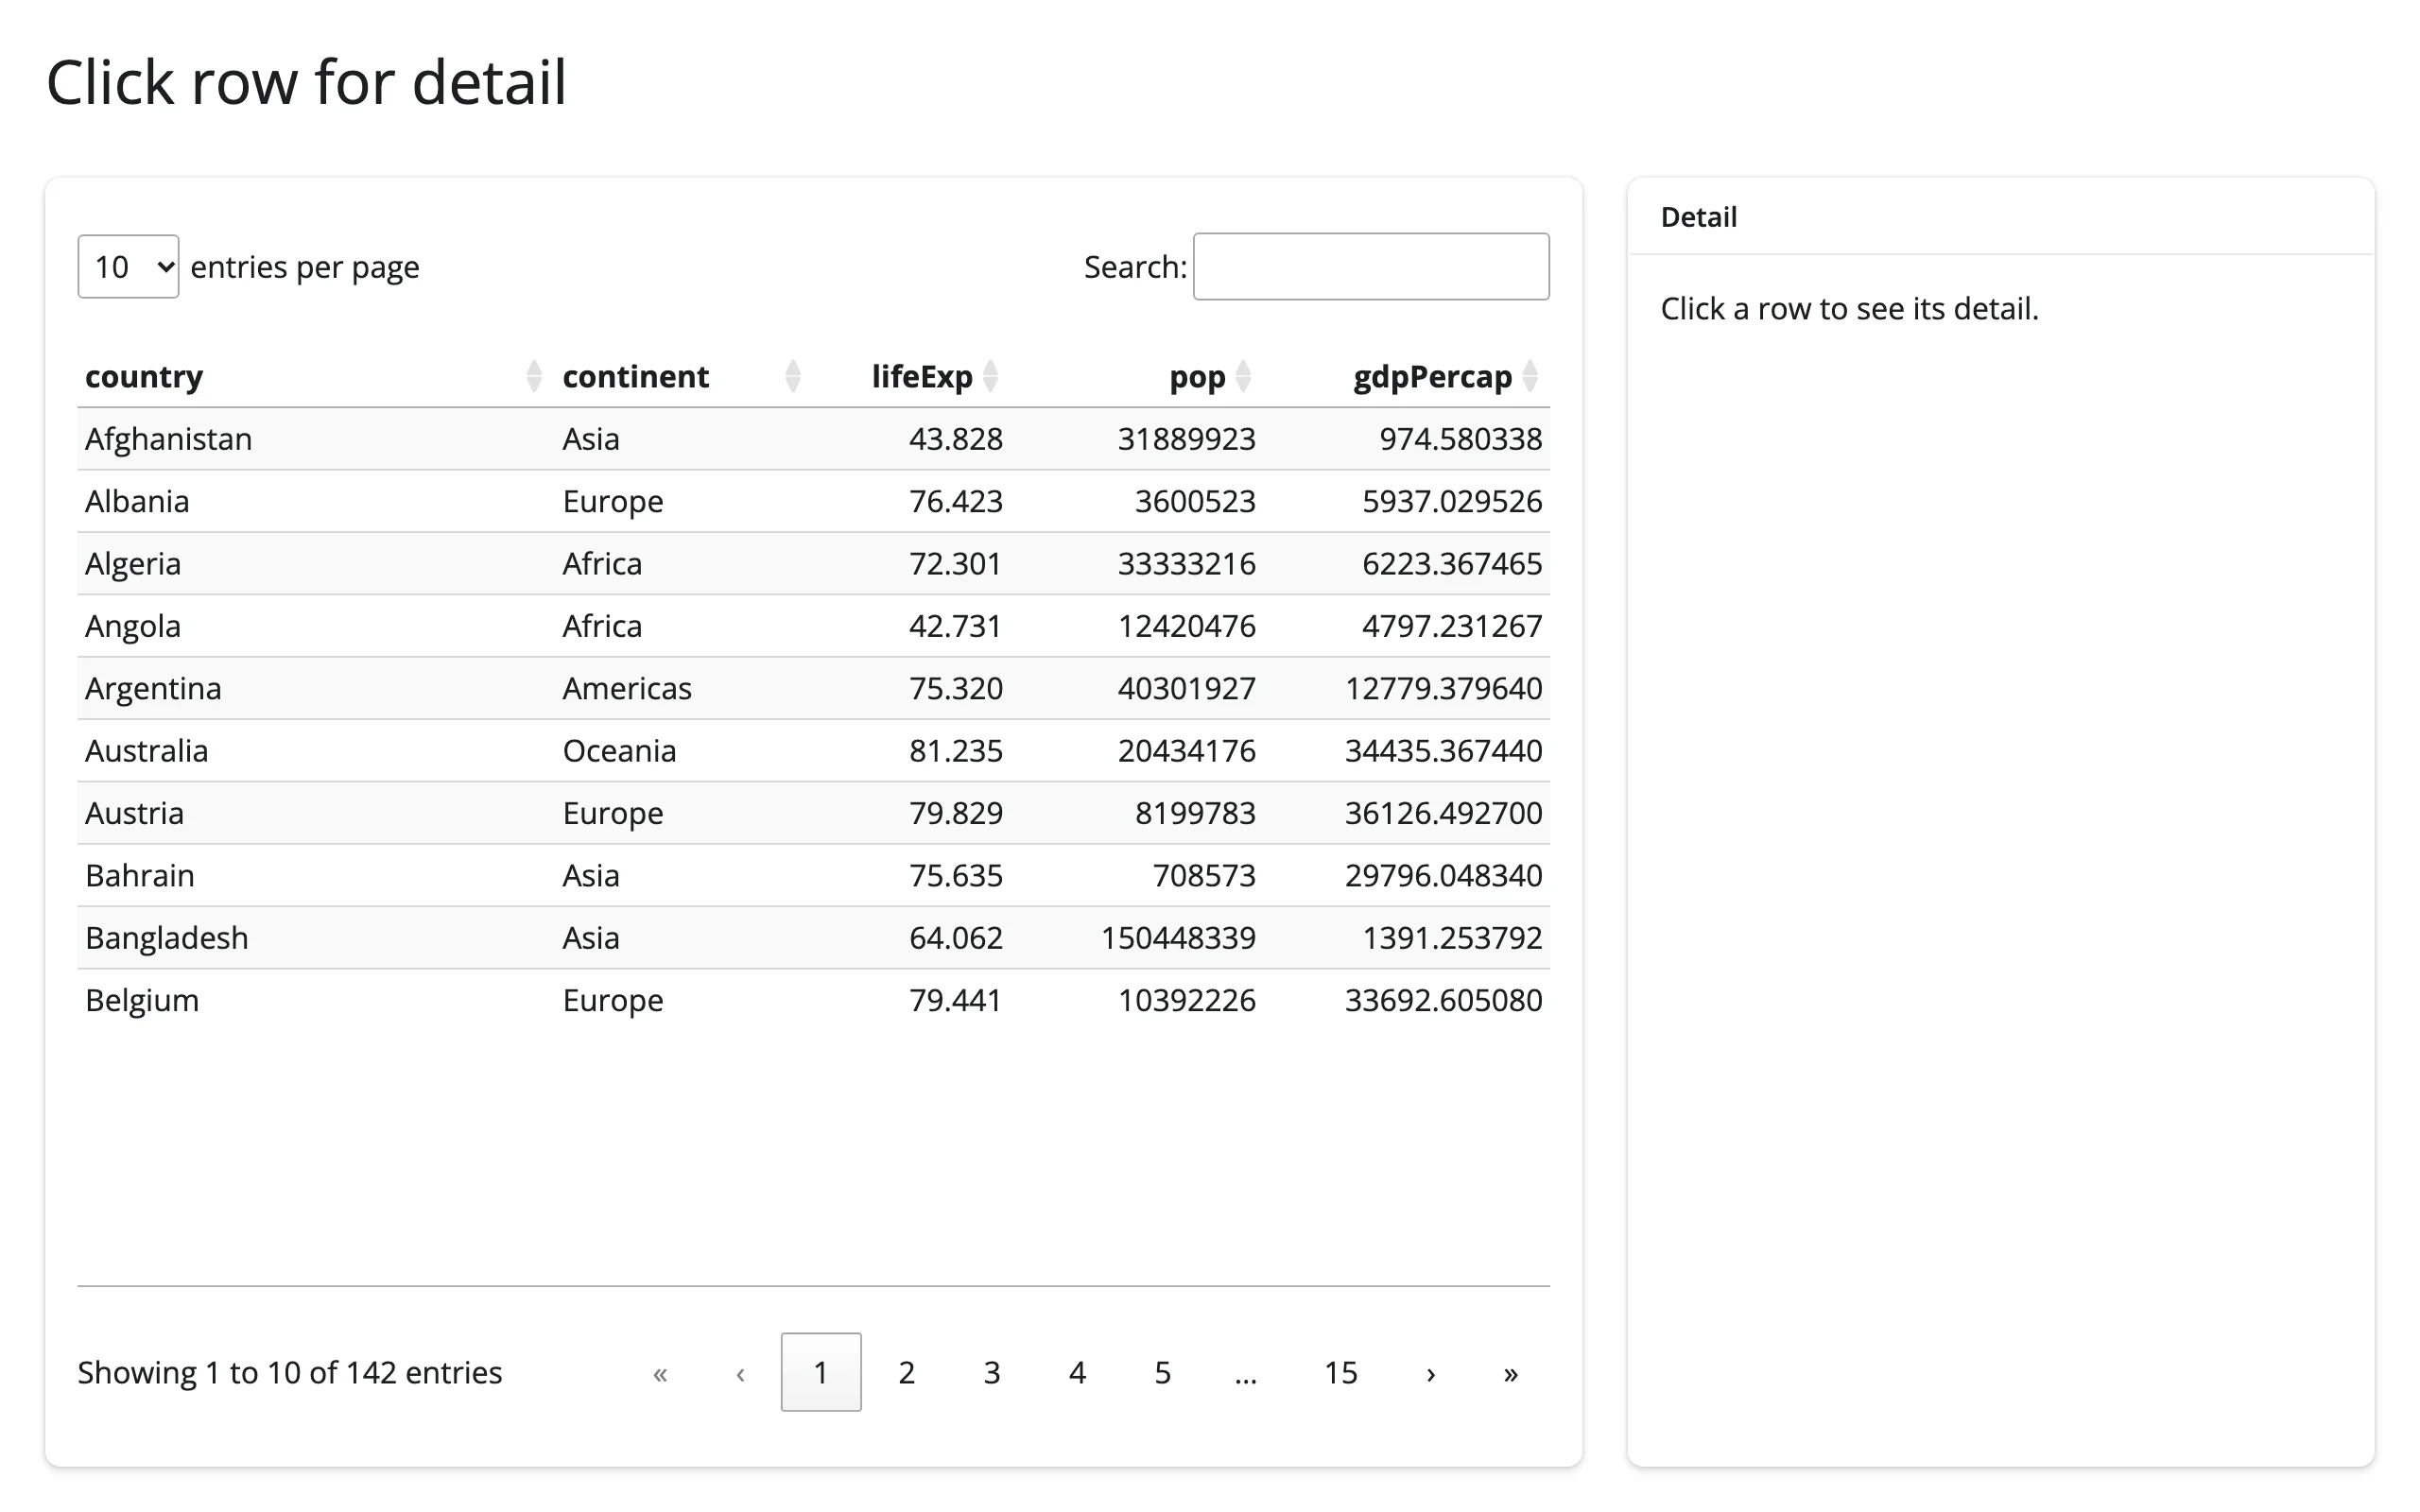
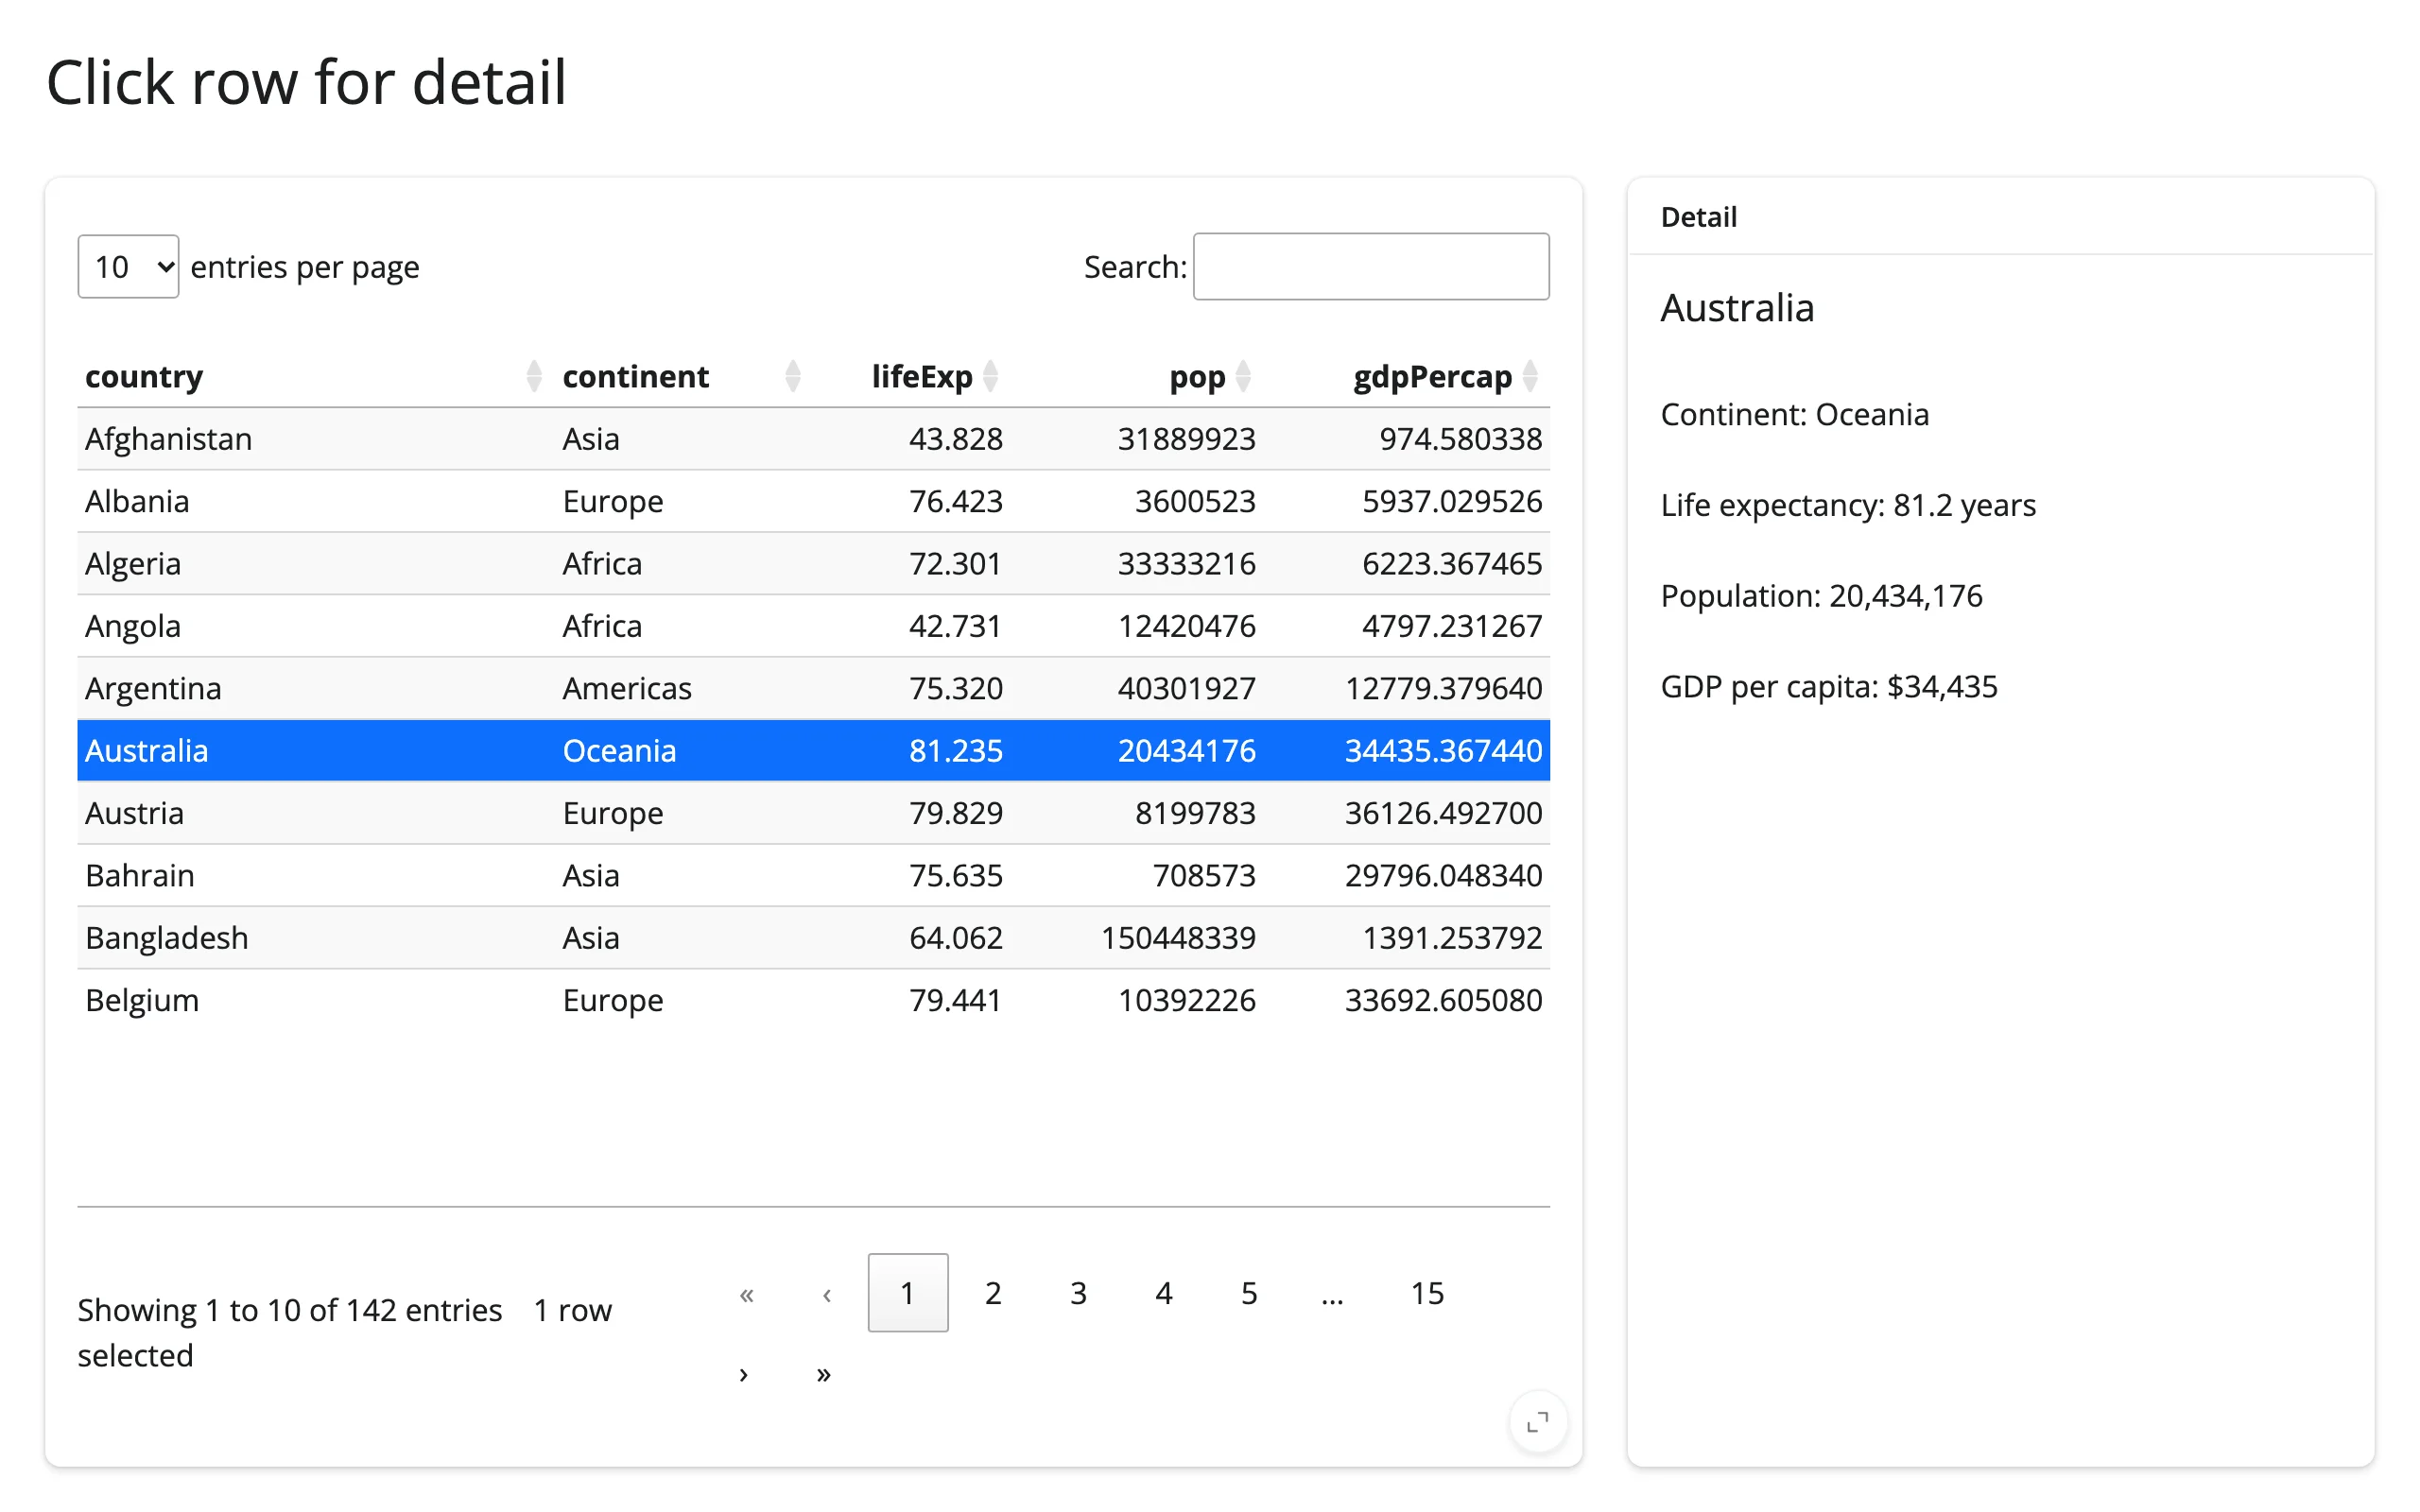
Click row for detail
A single @render.ui reading table.selected_rows() is enough for a master-detail layout – handle the “nothing selected yet” case explicitly, since that’s the state on first load.
        @render.ui
        def detail():
            rows = table.selected_rows()
            if not rows:
                return ui.p("Click a row to see its detail.")
            row = countries.iloc[rows[-1]]
            return ui.TagList(
                ui.h5(row["country"]),
                ui.p(f"Continent: {row['continent']}"),
                ui.p(f"Life expectancy: {row['lifeExp']:.1f} years"),
                ui.p(f"Population: {row['pop']:,}"),
                ui.p(f"GDP per capita: ${row['gdpPercap']:,.0f}"),
            )
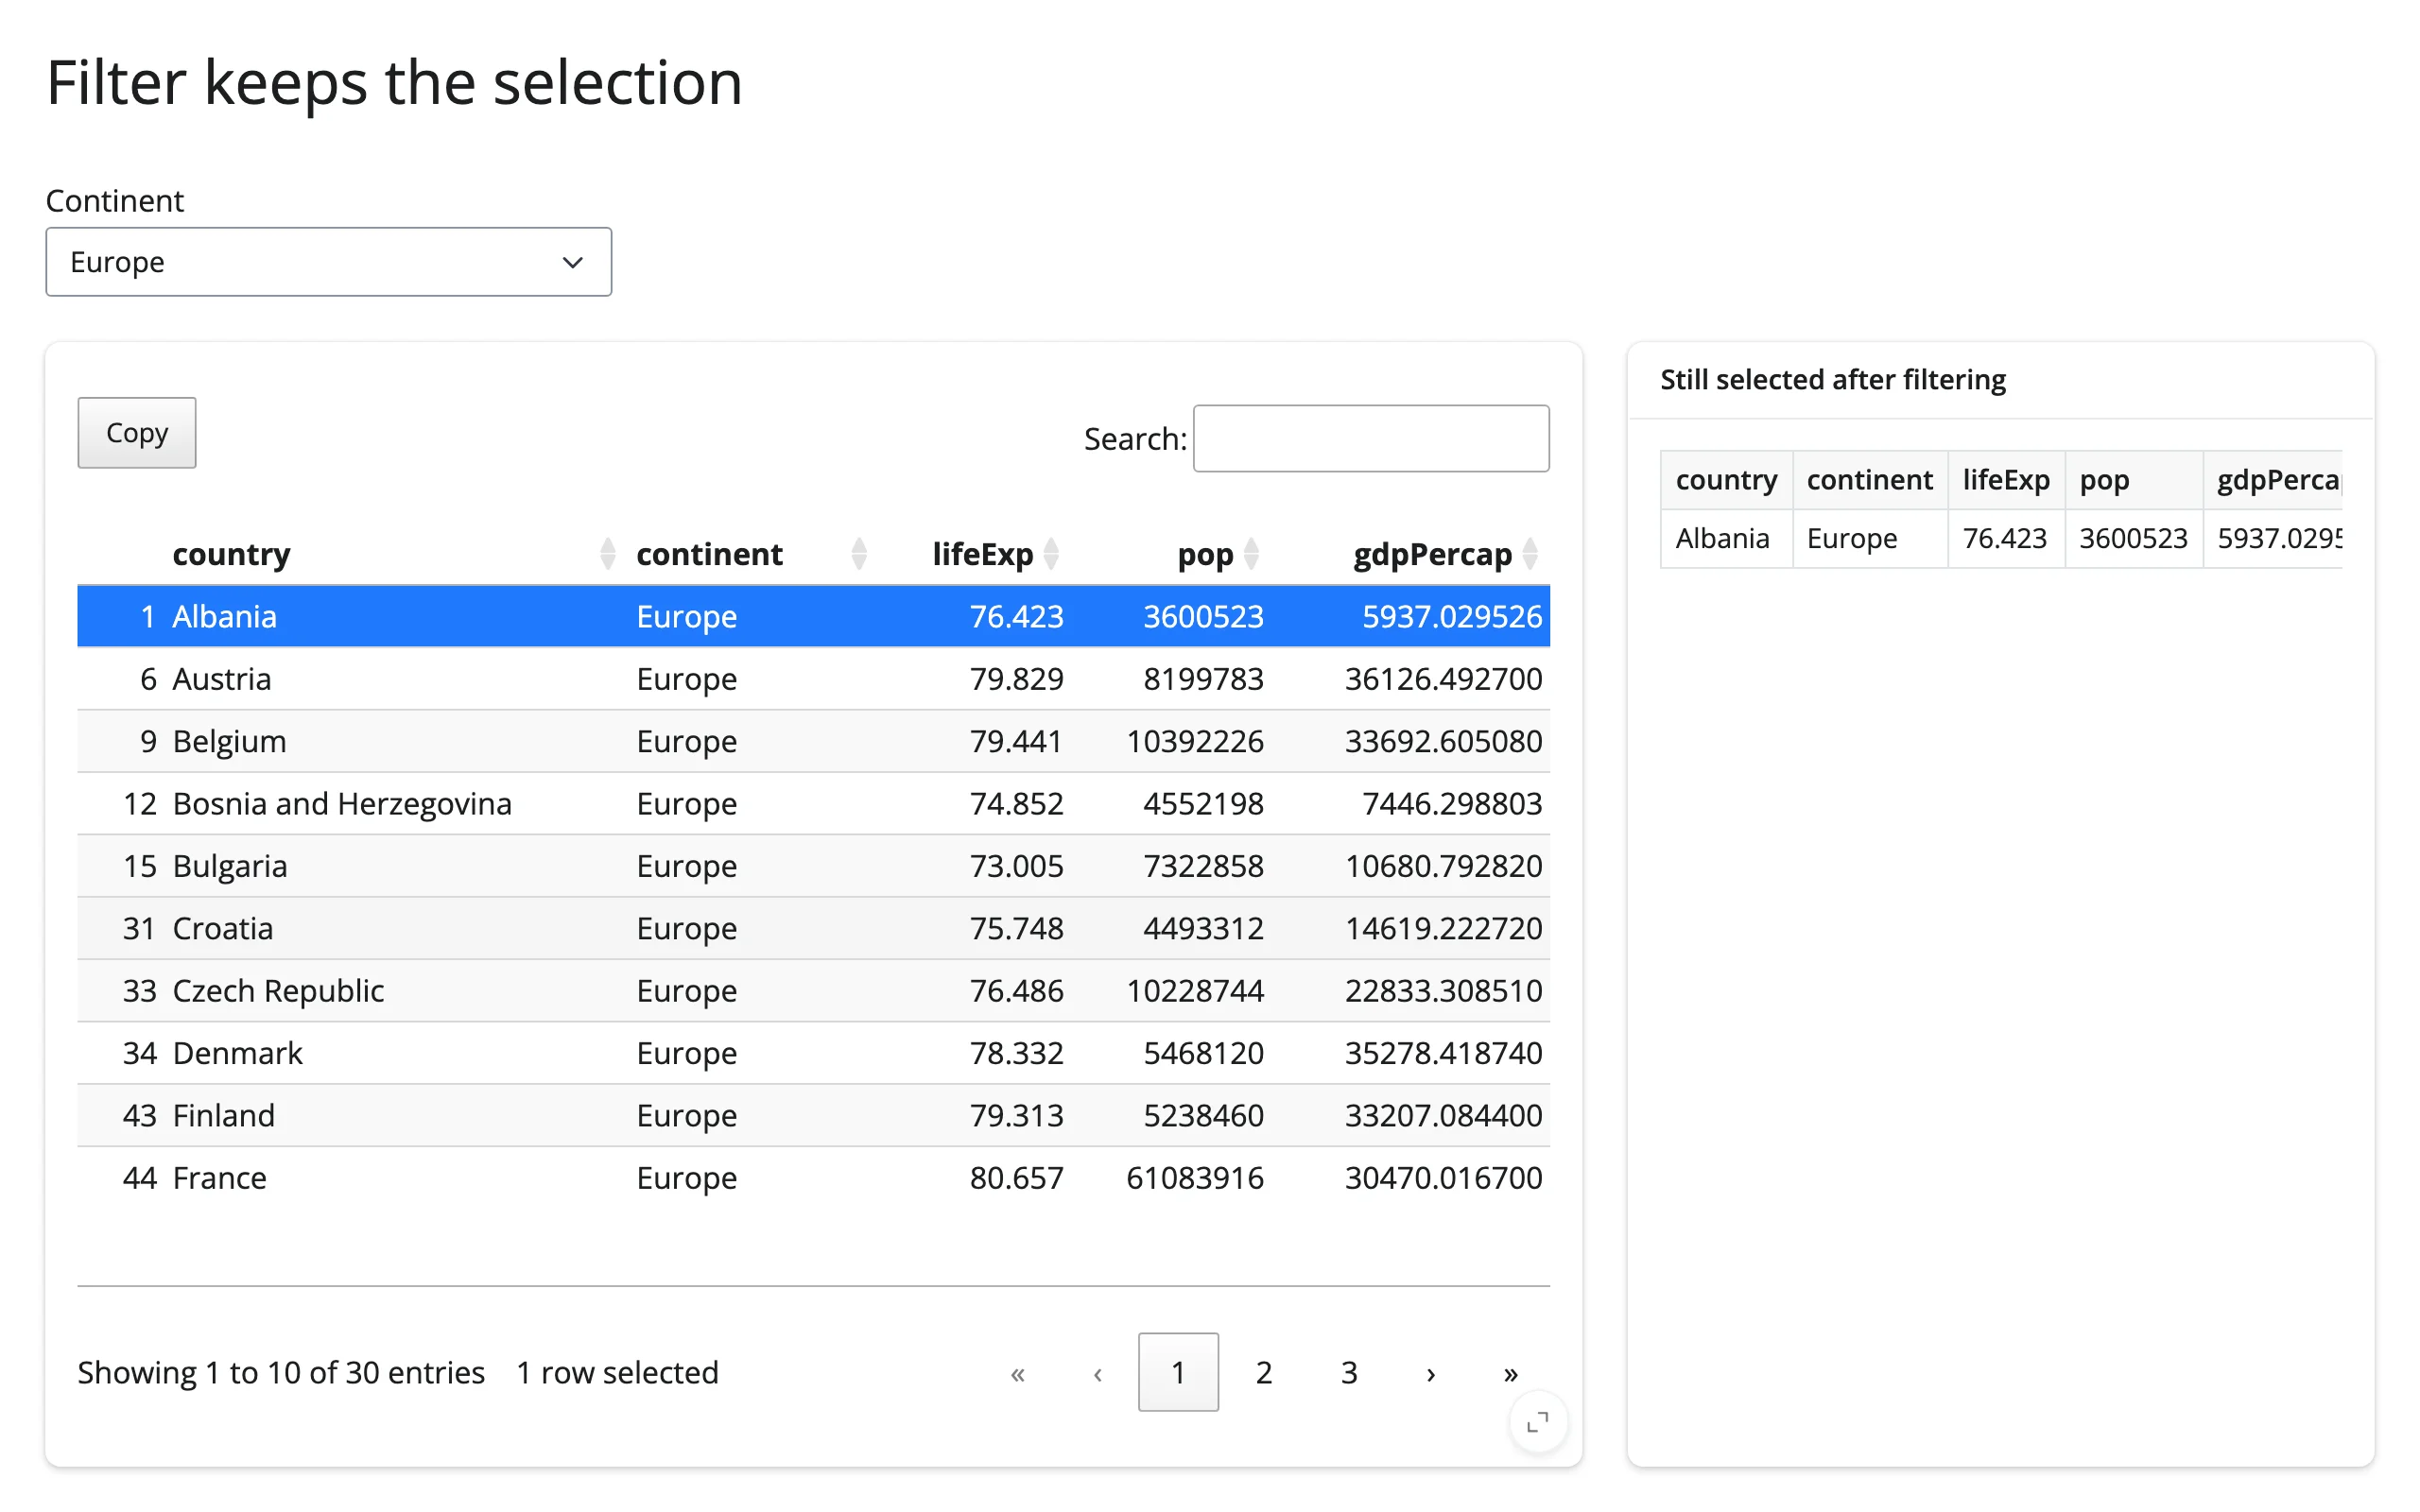
A filter control updates the table in place, keeping the selection
Filtering swaps the data with .widget.update(), but positions from before the filter point at different rows in the new (smaller) frame. Re-map the kept selection by a stable key (here, country name) before passing it back:
# The current (possibly continent-filtered) rows. Positions from
# table.selected_rows() are only meaningful against whatever data frame is
# currently shown, so track it here (ITable.update(df) doesn't expose its
# current data frame for reading it back).
current_rows = reactive.value(countries)


@reactive.effect
def _filter():
    continent = input.continent()
    req(table.widget)
    with reactive.isolate():
        shown = (
            countries
            if continent == "All"
            else countries[countries["continent"] == continent]
        )
        # Positions are into `shown`, so re-map the current selection by a
        # stable key (country name) instead of keeping the old positions,
        # which would now point at different rows (or be out of range).
        kept = set(current_rows().iloc[table.selected_rows()]["country"])
        remapped = [i for i, c in enumerate(shown["country"]) if c in kept]
        table.widget.update(shown, selected_rows=remapped, **TABLE_OPTS)
        current_rows.set(shown)
Albania and Australia selected, before filtering to Europe:
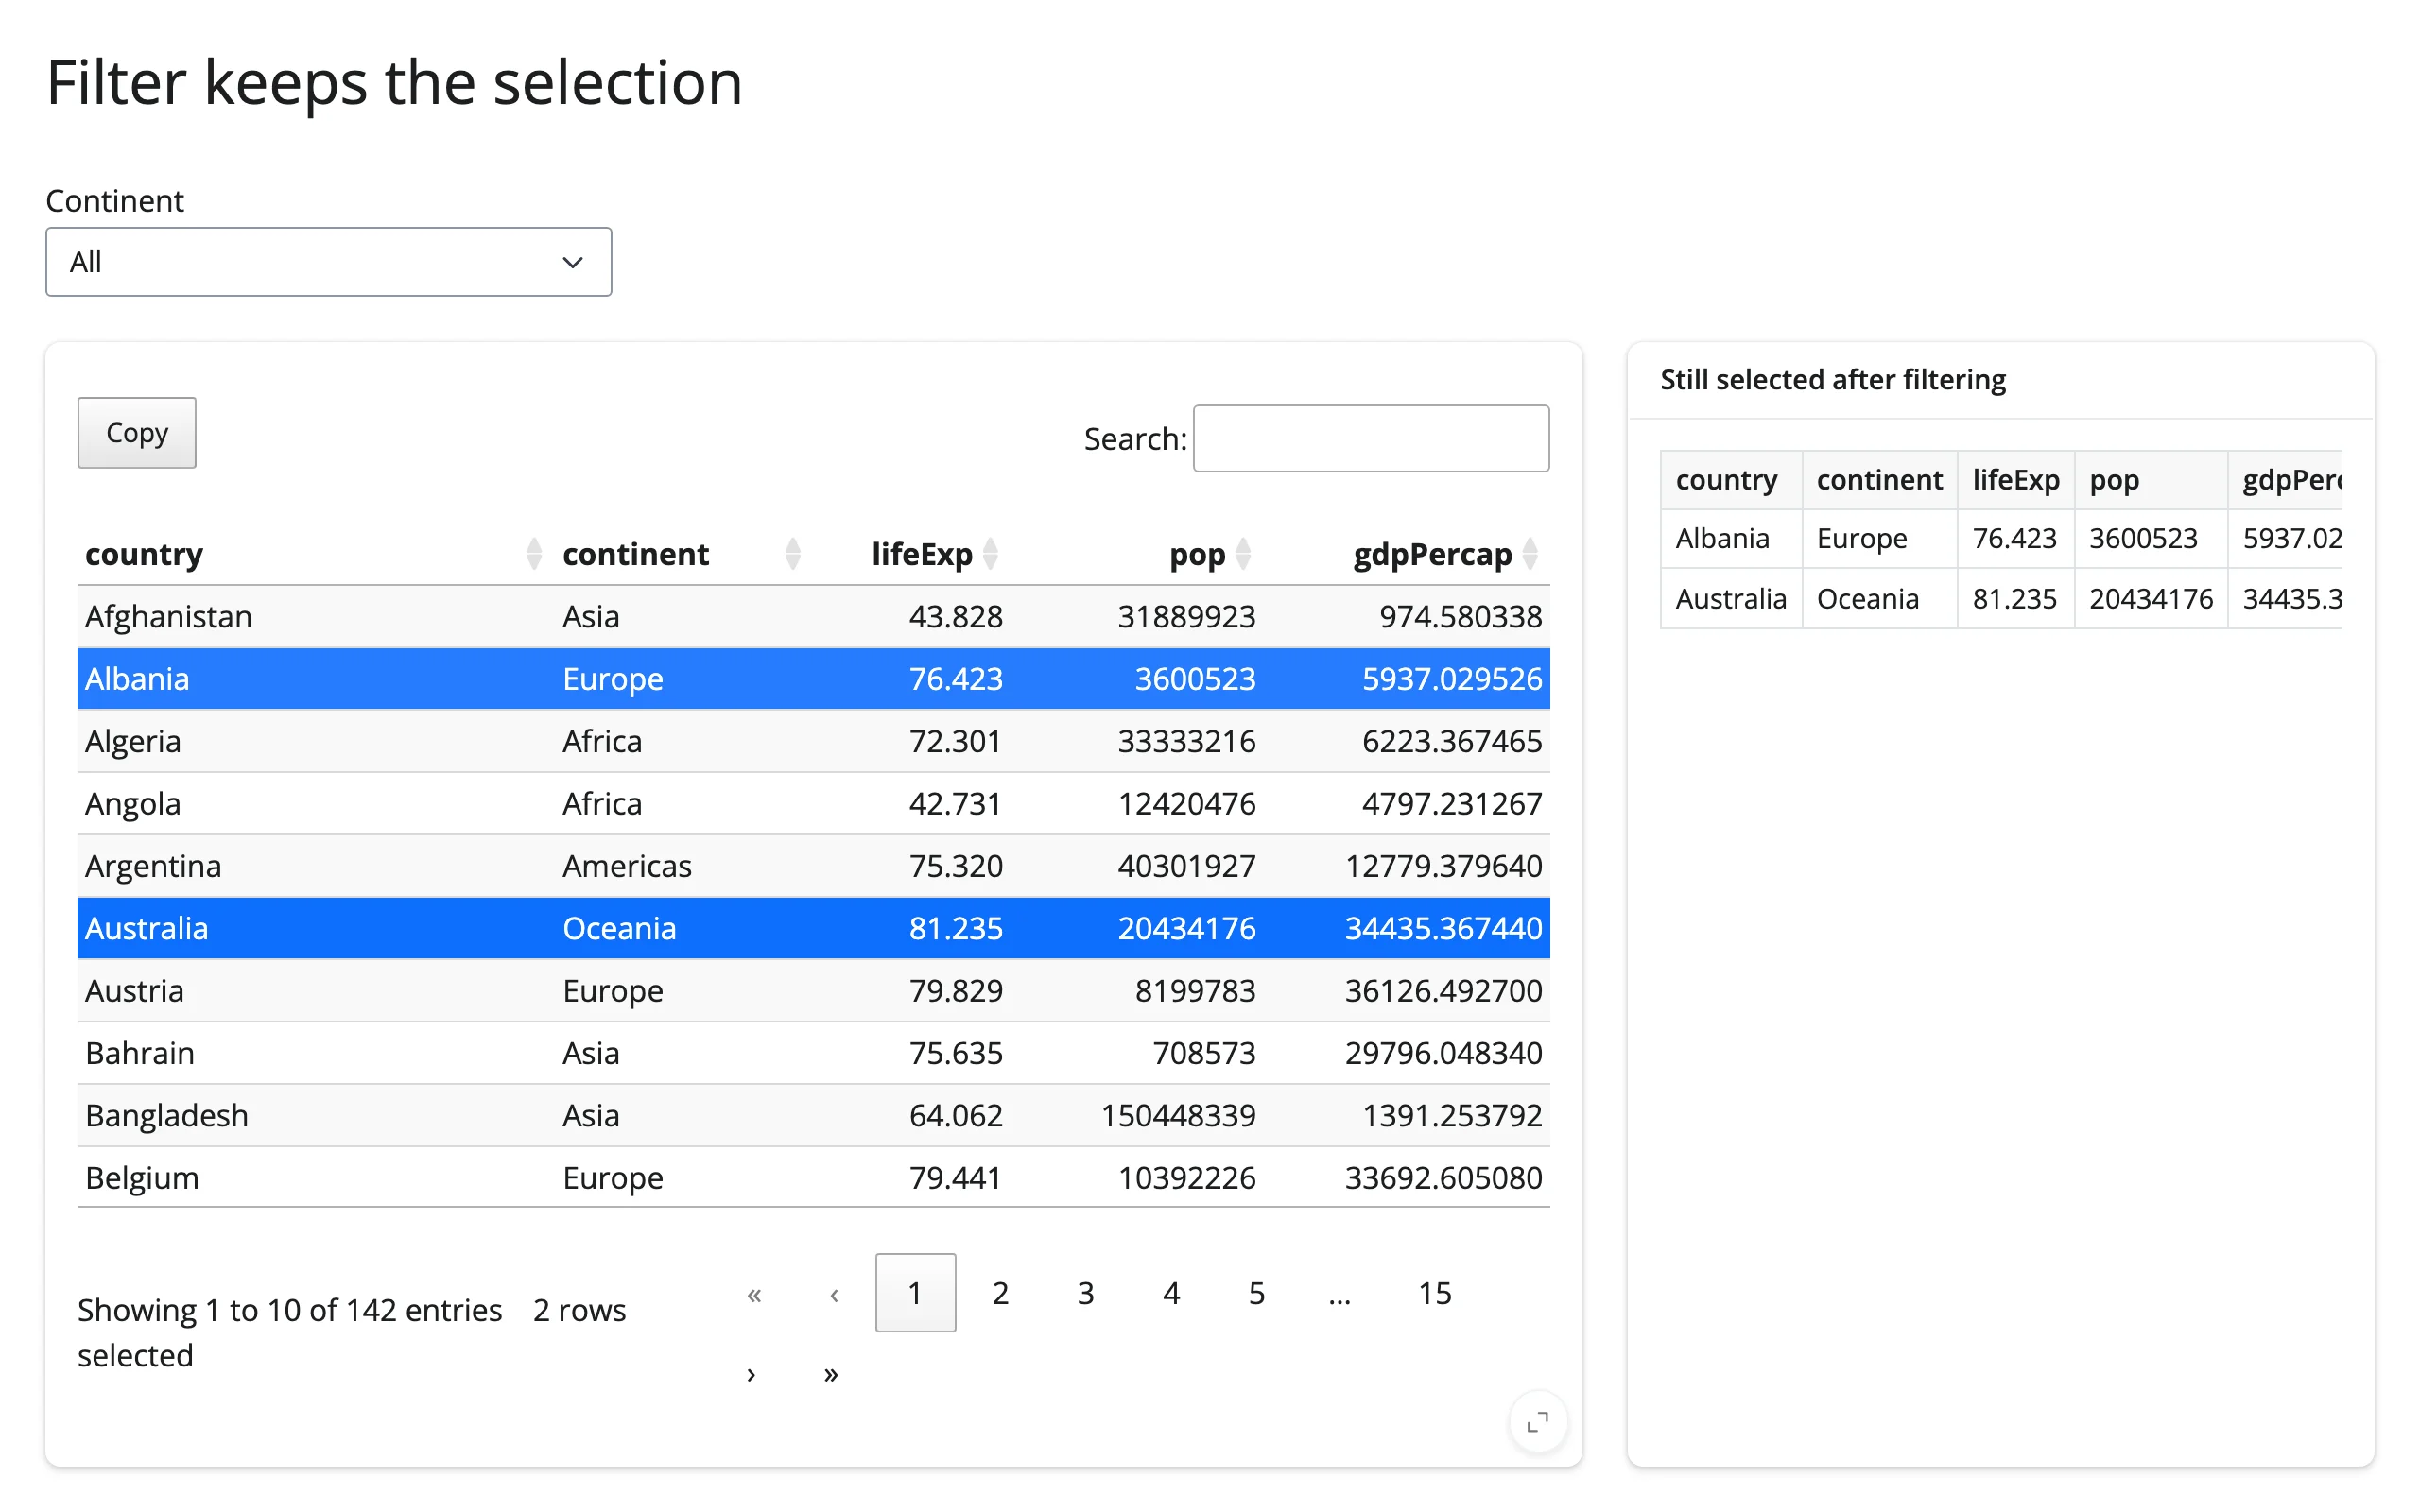
After: 30 Europe-only rows, Albania (the only one still in Europe) still selected:
Large data
itables is client-side: the whole frame is serialized to the browser up front. maxBytes (64 KB by default, measured after JSON-encoding) downsamples anything larger and shows a note in the info line; pass maxBytes=0 to send everything, but expect tens of thousands of rows to take seconds to first paint – see Gotchas and limitations and the ITables vs. render.DataGrid comparison table below. This is the “only send what’s visible” approach from Large data & performance: downsampling keeps the initial payload bounded, but it isn’t a virtualized grid – for real scale, prefer render.DataGrid/DataTable (virtualized, 100k+ rows smoothly) or ipydatagrid’s StreamingDataGrid.
Layout and sizing
In a filling layout (the default), the table fills its container: a flex layout keeps the search box, column filters, and footer fixed while the row area scrolls. This needs DataTables’ own scrolling body, so render_itables defaults scrollY="100%" unless you set scrollY yourself.
Give the output at least ~350px of height. Verified on main: at 200px, the search box and footer alone eat most of the budget and the scrolling row area shrinks to a sliver (one row, mostly clipped); at 350px there’s room for roughly five rows before scrolling kicks in. height= on @render_itables (or output_widget(..., height=...)) opts out of filling and uses that height as a fixed size with its own internal scroll, the same as other shinywidgets renderers.
full_screen=True on the containing card works as expected; the table re-measures on resize. buttons and column_filters="header" each add a row of controls, which eats into the same fixed height budget – account for that if you also set a short explicit height.
Gotchas and limitations
Verified on current main (shinywidgets, itables 2.9.1):
- Client-side only. The whole data frame is serialized to the browser. itables downsamples anything over
maxBytes(64KB by default, applied after JSON-encoding) and shows a note in the info line (“downsampled from N rows…”); nothing is logged on the Python side. PassmaxBytes=0to send everything, but expect tens of thousands of rows to take seconds to first paint – for real scale, seerender.DataGridbelow. columnDefstargeting a numeric column without its ownrendersees itables’ internal[display, raw]pair increatedCell, not a plain number. Indexdata[1]for the raw value (see “What you can build” above for a worked example). Not shinywidgets-specific; this is how itables’ own number formatting is implemented.ITable.update(df)drops options you don’t re-pass.columnDefs,buttons, and similar are not preserved across.update()unless included in that call too. Keep them in one dict and reuse it (see “Updating the widget from Python”).- The initial
captiondoesn’t render.ITable(df, caption="...")sets thecaptiontrait, but the table’s HTML is built before that trait change is observed, so nothing appears until a later.update(caption=...). Upstream itables behavior, not new. Put the caption in the card header instead, or set it viaupdate()immediately after first use if you need the trait path. footer=Truetogether withcolumn_filters="header"renders empty data cells (verified: all<td>s blank, with the column names duplicated into the footer instead). Avoid the combination; usefooter=Truewithcolumn_filters="row"or without column filters.- Sorting is icon-only by default.
text_in_header_can_be_selected=True(itables’ default) makes header text selectable, so clicking it doesn’t sort – only the small arrow does. Passtext_in_header_can_be_selected=Falseto make the whole header clickable. - A plain
@render_widgetworks too.@render_widgetreturning anITablegets the same fill defaults and the jQuery fix as@render_itables; use@render_itablesfor the typed.selected_rows()accessor and the narrowerImportErrormessage.
Fixed since the earlier PR-era evaluation (docs/widget-reports/itables/), confirmed on current main: itables’ bundled jQuery no longer clobbers Shiny’s/bslib’s global $ (verified with bslib card resize, full-screen, ui.input_dark_mode(), and a page script using $.fn.myPlugin); $.fn.dataTable.render.number(...) and other JS option recipes that depend on DataTables’ jQuery plugin now work via a compatibility shim; and dark mode (ui.input_dark_mode()) is legible (a CSS rule maps itables’ DataTables theme variables onto Bootstrap’s).
@render_itables vs. Shiny’s render.data_frame
Both render a data frame as an interactive table; the difference is in what the table is for.
ITables (@render_itables) |
Shiny render.DataGrid / render.DataTable |
|
|---|---|---|
| Scale | Whole frame shipped to the browser; downsamples past ~64KB by default | Virtualized: renders only visible rows, handles 100k+ rows smoothly |
| Selection | Row(s), via click/Ctrl/Shift | Row, column, cell, or rectangular region |
| Editing | No | editable=True, cell-level |
| Search | Global search box + optional per-column filters/SearchPanes, built in | filters=True for per-column text filters; no global search box |
| Styling | DataTables columnDefs/CSS (JS), or a rendered pandas Styler |
Python styles= callable – no JS required |
| Export | buttons=[...] (copy, CSV, Excel, print) built in |
None built in |
| Extras | SearchPanes, RowGroup, FixedColumns, and the rest of the DataTables extension catalog | None of that catalog; zero extra JS dependency |
| Dark mode | Needs the shinywidgets CSS fix (included) | Native (it’s a Shiny/bslib component) |
Choose ITables when you want the DataTables feature set – global search, export buttons, SearchPanes, a Jupyter-familiar look – and your data comfortably fits in the browser. Choose render.DataGrid/DataTable for large data, cell editing, or finer-grained selection, with no extra dependency.
Gallery candidates
gallery/template_table_as_input.py– template. A table with search, column filters, and export buttons, whose selection drives a one-paragraph summary panel. Adapt by swapping the data frame and the summary logic.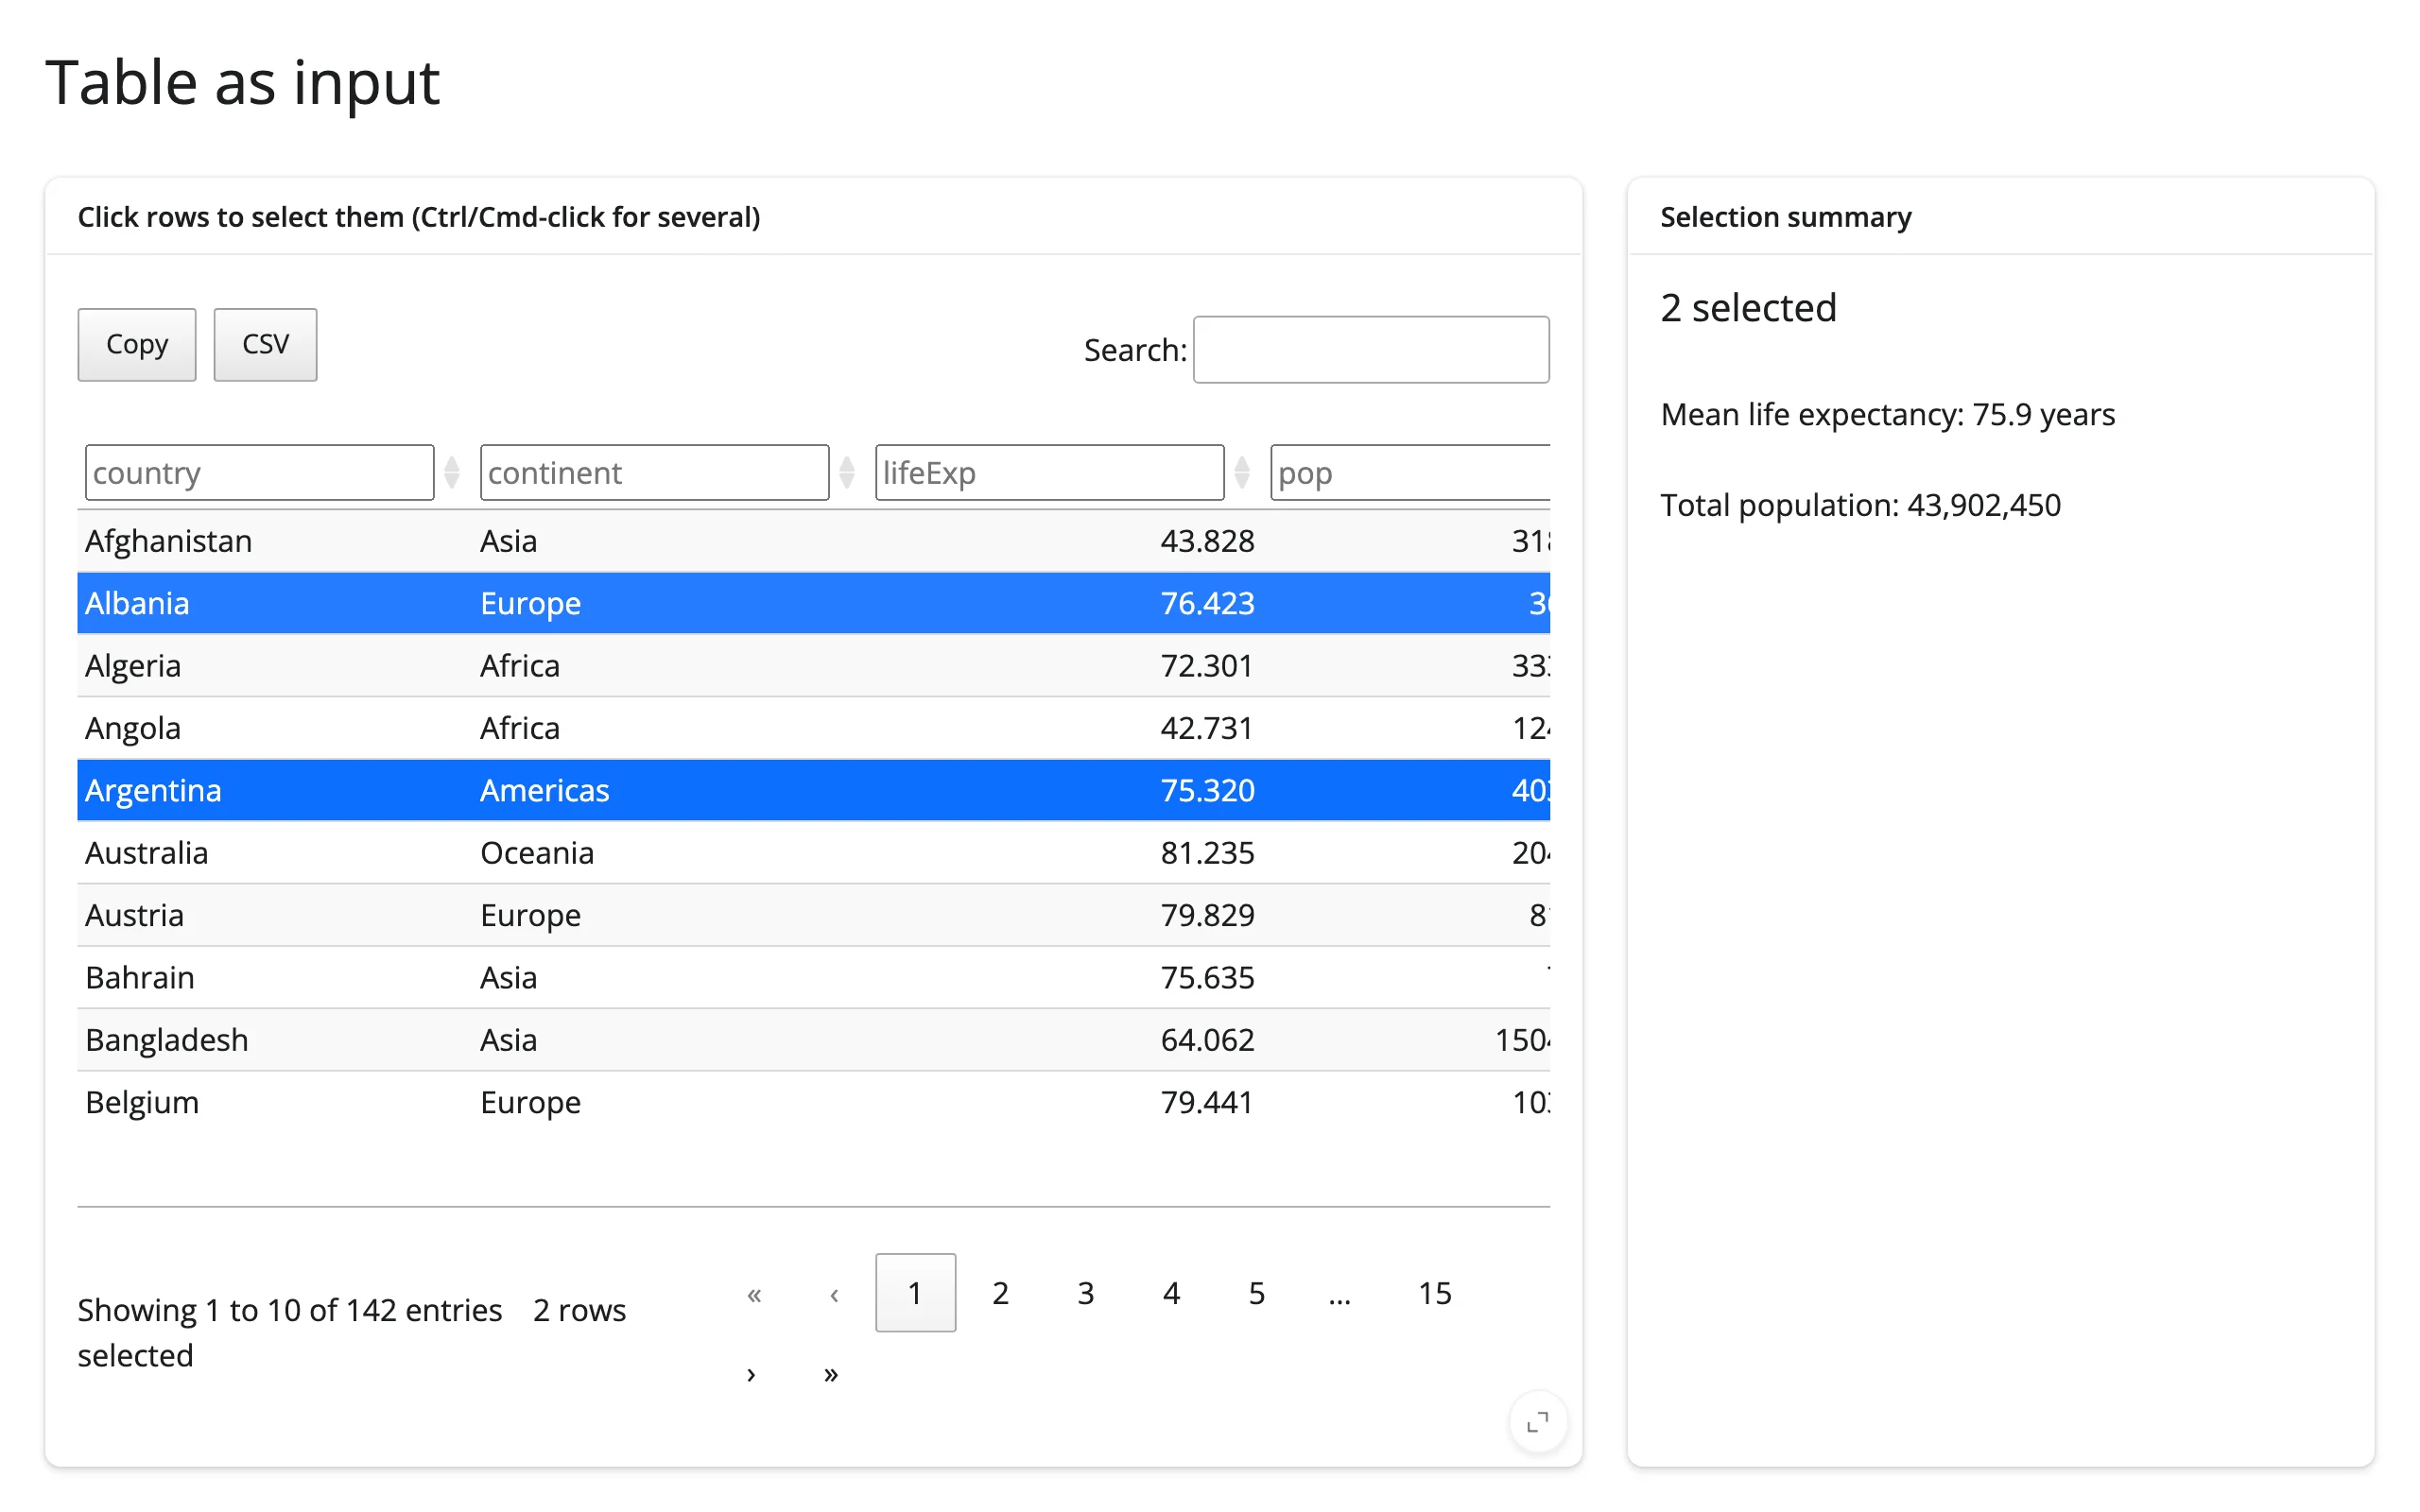
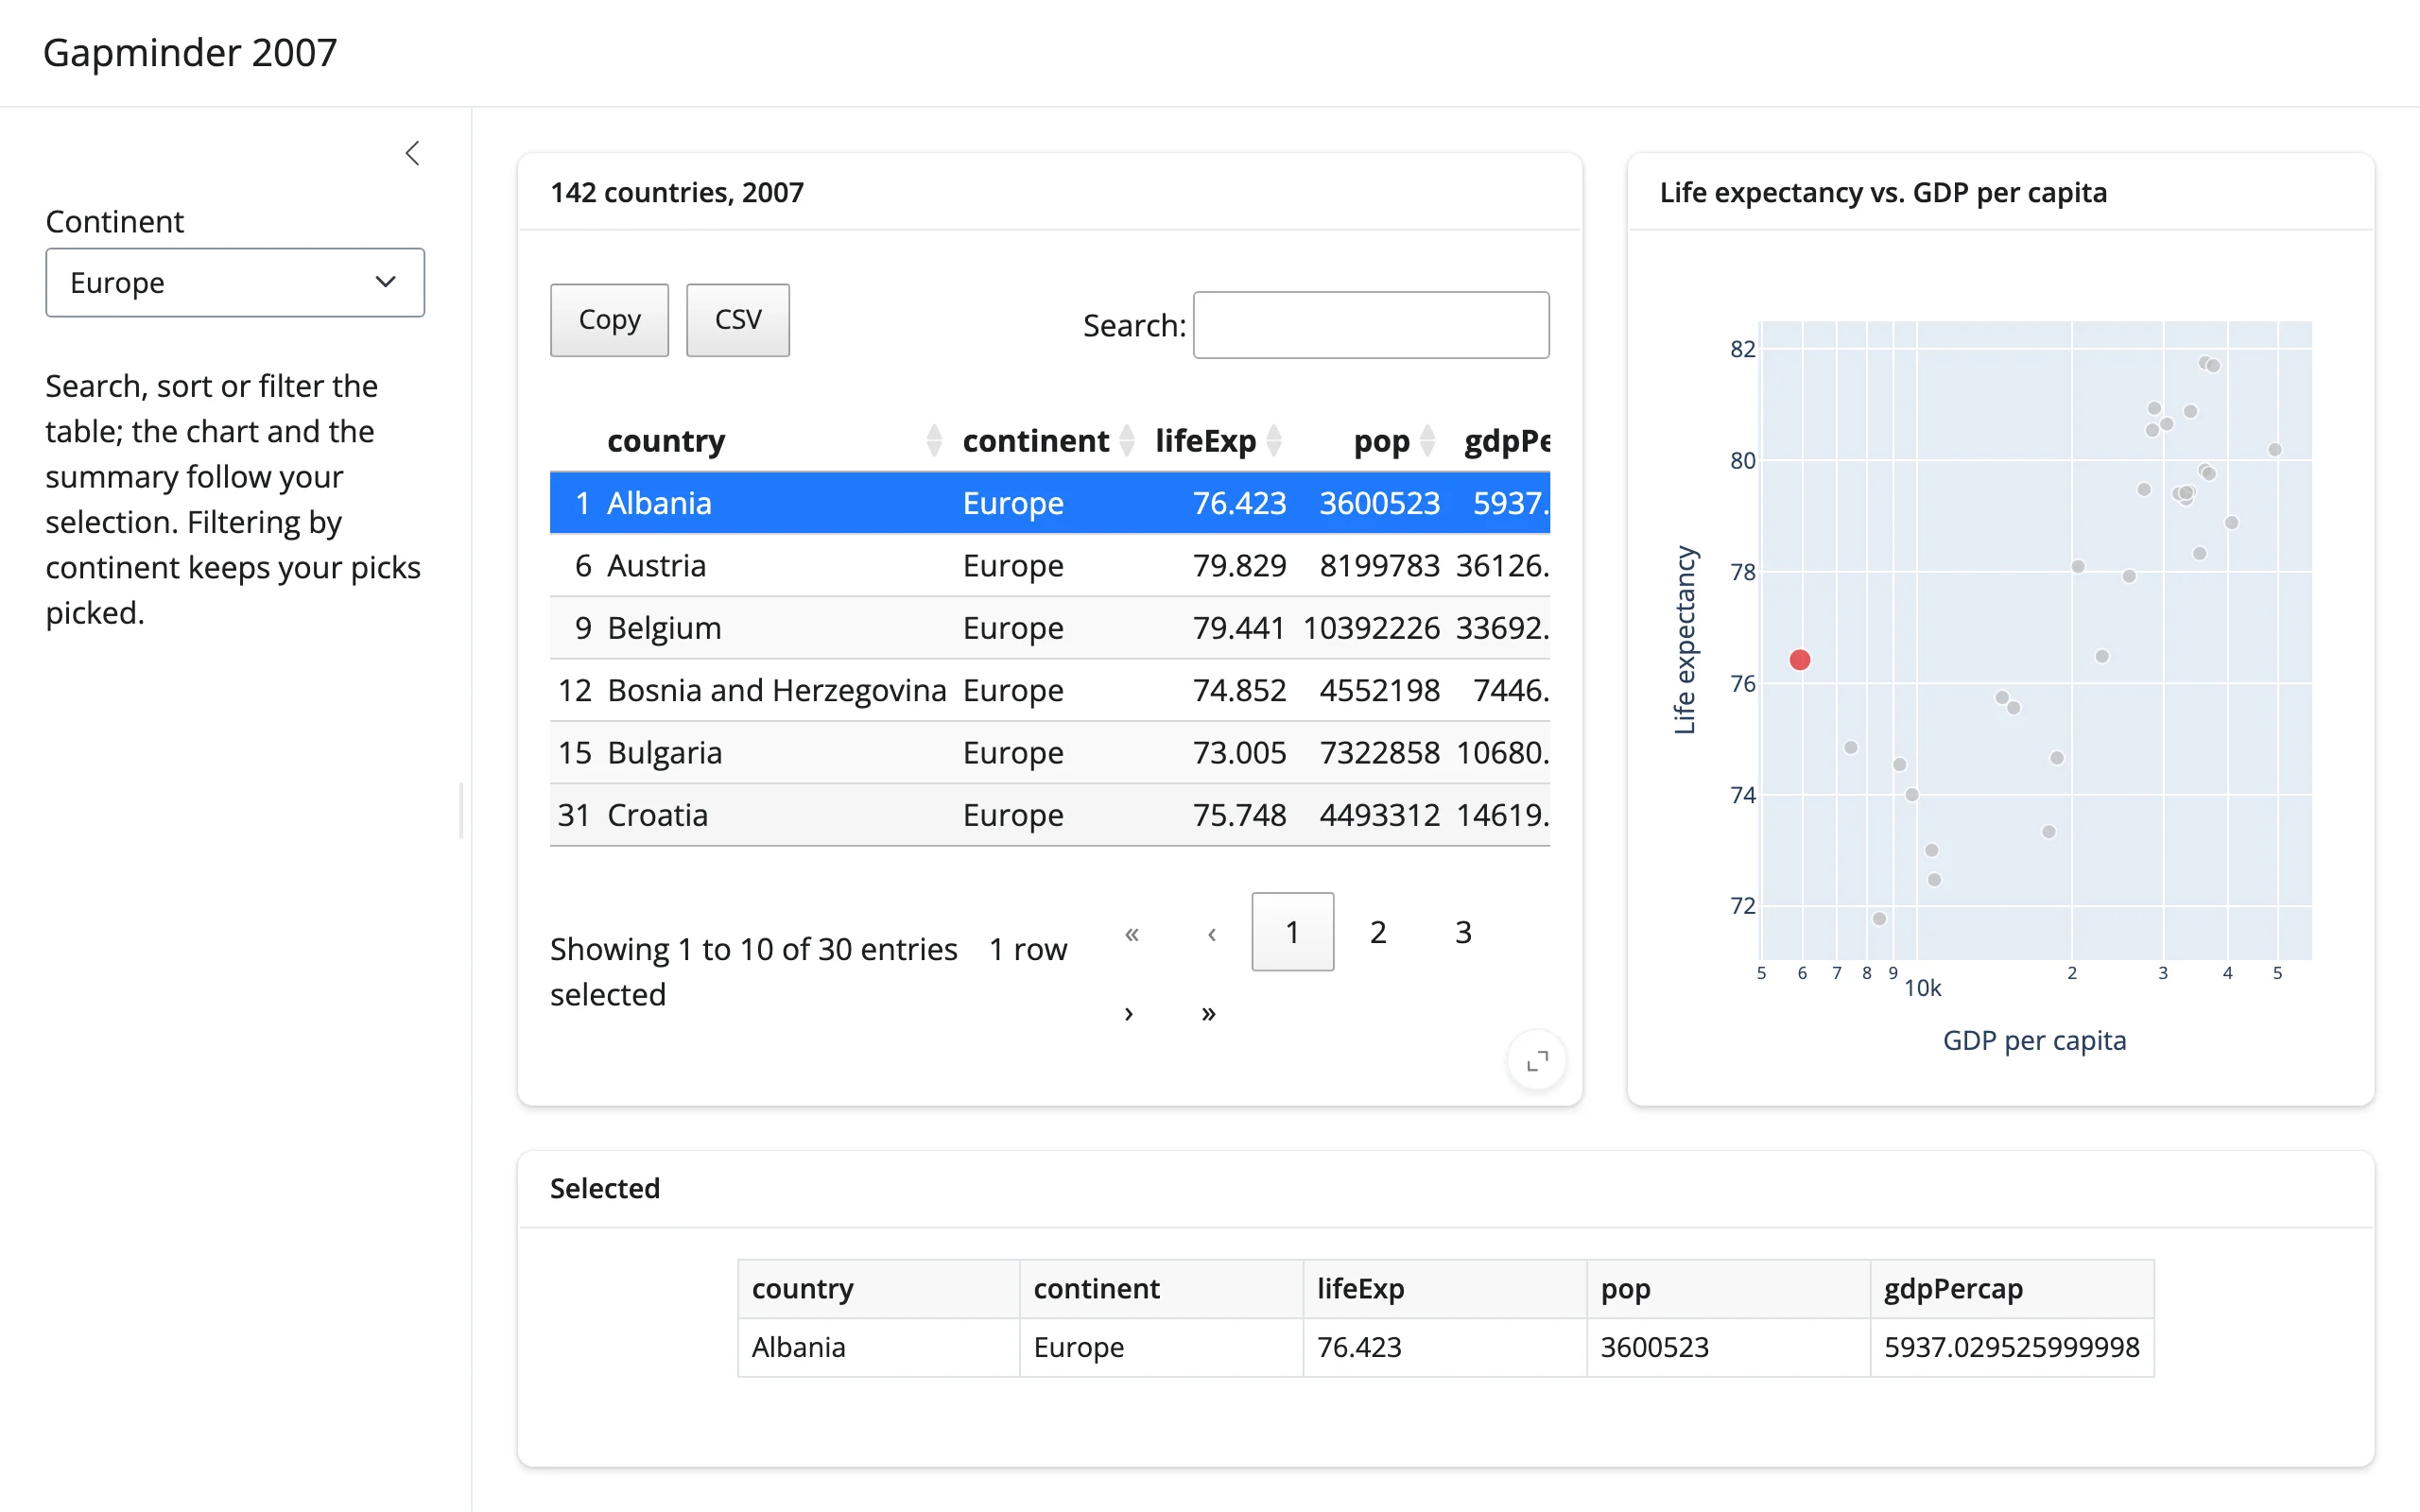
template gallery/showcase_gapminder_dashboard.py– showcase. The quickstart table, a continent filter, and a plotly scatter plot, all kept in sync: selecting rows highlights them on the plot in place; filtering by continent narrows the table and the plot together while re-mapping the kept selection by country name.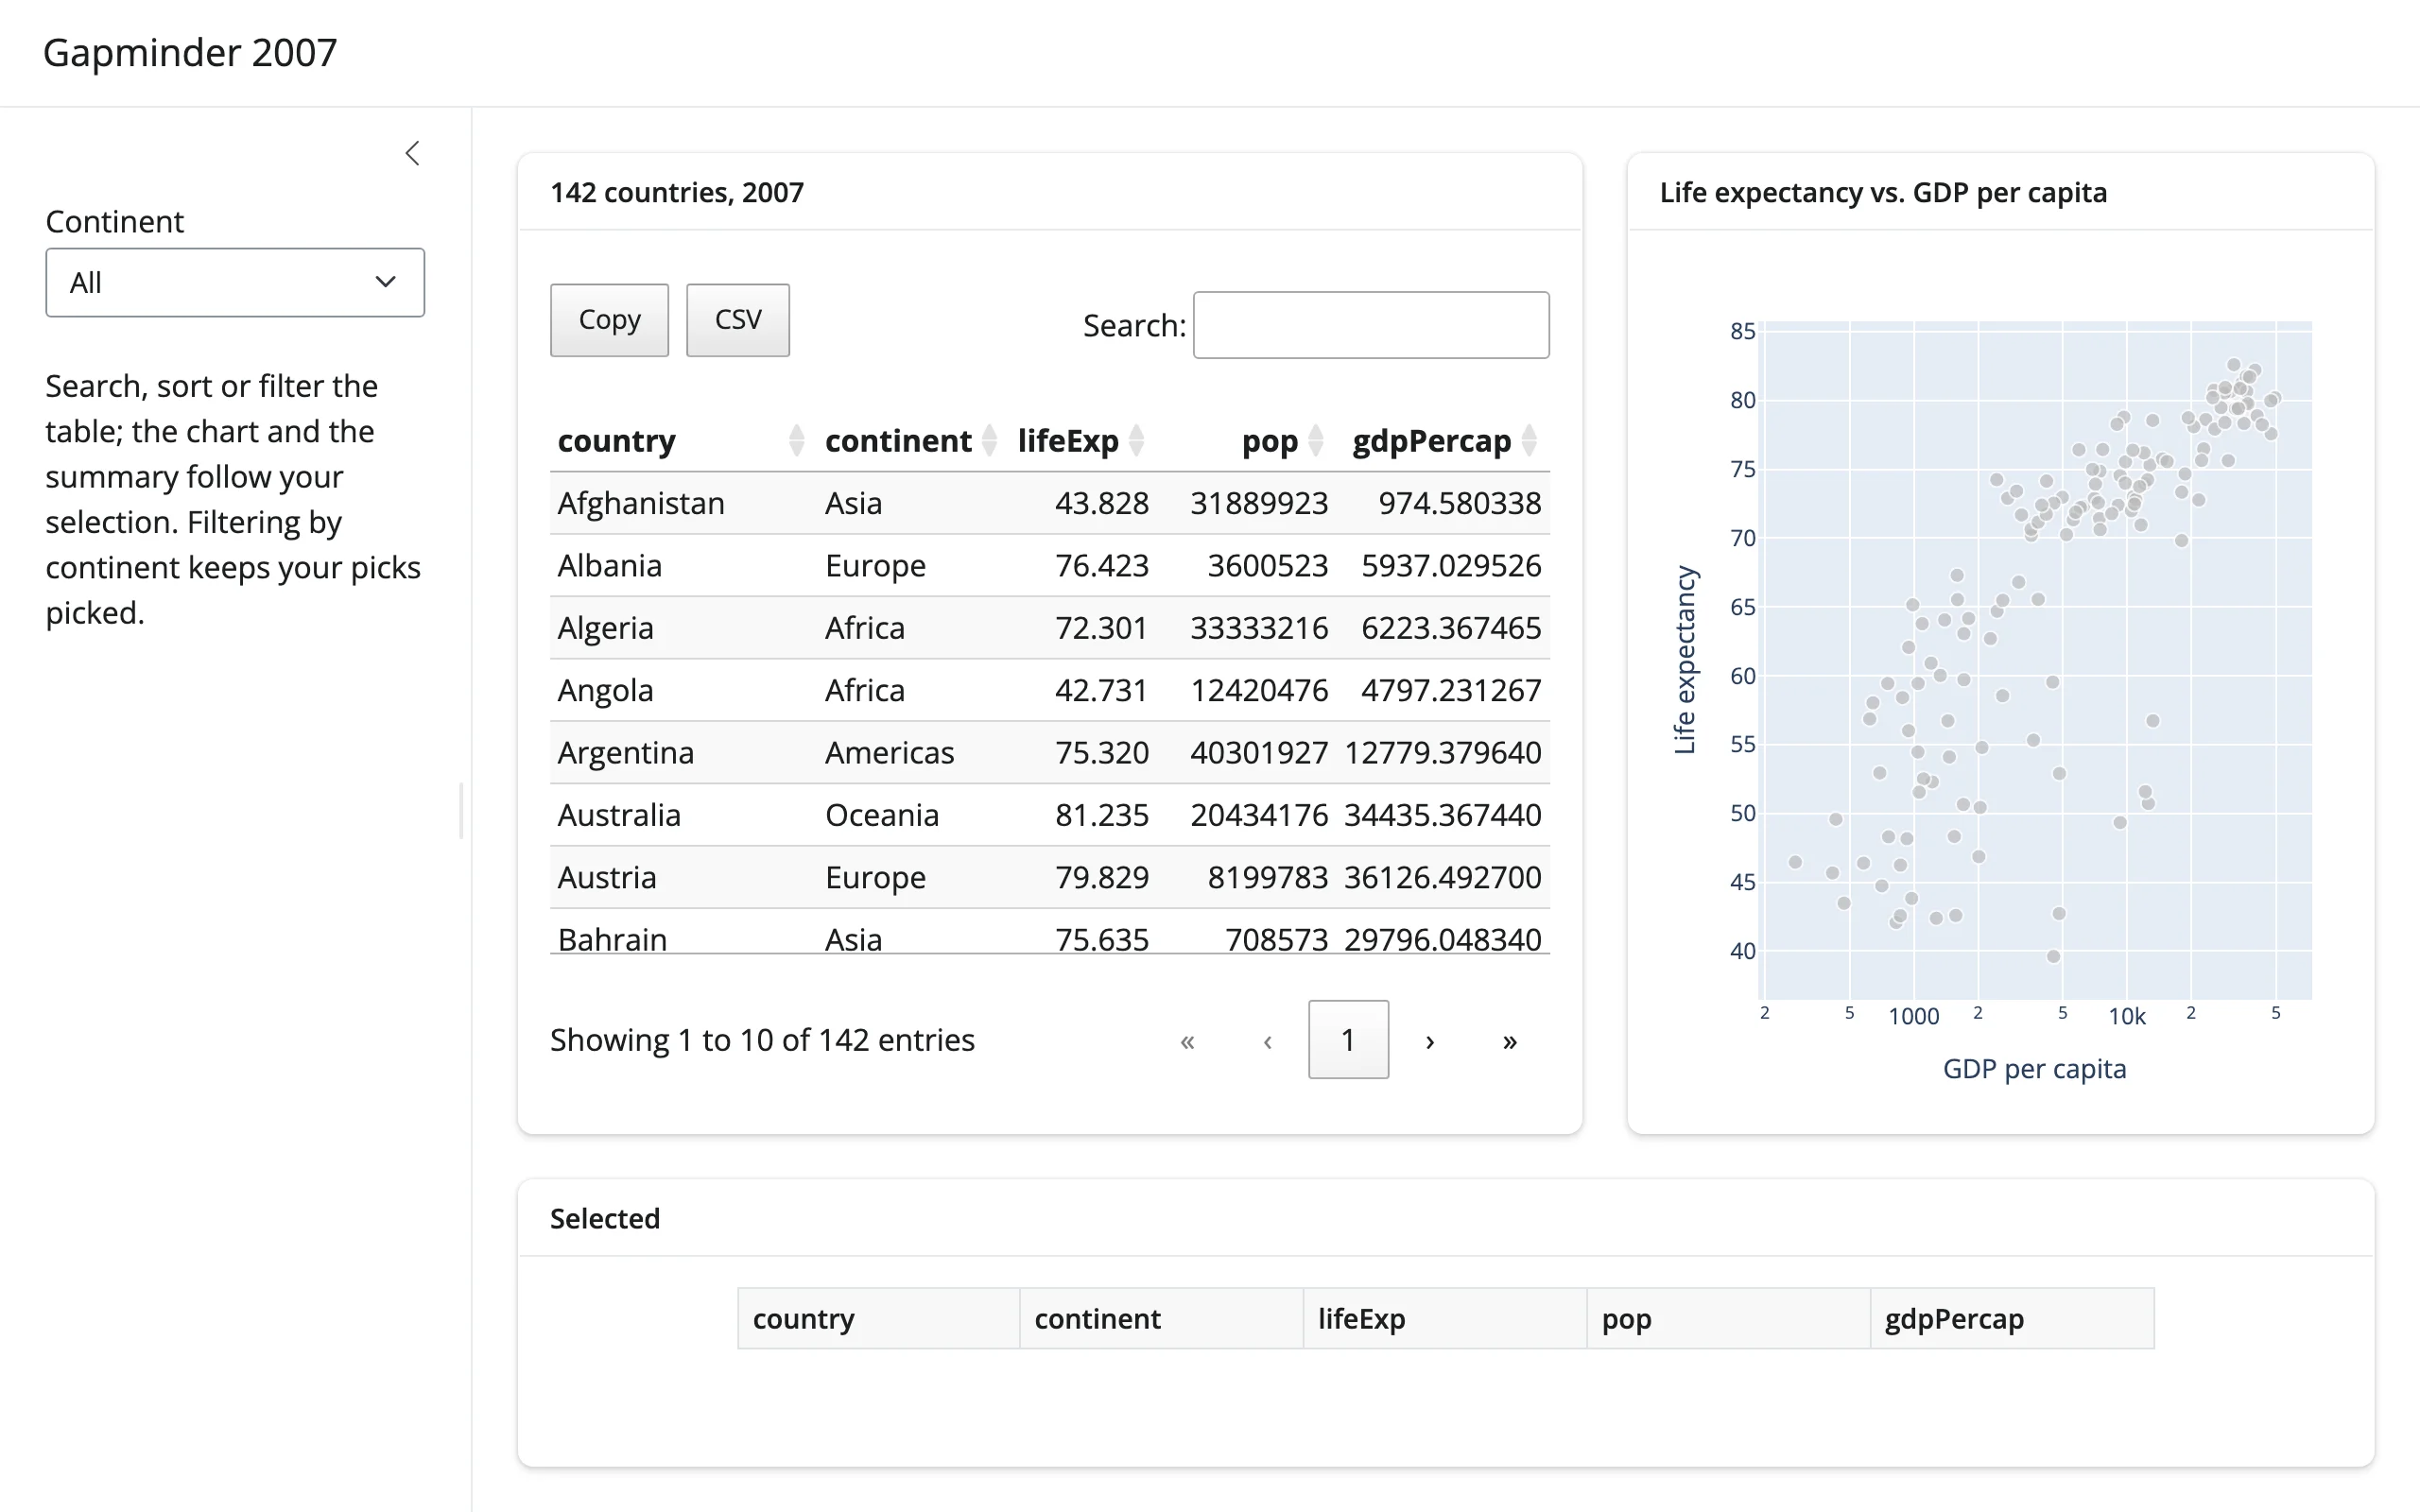
Learn more
- itables.org – the full options reference, including every DataTables extension itables bundles (SearchPanes, SearchBuilder, RowGroup, FixedColumns, KeyTable, and more).
- itables.org: Shiny – upstream’s own Shiny notes.
- DataTables – the underlying jQuery table library, for option names and extension docs that itables passes through.
- Related guides in this roster: reactable, ipydatagrid, perspective, plotly.