Panel
Panel is HoloViz’s app-and-dashboard framework, built on Bokeh and maintained by Anaconda/HoloViz. Panel is itself a complete alternative to Shiny: it has its own reactive model (param), its own layouts, and its own page templates. That overlap is exactly why shinywidgets doesn’t try to run a Panel app inside Shiny. Instead, @render_panel lets you reuse Panel’s component library – pn.widgets.Tabulator, pn.chat.ChatInterface, pn.indicators.*, custom pn.custom.JSComponents, and any pane Panel knows how to draw (pn.pane.Vega, pn.pane.Plotly, pn.pane.Markdown, …) – as one output in a Shiny app whose reactivity, layout, and page chrome stay entirely Shiny’s.
The decorated function may return anything pn.panel() accepts: a widget, a pane, a layout, a string, a DataFrame, a figure, or your own pn.viewable.Viewer/pn.custom.JSComponent subclass. Panel renders it through Bokeh, via jupyter_bokeh, the same library Jupyter uses to show Panel objects in a notebook without a Panel server – shinywidgets reuses that mechanism so Panel’s own Python callbacks (pn.bind(), .param.watch(), on_click(), even periodic callbacks) run for real, synchronously inside the Shiny server, whenever the user interacts with the component in the browser.
render_panel has one accessor, param(name), but it’s a general one: it reads any parameter of the rendered object reactively – slider.param("value"), table.param("selection"), chat.param("objects"), whatever param.Parameterized attribute the object you returned happens to have. A reactive function that calls it re-runs whenever that parameter changes, from browser interaction or from Python, the same way input.my_slider() reads an ordinary Shiny input – and because it’s seeded at render and kept live from then on, you can read it at any time: in a button handler, a download handler, an LLM tool, not just a dedicated watcher. Panel’s state lives in param objects, not ipywidget traits, so reactive_read() doesn’t apply to it; param(name) is the accessor-shaped replacement. It only reaches parameters on the object you returned directly, though – a widget nested one level down (e.g. inside a pn.Row or pn.Column you assembled and returned) needs a plain obj.param.watch(...) instead (see Reacting to user interaction).
Reach for render_panel when you want a specific Panel-only component (Tabulator’s formatters and theming, pn.chat, an indicator, a small custom JSComponent) inside an otherwise-ordinary Shiny app. Don’t reach for it to rebuild a Panel app inside Shiny – you’d be running two reactive systems and a page-layout system you don’t need; use Shiny’s own inputs, layouts, and render_plotly / render_bokeh / render_itables instead, and save render_panel for the handful of components below that have no equivalent elsewhere in the roster.
Installation
pip install 'shinywidgets[panel]'That installs panel and jupyter_bokeh. Panel’s own JavaScript and CSS (including per-extension bundles like Tabulator’s and ECharts’) are served locally from the installed panel package – no CDN round trip, no extra setup, including the lazily-fetched resources some panes request after the initial bundle (e.g. the ECharts-GL sub-bundle pn.indicators.Gauge needs). shinywidgets mounts the /static/extensions/panel/... path those requests hit, matching what a real Panel/Bokeh server serves.
Quick start
A pn.widgets.Tabulator with no server of its own:
import panel as pn
import plotly.express as px
from shiny.express import ui
from shinywidgets import render_panel

pn.extension("tabulator")

tips = px.data.tips()

ui.page_opts(title="Panel quickstart", fillable=True)

with ui.card(full_screen=True):
    ui.card_header("A Panel Tabulator, with no Panel server")

    @render_panel
    def table():
        return pn.widgets.Tabulator(
            tips,
            selectable=True,
            disabled=True,
            theme="bootstrap5",
            layout="fit_columns",
            sizing_mode="stretch_both",
        )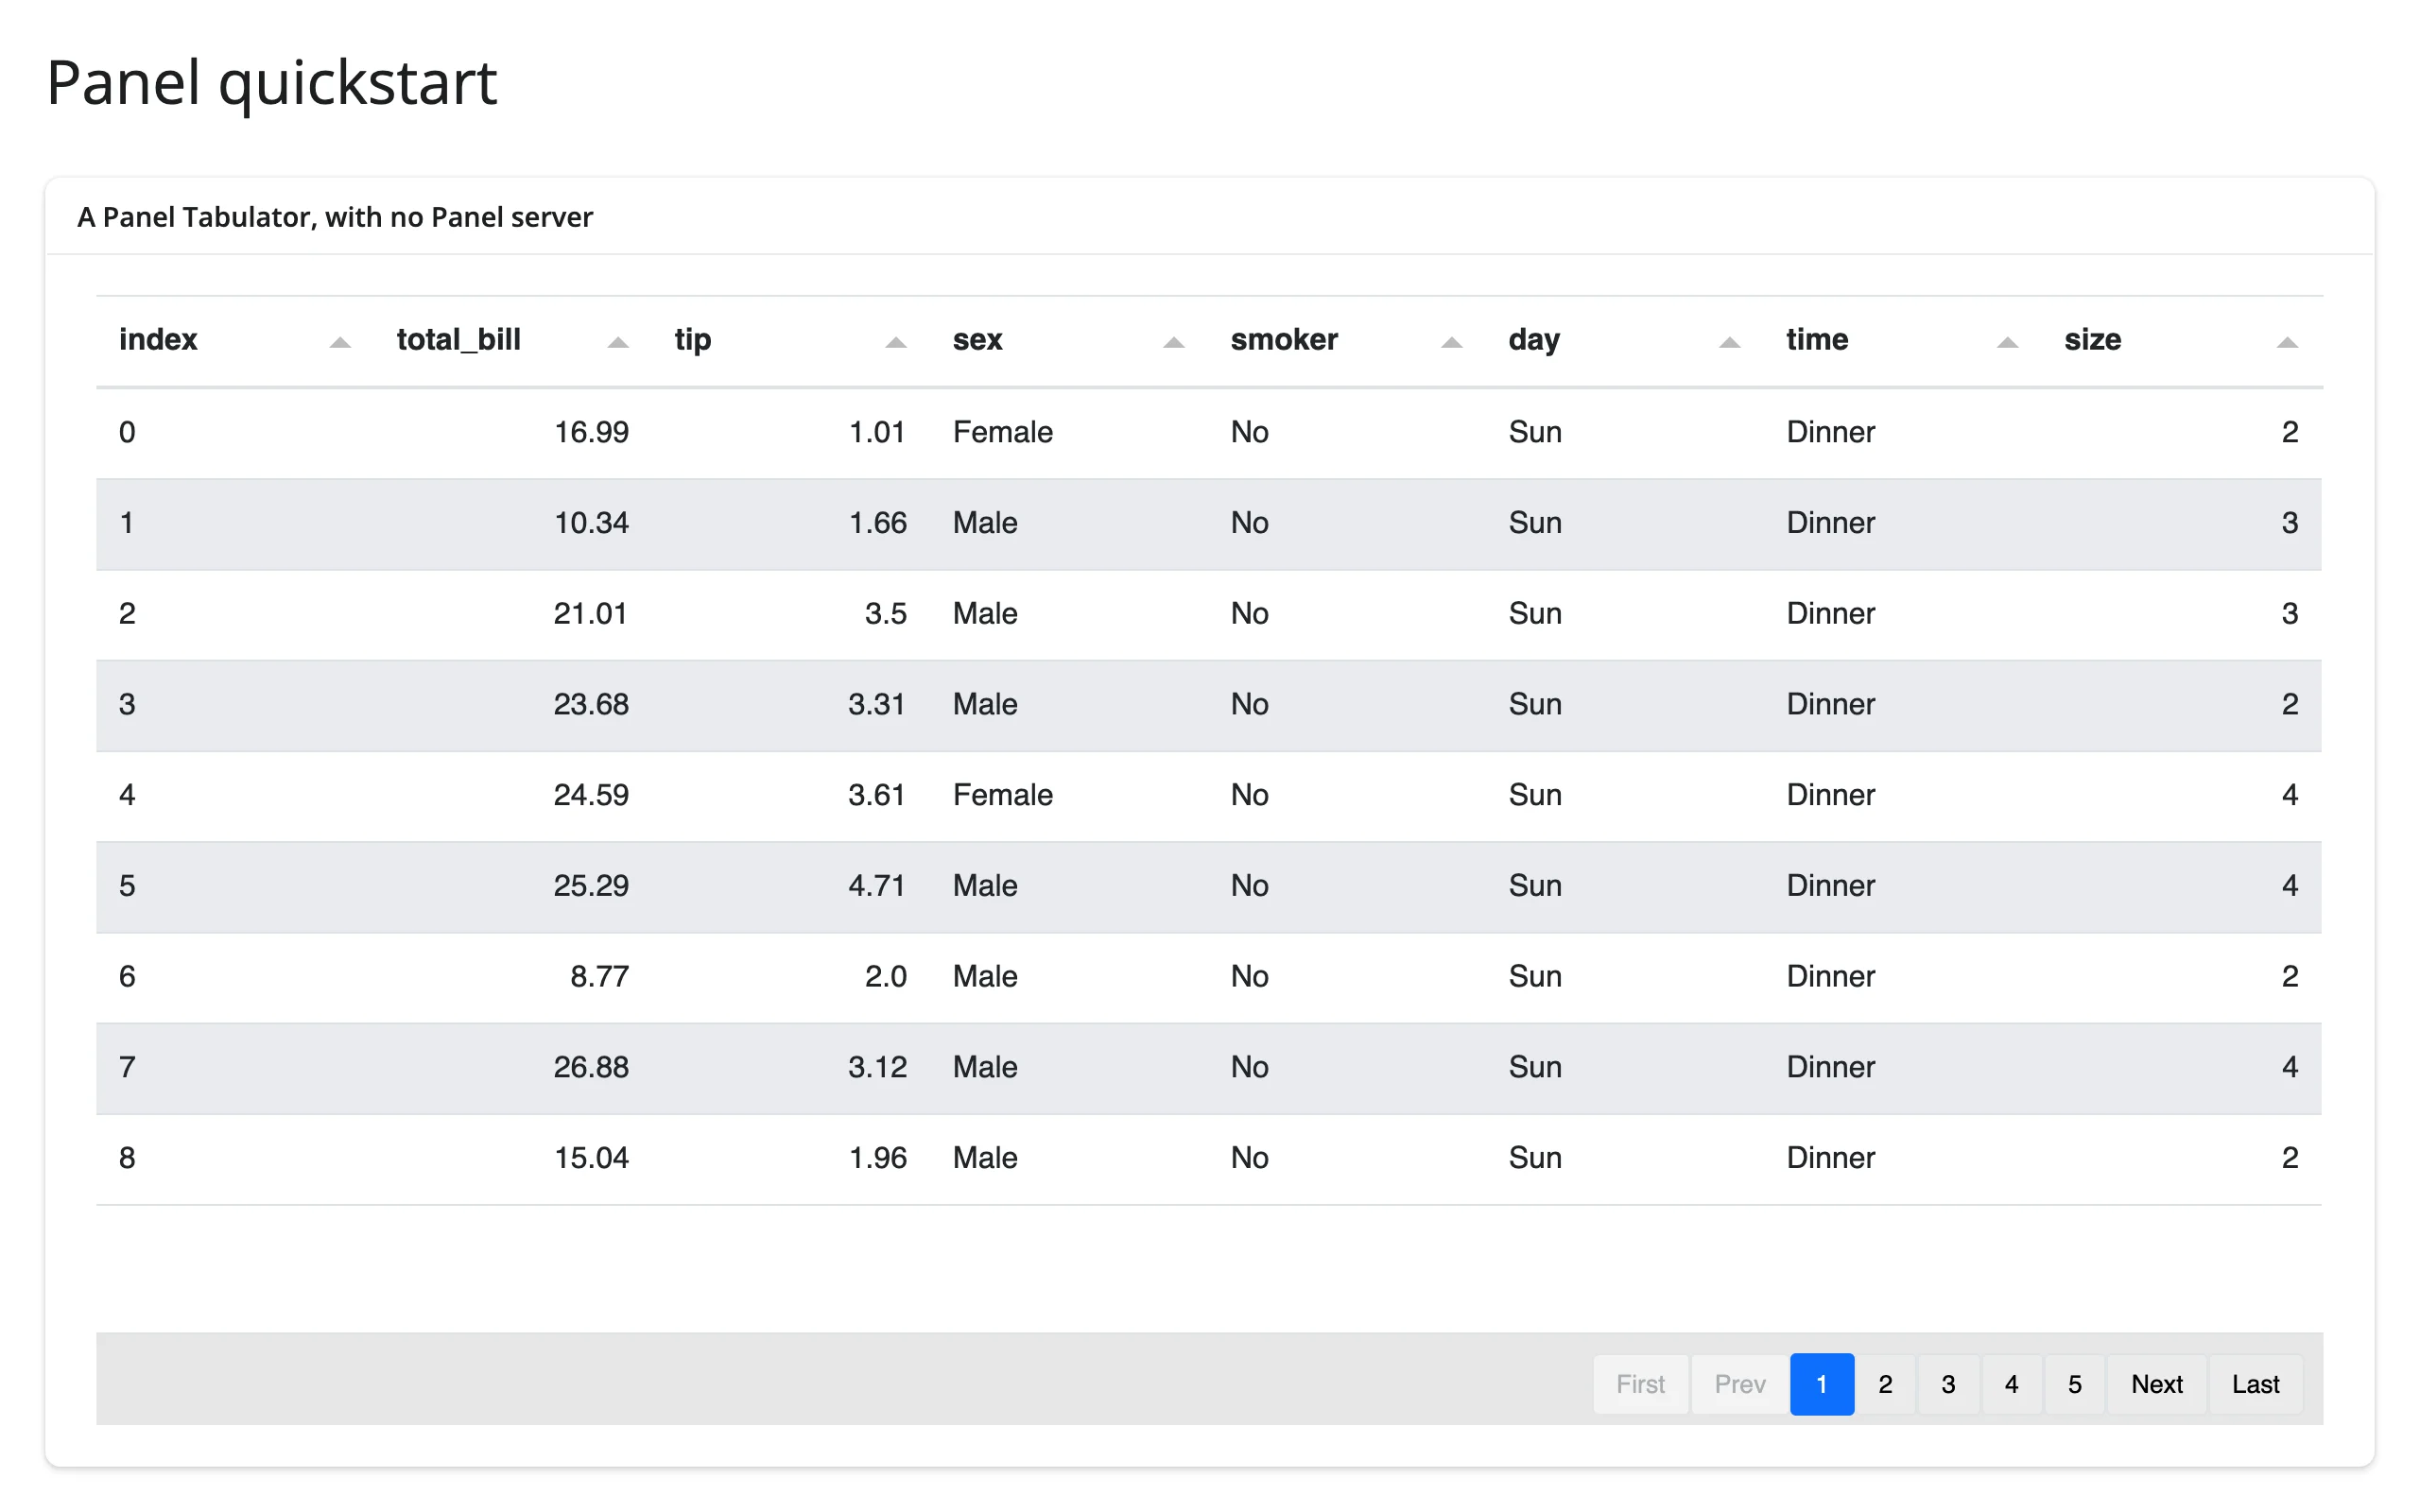
pn.extension("tabulator") loads Tabulator’s JavaScript up front (see Gotchas for what happens if you skip it for a component that appears later). disabled=True matters too: Tabulator’s cells are editable by default, so without it, clicking a cell starts editing instead of selecting the row. sizing_mode="stretch_both" is what makes the table fill the card – see Layout and sizing.
What you can build
A themed, formatted data table
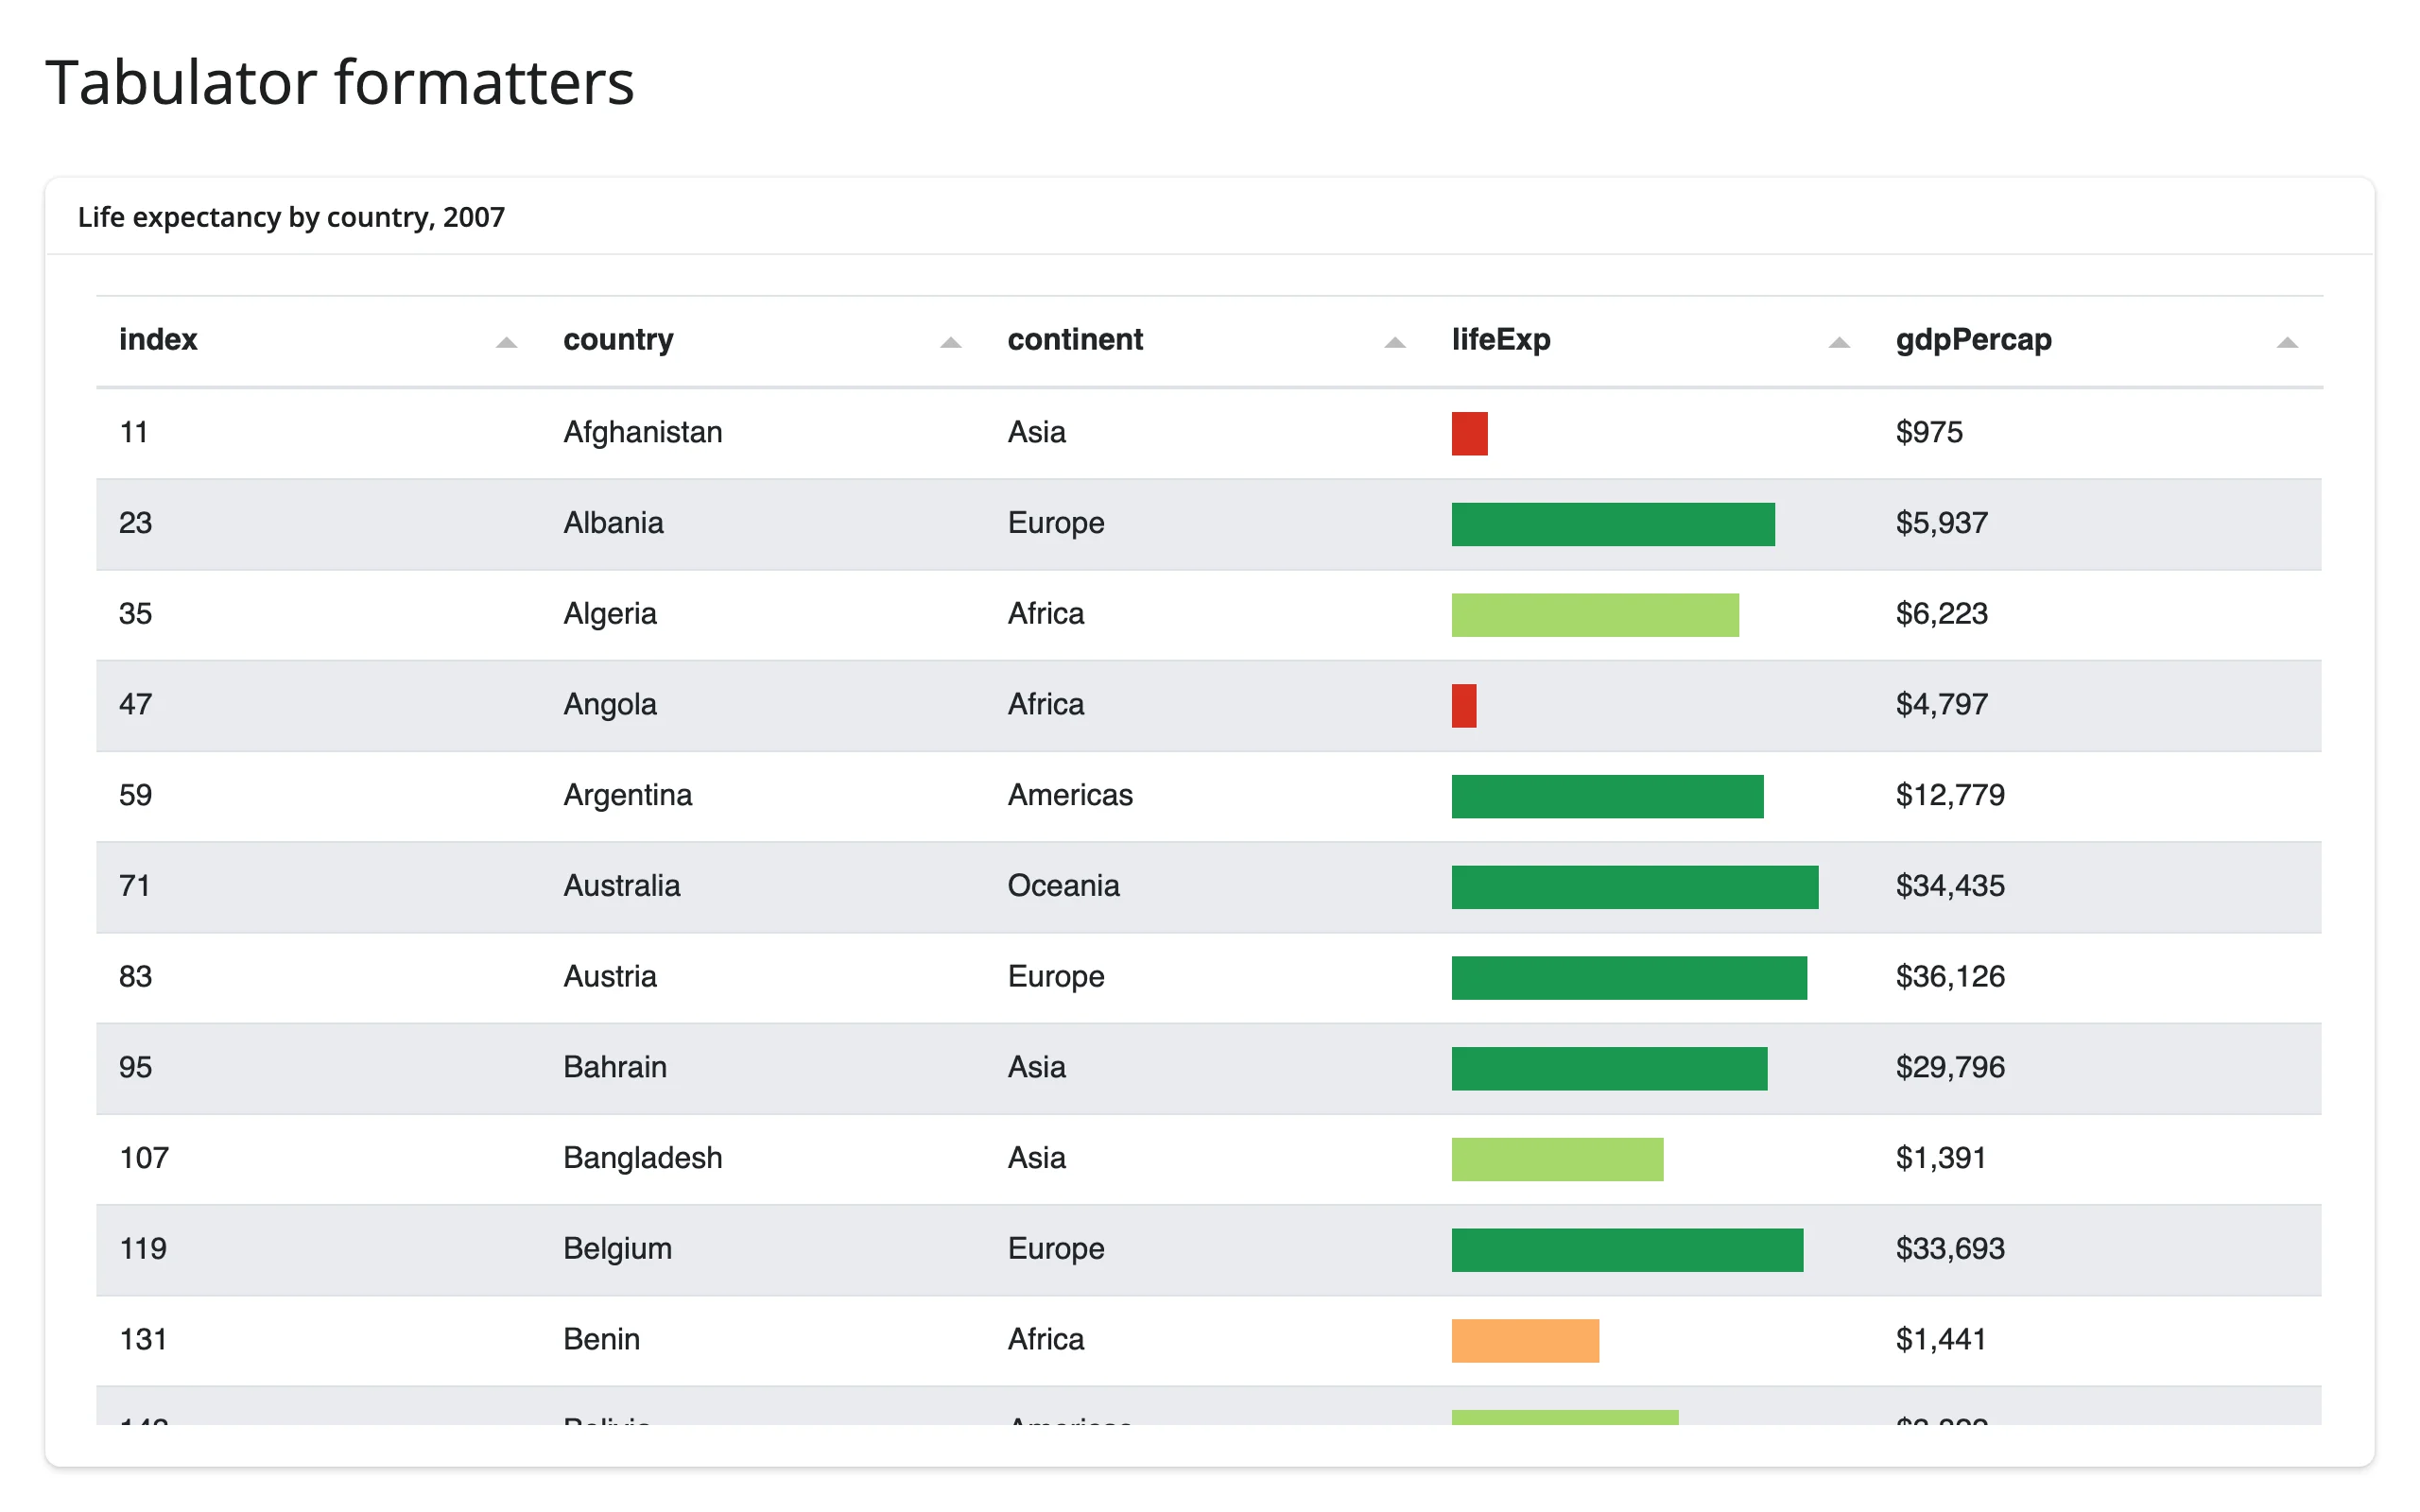
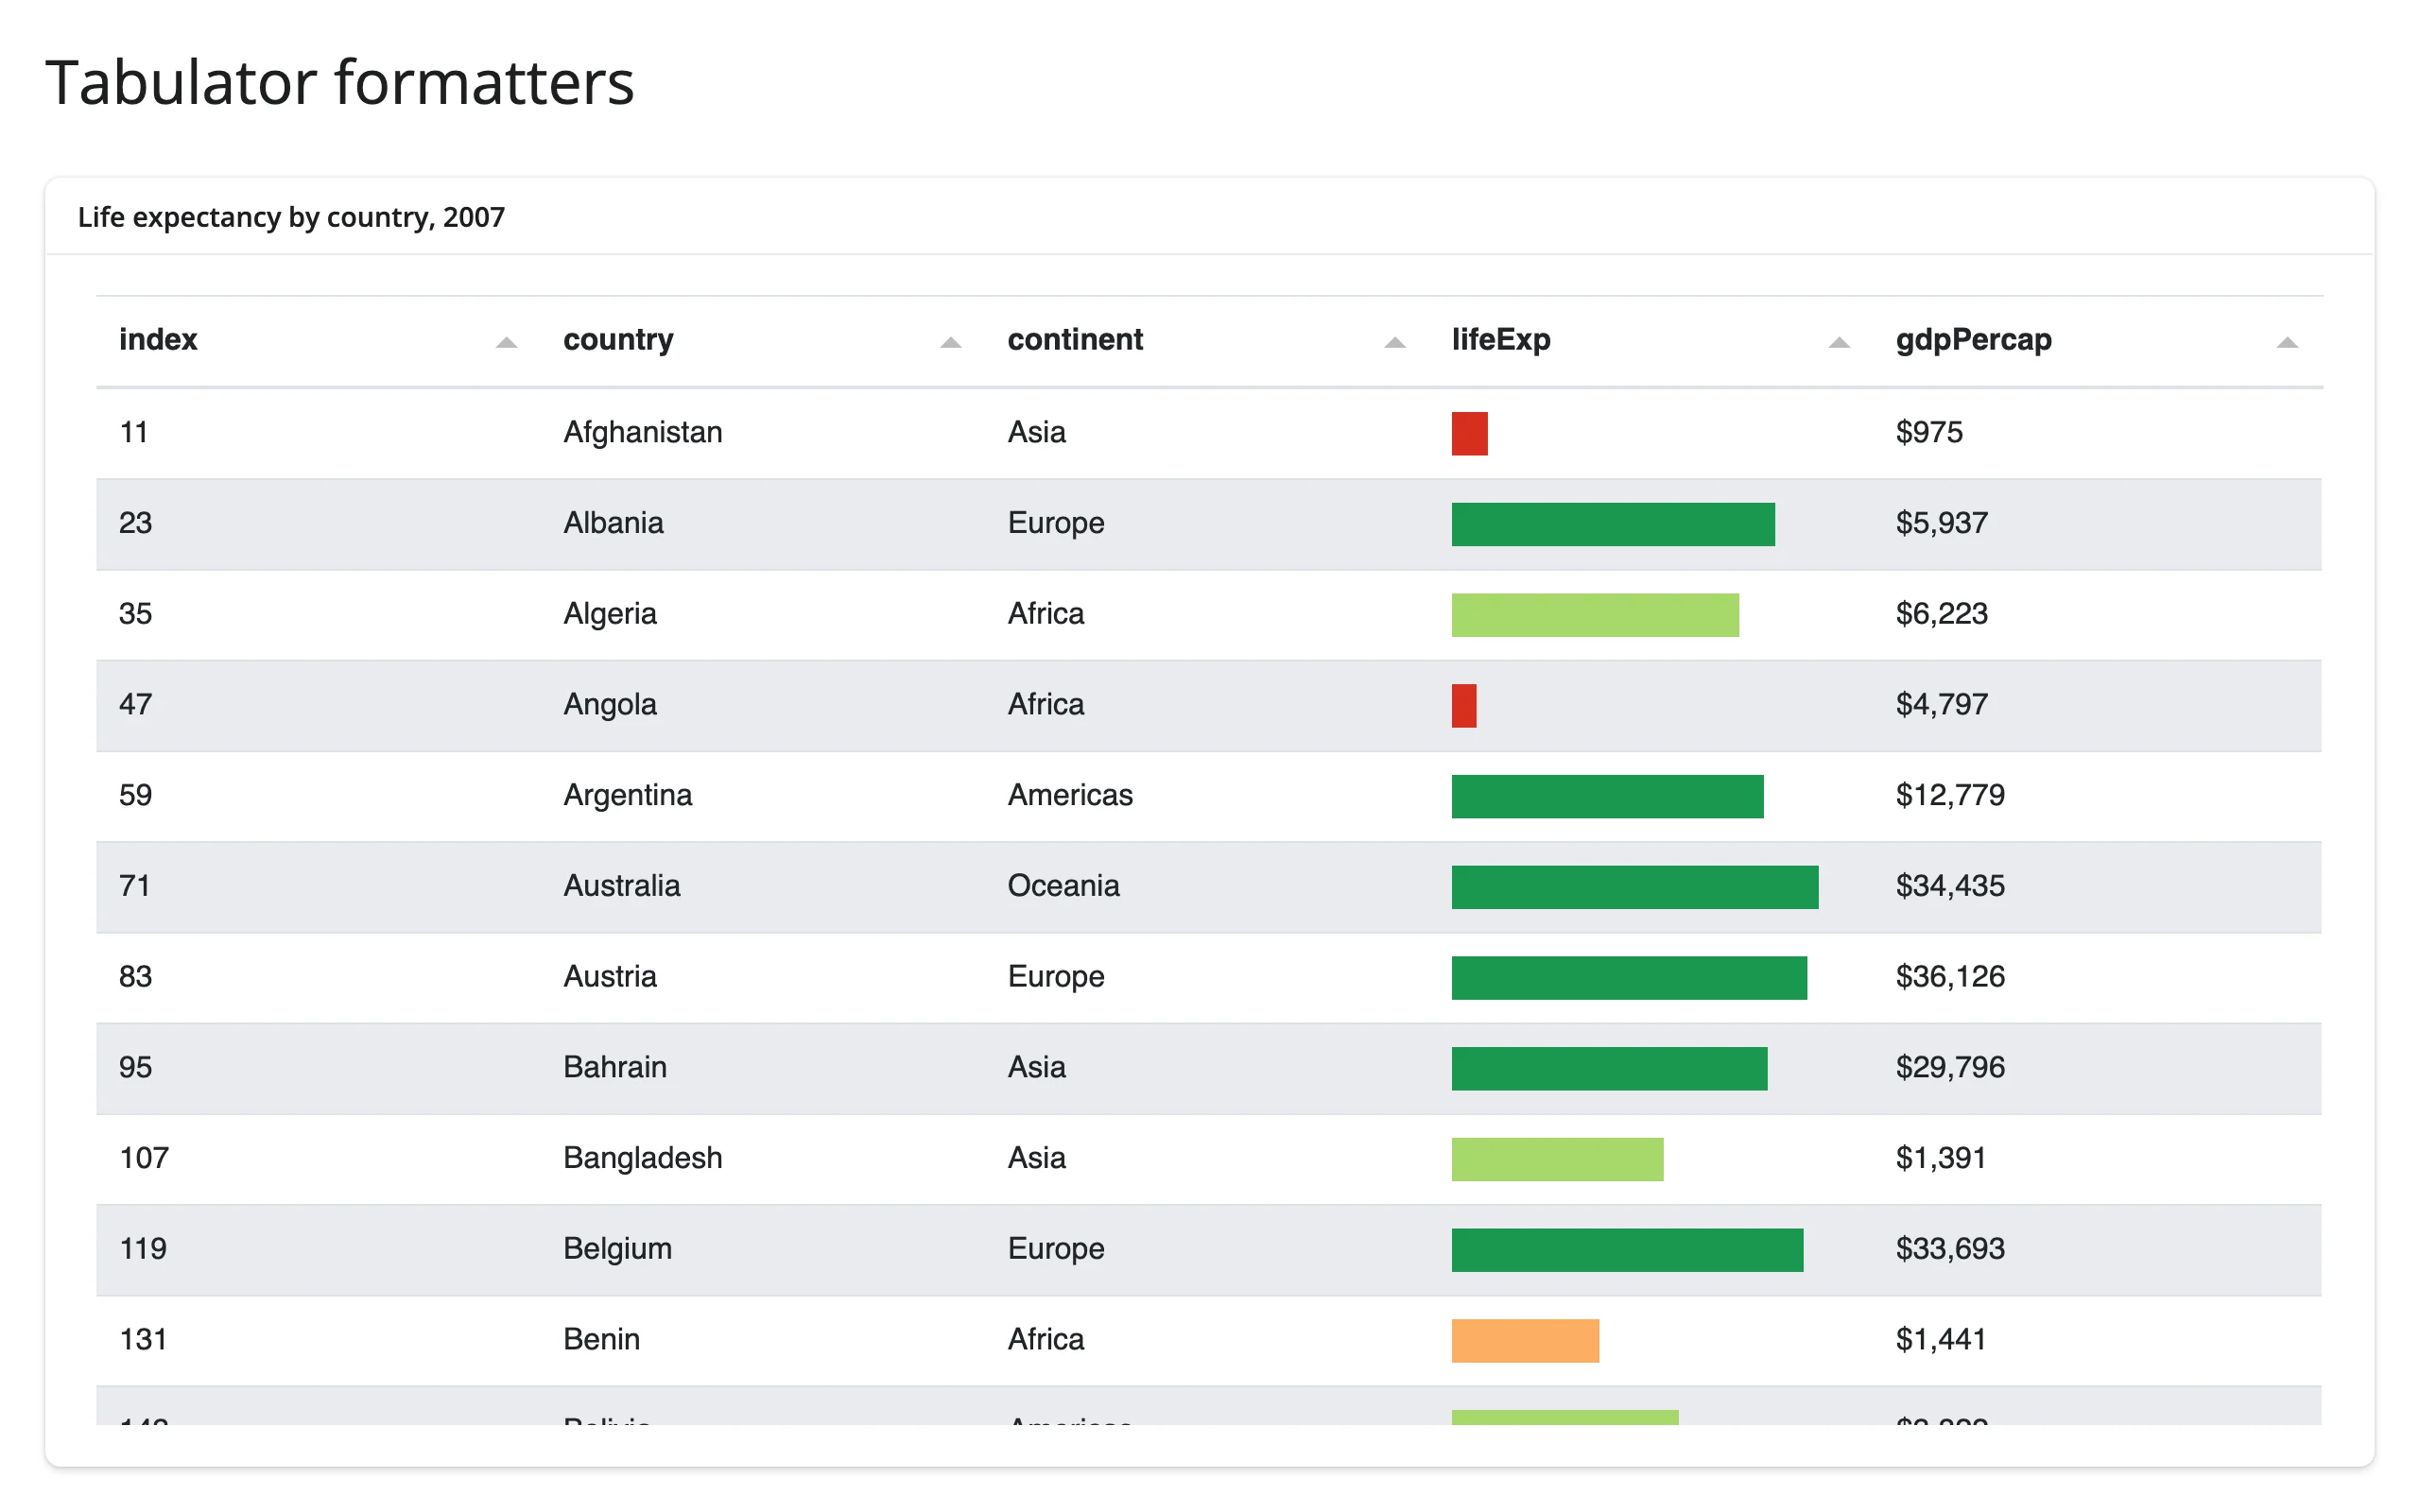
Tabulator is Panel’s standout component: sortable, filterable, with per-column formatters (progress bars, currency, dates) and built-in themes. None of this requires a line of custom CSS:
import panel as pn
import plotly.express as px
from shiny.express import ui
from shinywidgets import render_panel

pn.extension("tabulator")

gapminder_2007 = px.data.gapminder().query("year == 2007")

ui.page_opts(title="Tabulator formatters", fillable=True)

with ui.card(full_screen=True):
    ui.card_header("Life expectancy by country, 2007")

    @render_panel
    def table():
        return pn.widgets.Tabulator(
            gapminder_2007[["country", "continent", "lifeExp", "gdpPercap"]],
            selectable=True,
            disabled=True,
            theme="bootstrap5",
            layout="fit_columns",
            sizing_mode="stretch_both",
            formatters={
                "lifeExp": {
                    "type": "progress",
                    "min": 40,
                    "max": 85,
                    "color": ["#d7301f", "#fdae61", "#a6d96a", "#1a9850"],
                },
                "gdpPercap": {"type": "money", "symbol": "$", "precision": 0},
            },
        )
For a table with Shiny’s own selection/edit/pagination model (and an accessor for selected rows), see itables or reactable instead – Tabulator is worth it specifically for its formatters, theming, and client-side filtering.
Dashboard indicators
pn.indicators gives you gauges, big-number tiles, and progress bars with no charting library of your own to wire up:
import panel as pn
from shiny.express import ui
from shinywidgets import render_panel

# Gauge is ECharts-backed; its JS loads through pn.extension() like any
# other extension-bundled pane.
pn.extension("echarts")

ui.page_opts(title="Panel indicators", fillable=True)

with ui.layout_columns(col_widths=[3, 3, 3, 3]):
    with ui.card():
        ui.card_header("Dial")

        @render_panel
        def dial():
            return pn.indicators.Dial(
                name="CPU", value=72, bounds=(0, 100), format="{value}%",
                colors=[(0.6, "green"), (0.85, "gold"), (1, "red")],
                sizing_mode="stretch_both",
            )

    with ui.card():
        ui.card_header("Gauge (ECharts)")

        @render_panel
        def gauge():
            return pn.indicators.Gauge(
                name="Load", value=64, bounds=(0, 100), sizing_mode="stretch_both",
            )

    with ui.card():
        ui.card_header("Number")

        @render_panel
        def number():
            return pn.indicators.Number(
                name="Monthly revenue", value=4239, format="${value:,.0f}",
                colors=[(5000, "red"), (10000, "green")],
                sizing_mode="stretch_both",
            )

    with ui.card():
        ui.card_header("Progress")

        @render_panel
        def progress():
            return pn.indicators.Progress(
                name="Deploy progress", value=64, sizing_mode="stretch_width",
                bar_color="success",
            )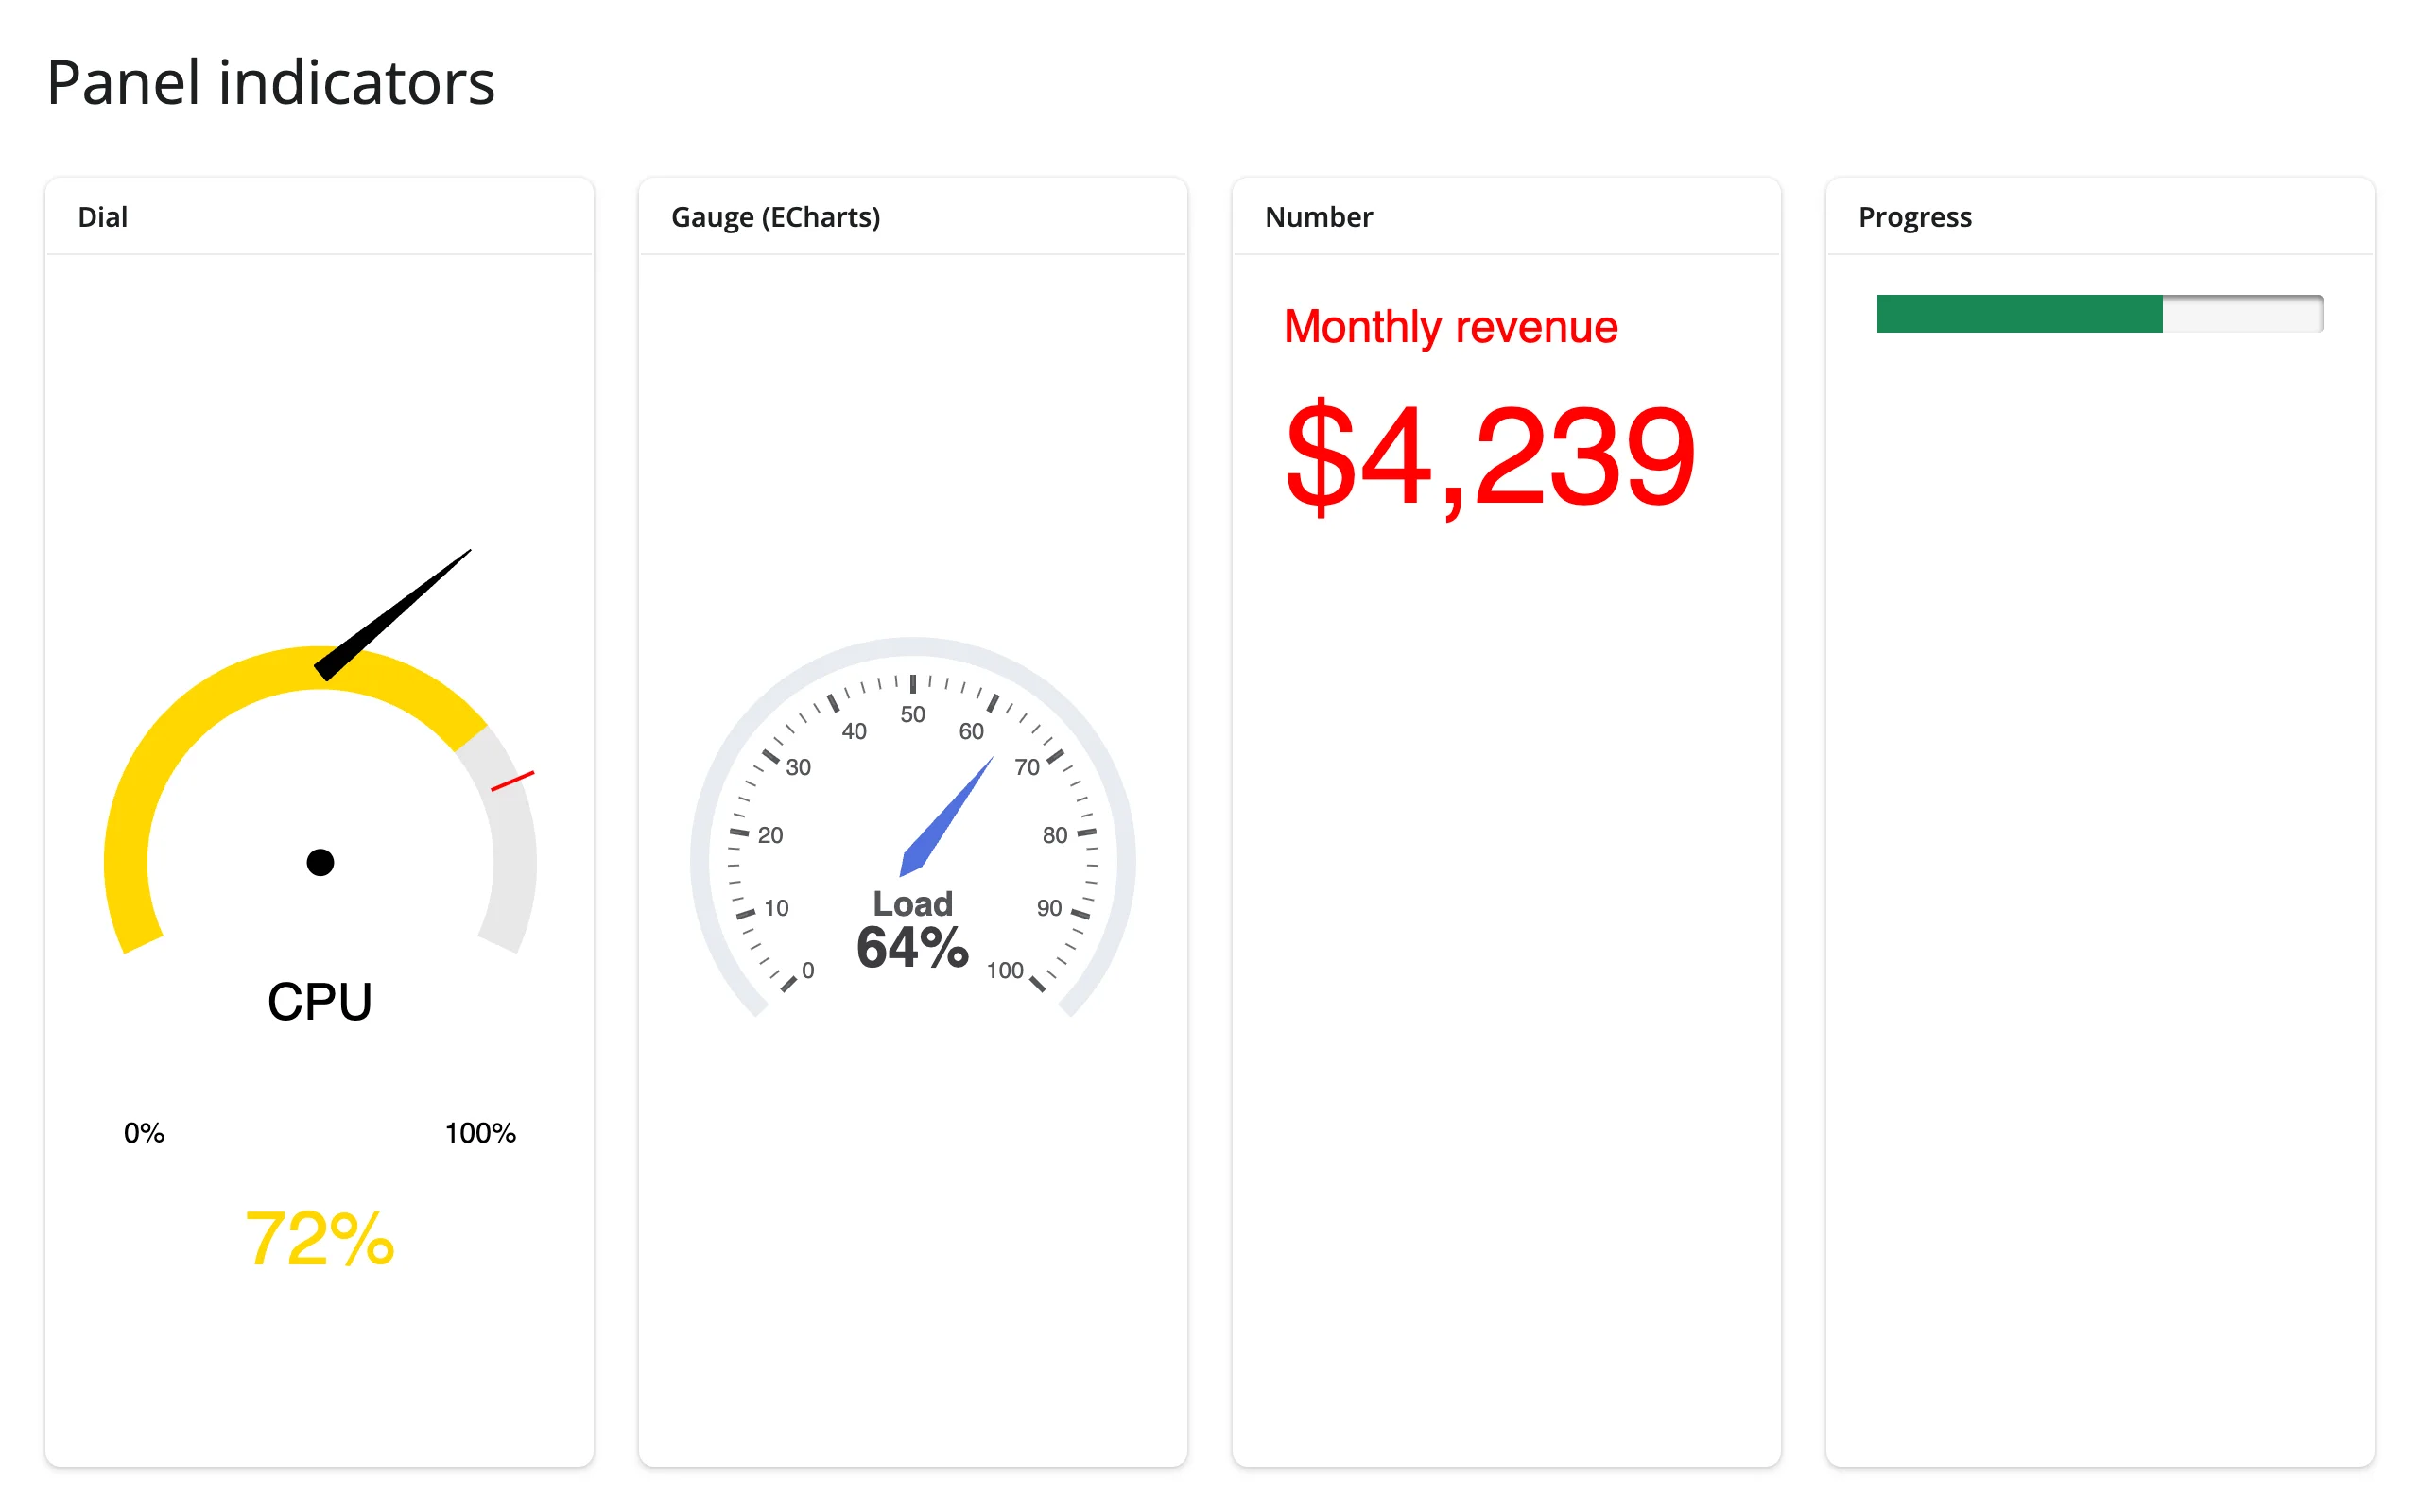
Dial, Number, and Progress all stretch to fill their card with sizing_mode="stretch_both"/"stretch_width". Gauge is ECharts-backed, so it needs pn.extension("echarts") up front; without it the gauge renders blank with a console error. A few other indicators (LinearGauge, Trend, BooleanStatus) are SVG-based and don’t size responsively – give them explicit width=/height= instead (see Gotchas).
A chat interface, no LLM required
pn.chat.ChatInterface is a full chat UI – message history, avatars, timestamps – driven by a plain Python callback. It doesn’t need a language model to be useful: the callback can be anything, including a rules engine over your app’s own data (see the fleet dashboard in the gallery):
import panel as pn
from shiny.express import ui
from shinywidgets import render_panel

ui.page_opts(title="Panel chat", fillable=True)


def canned_reply(contents: str, user: str, instance: pn.chat.ChatInterface):
    words = len(contents.split())
    return f"You said {words} word{'s' if words != 1 else ''}: \"{contents}\""


with ui.card(full_screen=True):
    ui.card_header("pn.chat.ChatInterface -- no LLM, no Panel server")

    @render_panel
    def chat():
        return pn.chat.ChatInterface(
            callback=canned_reply,
            show_rerun=False,
            show_undo=False,
            sizing_mode="stretch_both",
        )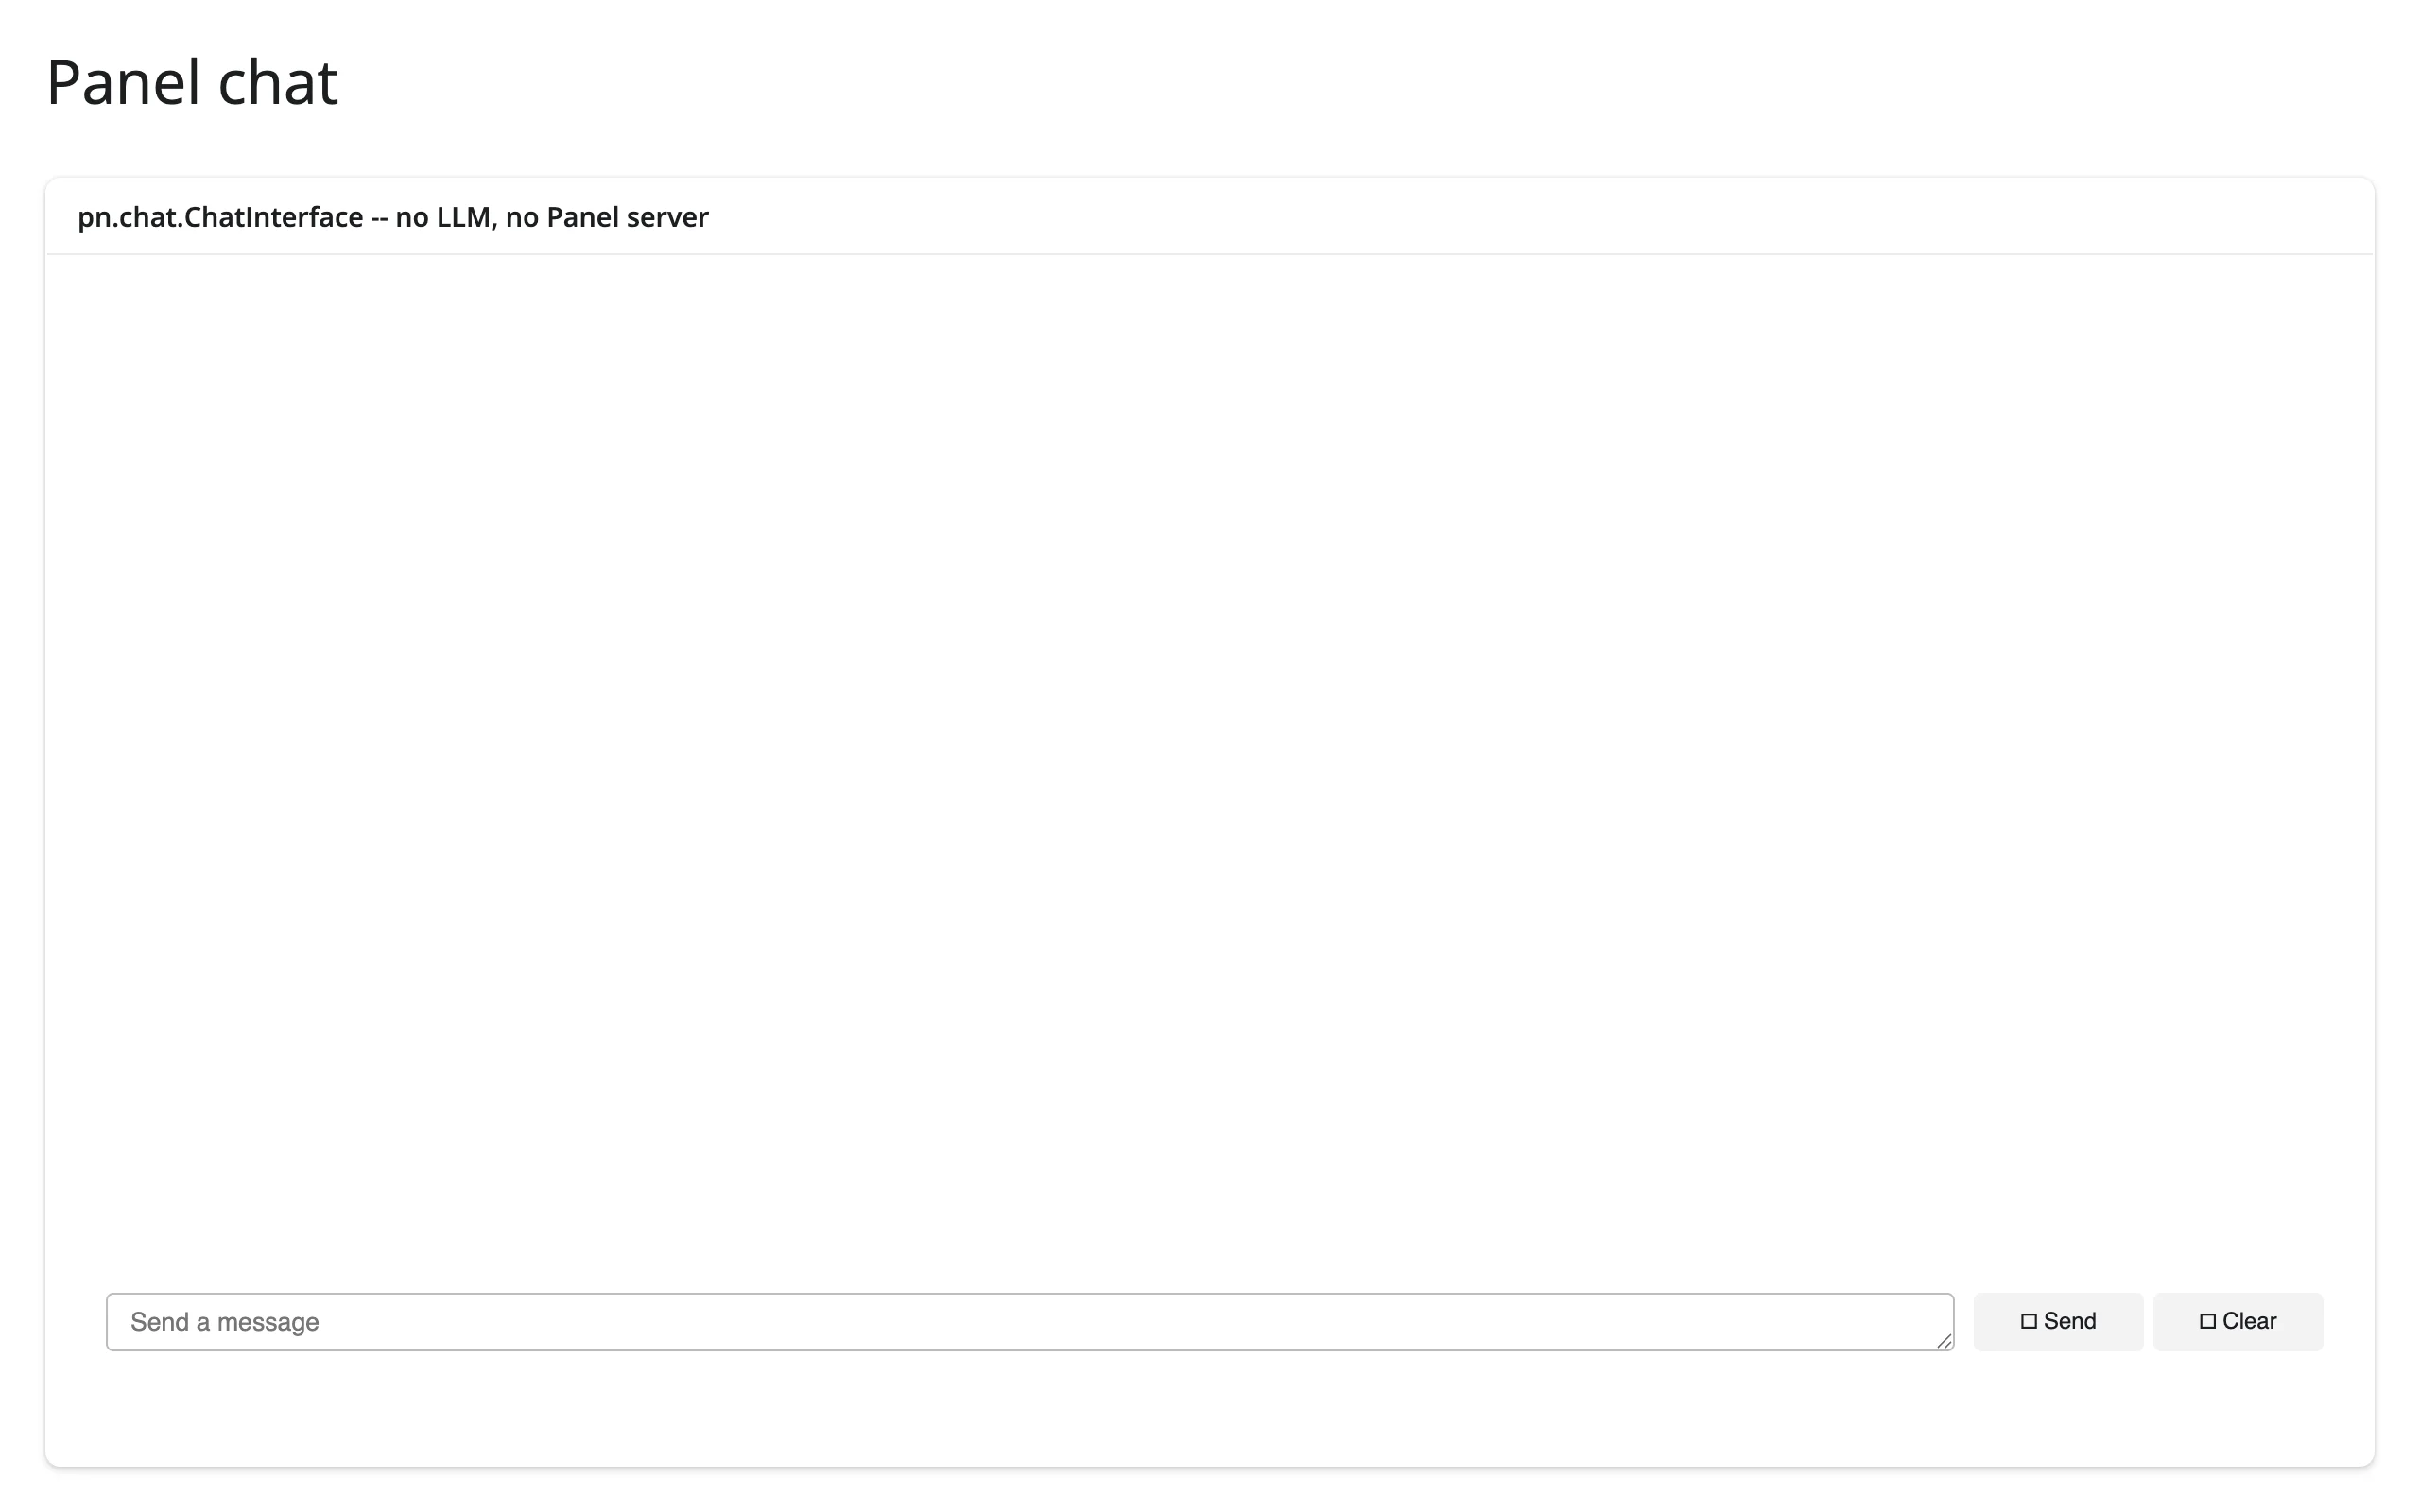
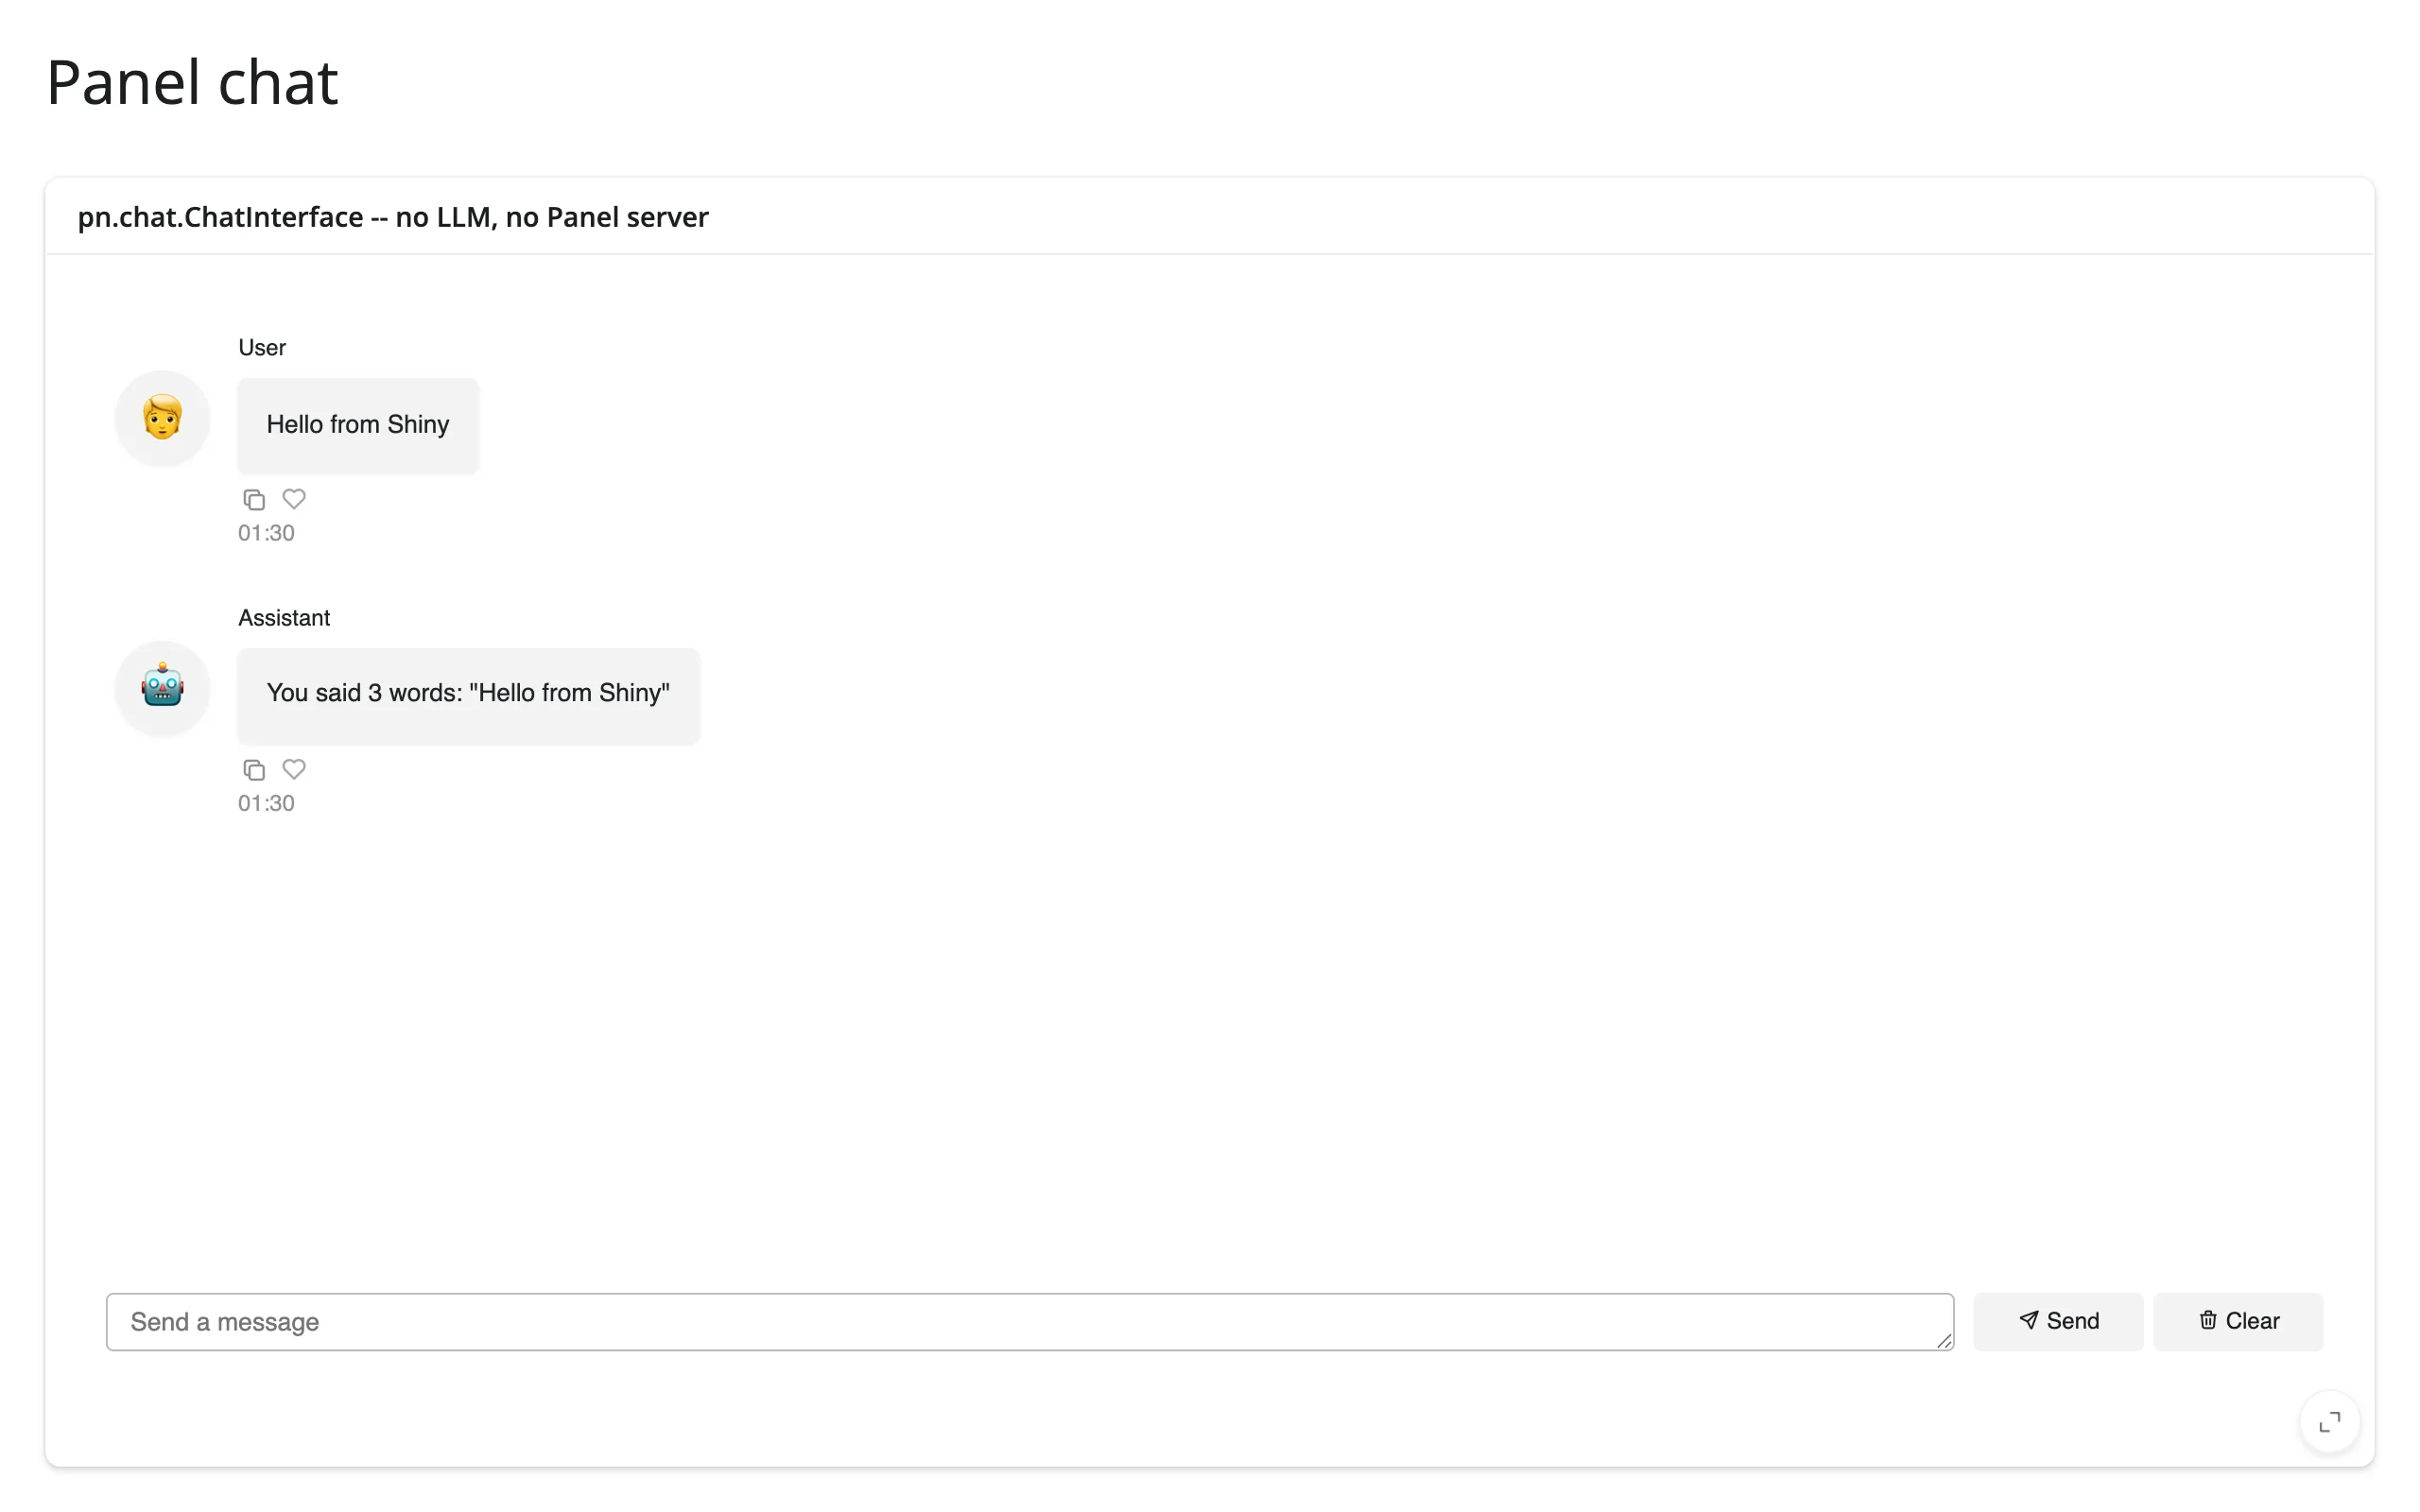
Typing a message and pressing send runs canned_reply inside the Shiny server and streams the reply back – verified with a real Playwright keystroke-and-click.
Bring your own JavaScript component
pn.custom.JSComponent turns a few lines of ESM into a two-way-synced component. model.<param> reads/writes the Python side; model.on(<param>, cb) reacts to Python-side changes:
import panel as pn
import param
from shiny.express import ui
from shinywidgets import render_panel


class Counter(pn.custom.JSComponent):
    count = param.Integer(default=0)

    _esm = """
    export function render({ model, el }) {
      const button = document.createElement("button");
      const render = () => button.innerText = `Count is ${model.count}`;
      render();
      button.onclick = () => model.count += 1;
      model.on("count", render);
      el.append(button);
    }
    """


ui.page_opts(title="Custom JSComponent", fillable=True)

with ui.card():
    ui.card_header("10 lines of ESM, two-way synced with Python")

    @render_panel
    def counter():
        return Counter()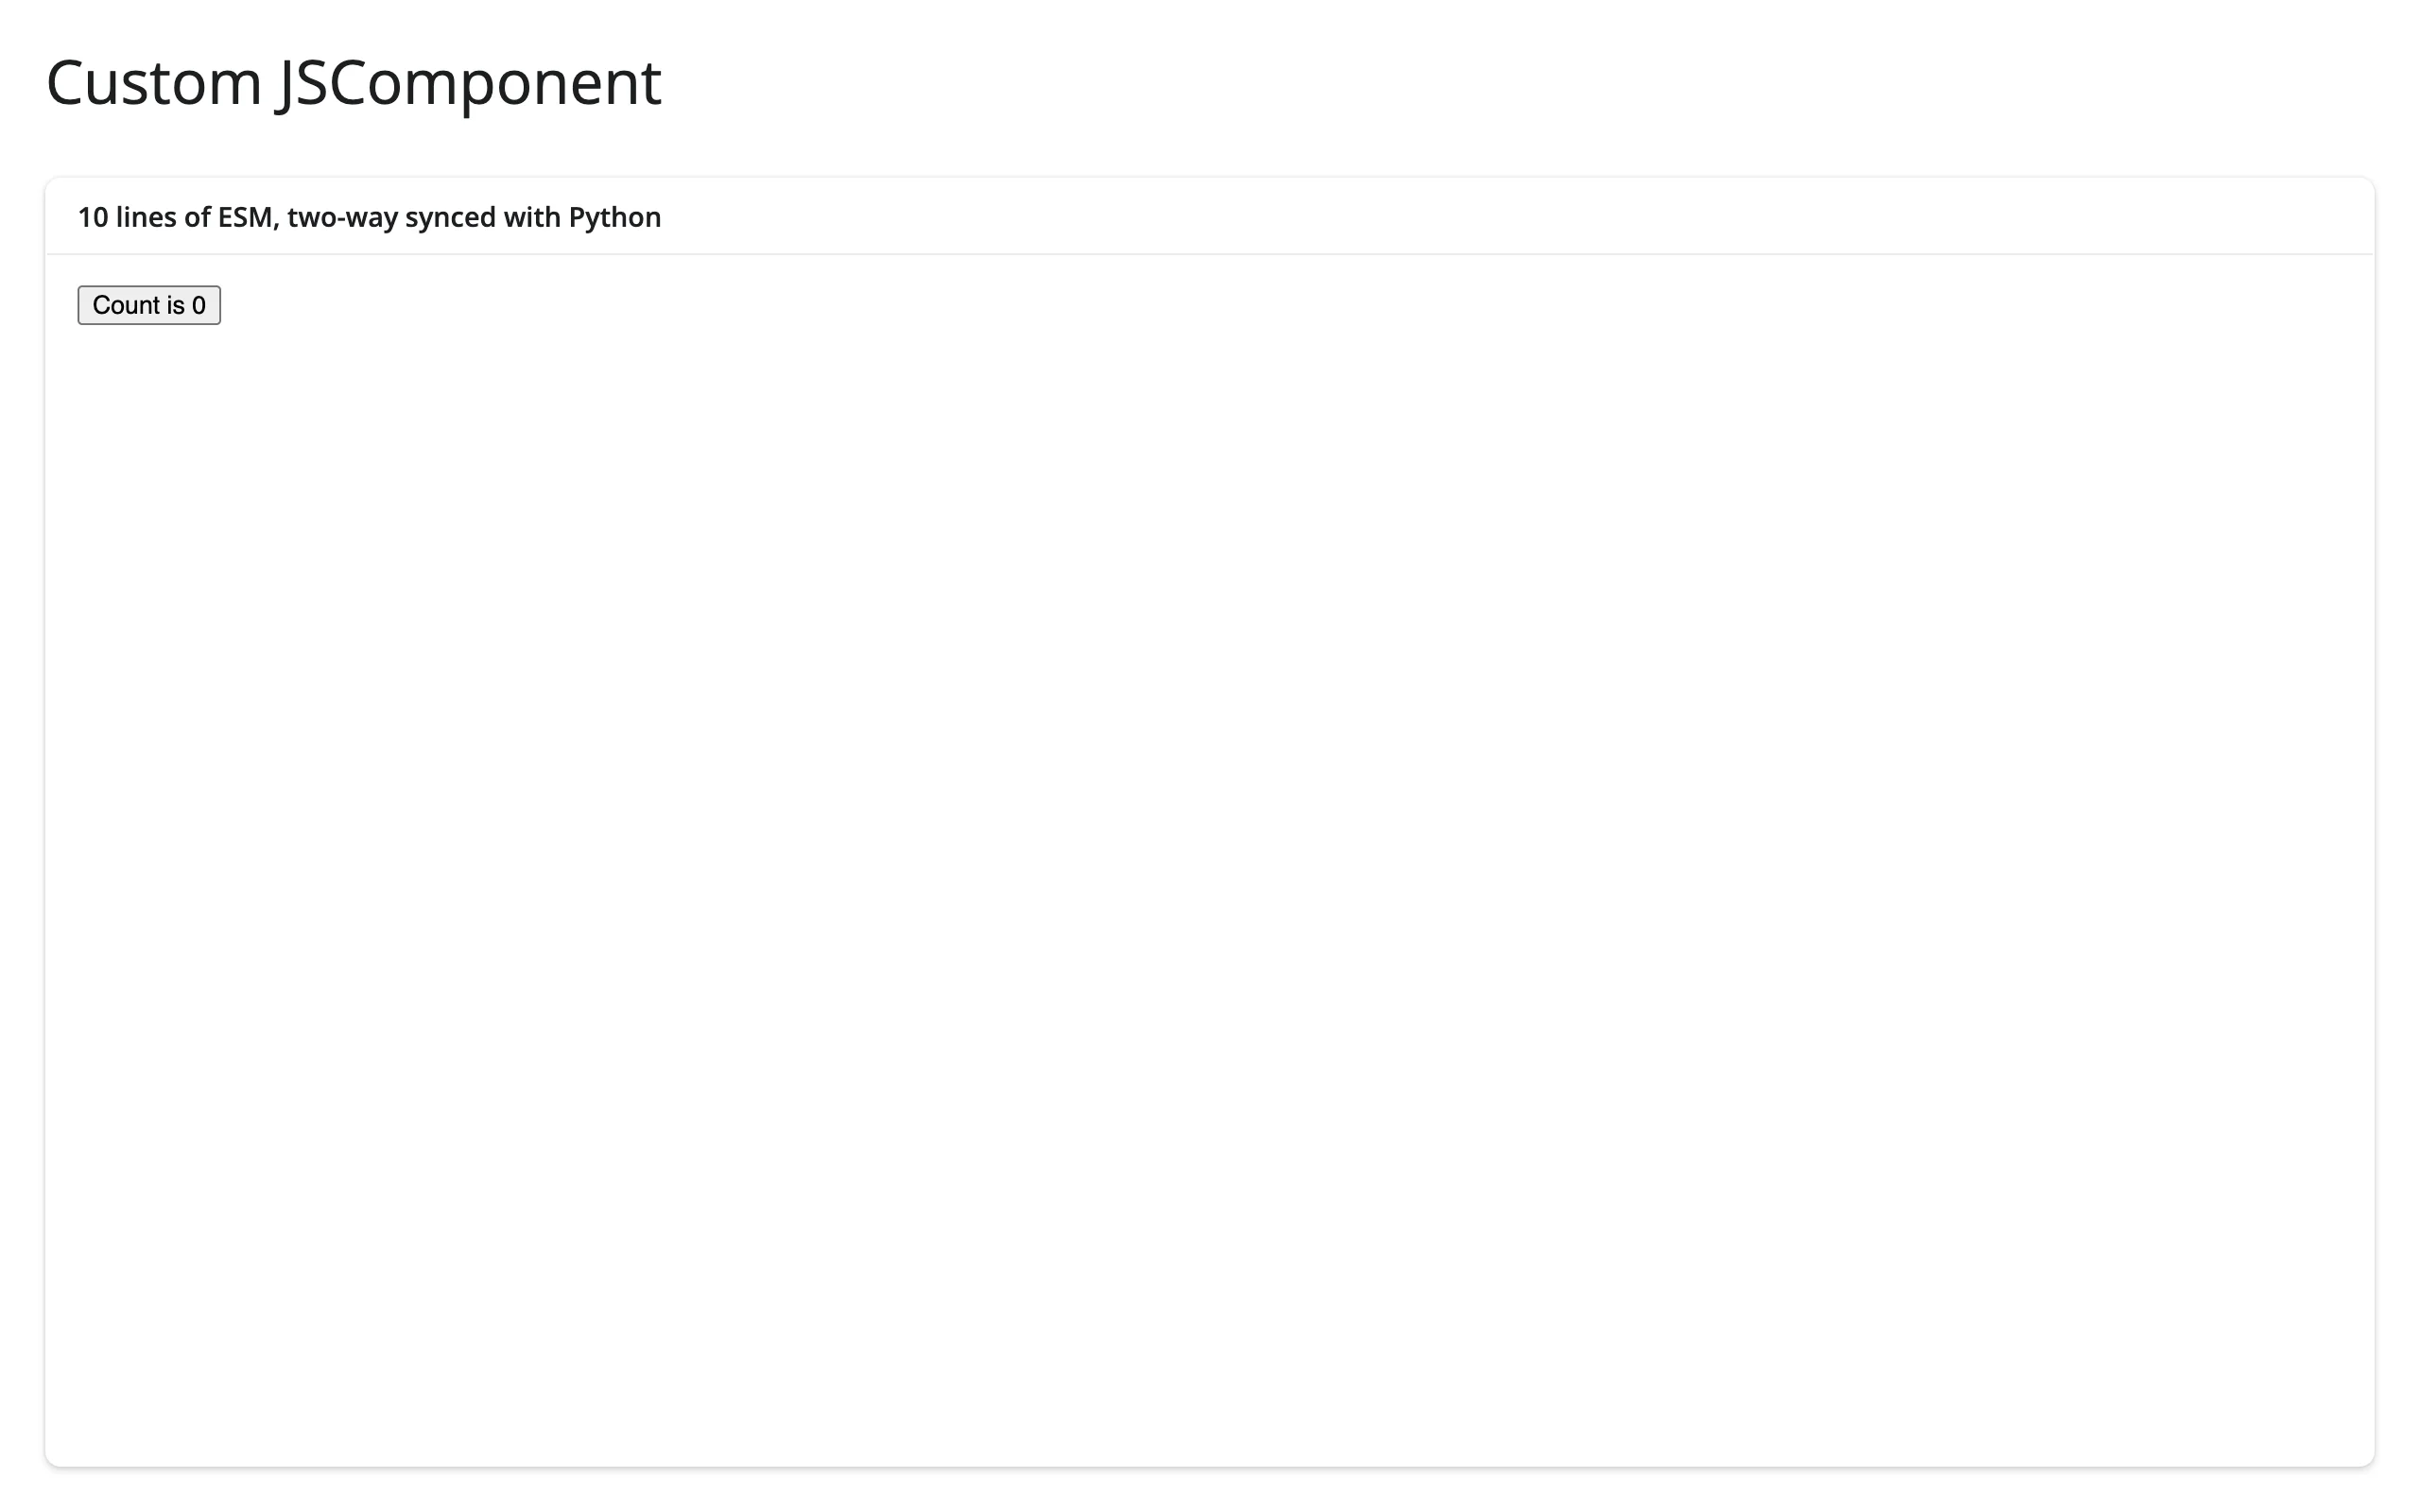
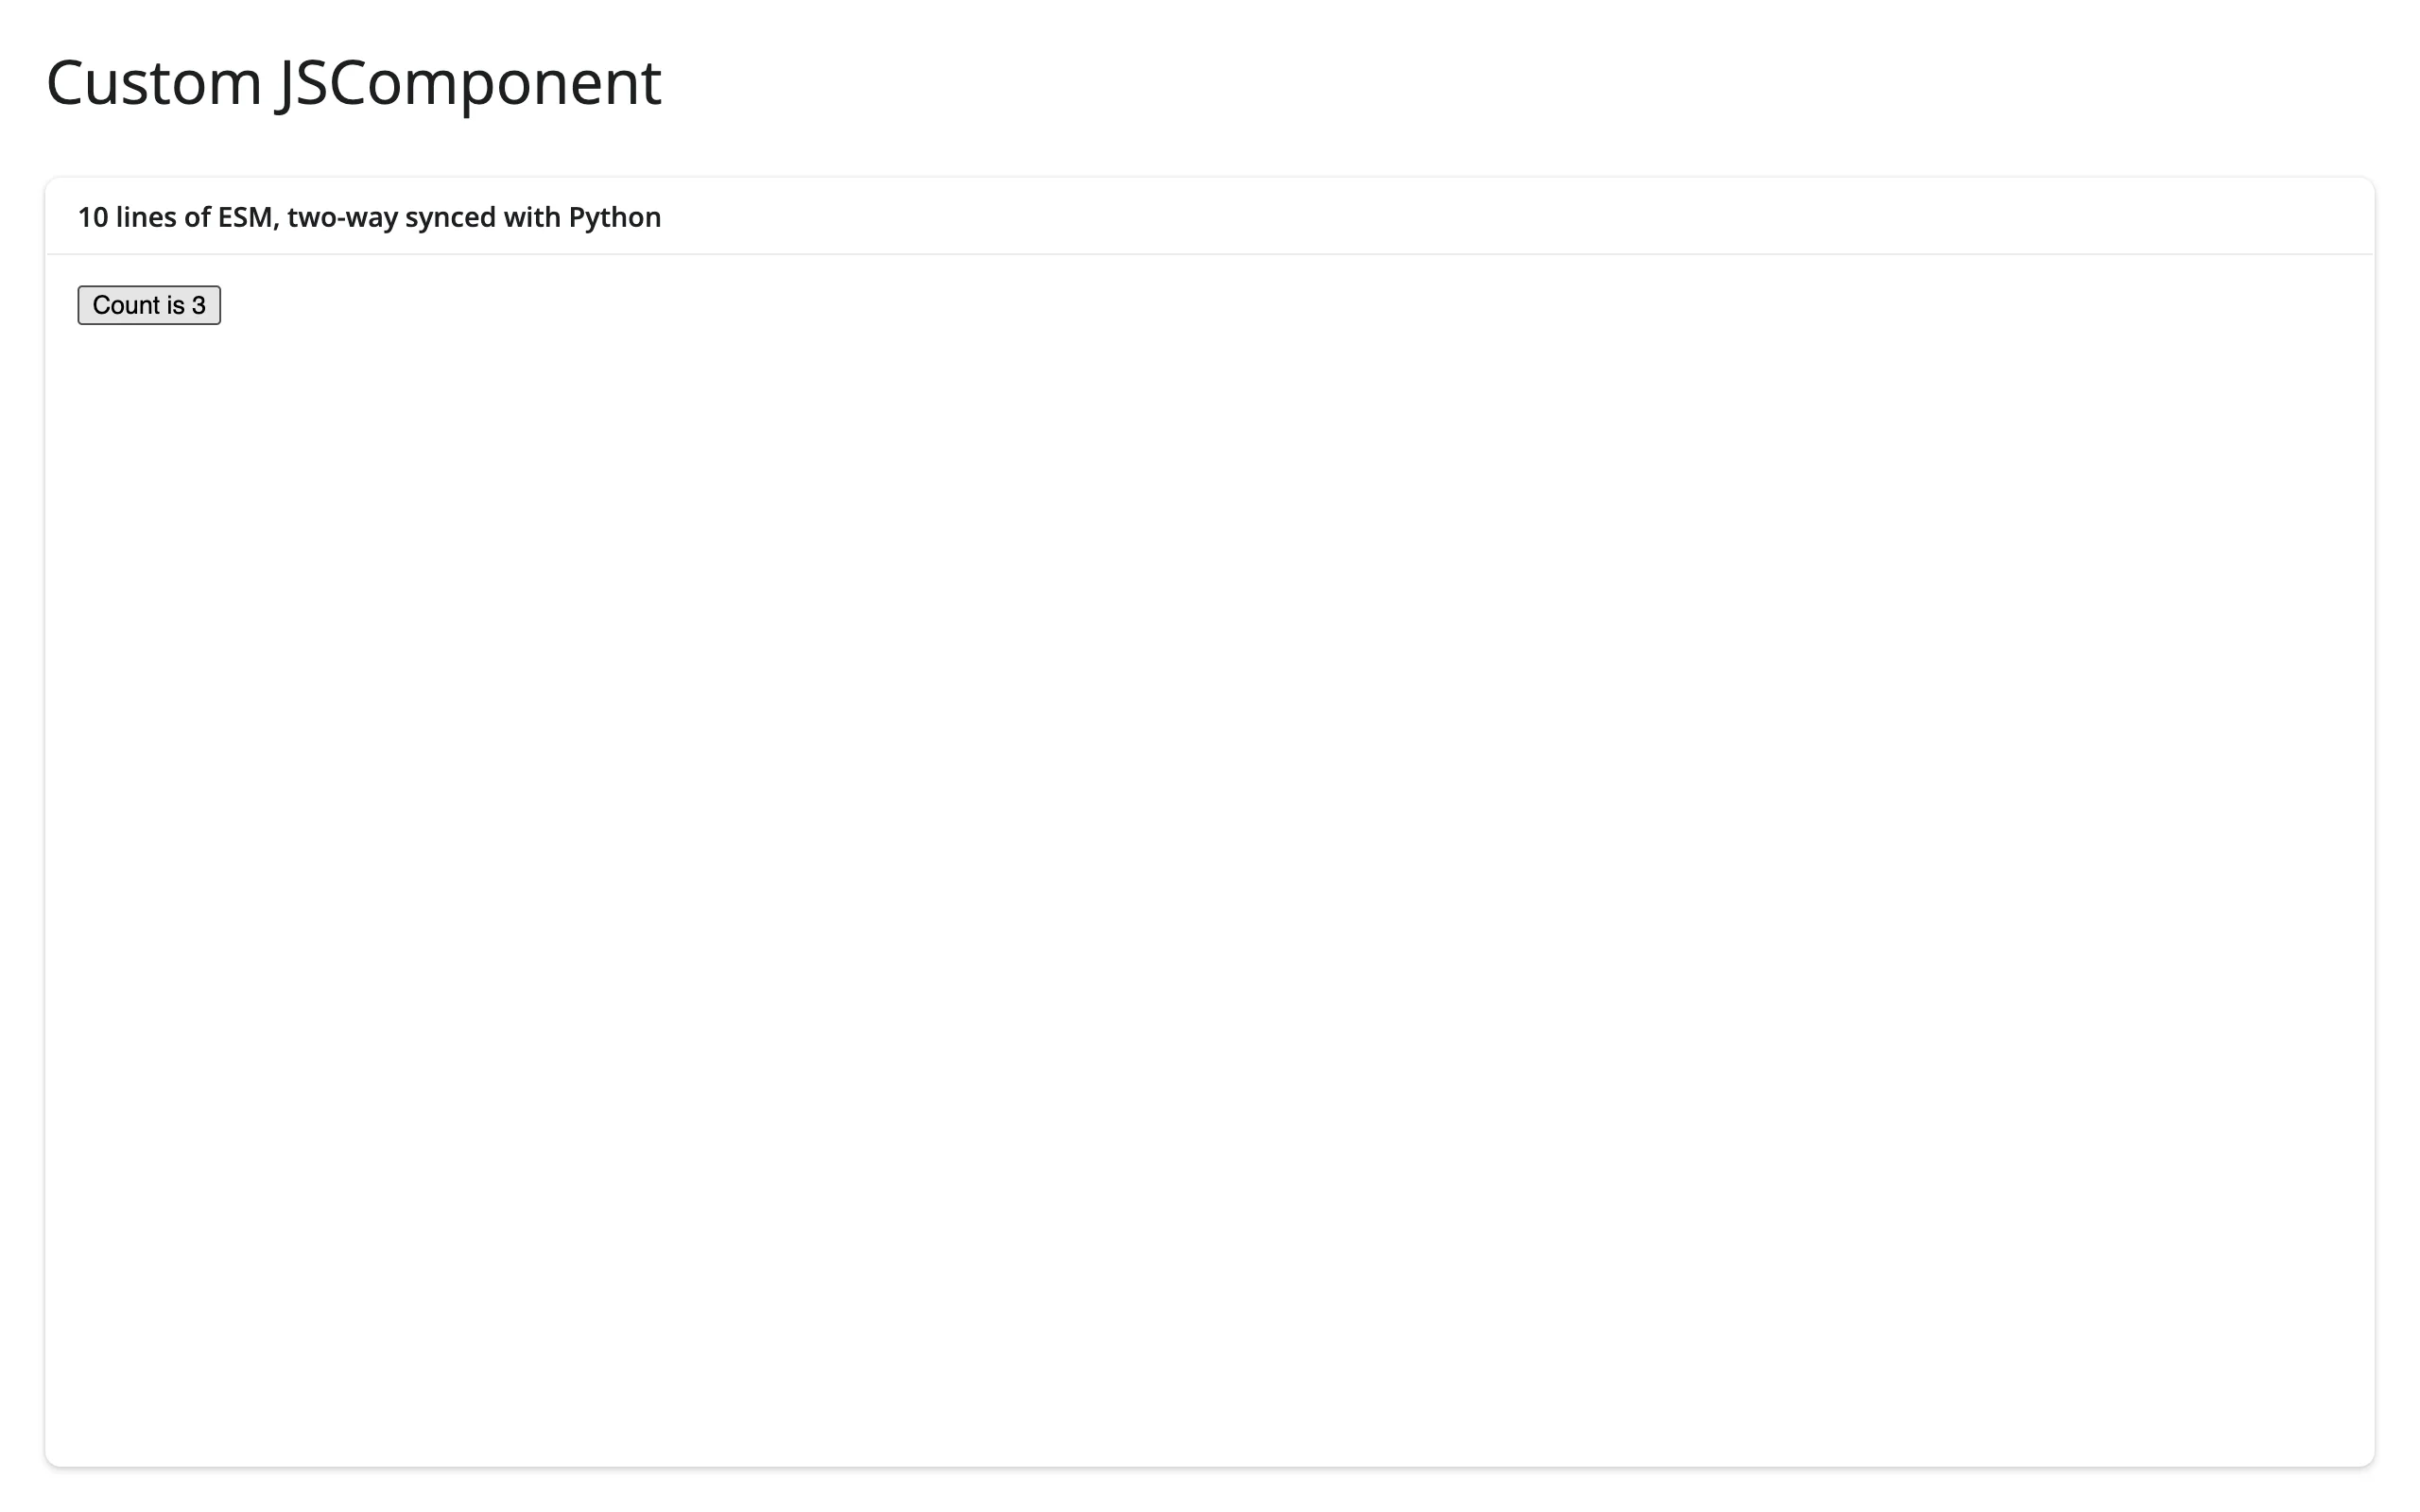
Three clicks took model.count from 0 to 3 – a real Playwright click, not a simulated event. JSComponent (and pn.viewable.Viewer) subclasses defined in your own app module now coerce correctly when returned directly; earlier shinywidgets releases required wrapping them in pn.Column(...) (see Gotchas).
Compose your own reusable component
pn.viewable.Viewer lets you package several widgets and some glue logic into one class with a single __panel__() method – a lightweight alternative to a Shiny module when the logic is Panel-only:
import panel as pn
import param
from shiny.express import ui
from shinywidgets import render_panel


class TemperatureConverter(pn.viewable.Viewer):
    """A reusable component: one widget, one computed display, no Shiny code."""

    celsius = param.Number(default=20, bounds=(-40, 120))

    def __panel__(self):
        slider = pn.widgets.FloatSlider.from_param(self.param.celsius, name="Celsius")
        fahrenheit = pn.bind(lambda c: f"**{c * 9 / 5 + 32:.1f} F**", self.param.celsius)
        return pn.Column(slider, pn.pane.Markdown(fahrenheit))


ui.page_opts(title="pn.viewable.Viewer", fillable=True)

with ui.card():
    ui.card_header("A Viewer bundles widgets + logic into one reusable component")

    @render_panel
    def converter():
        return TemperatureConverter()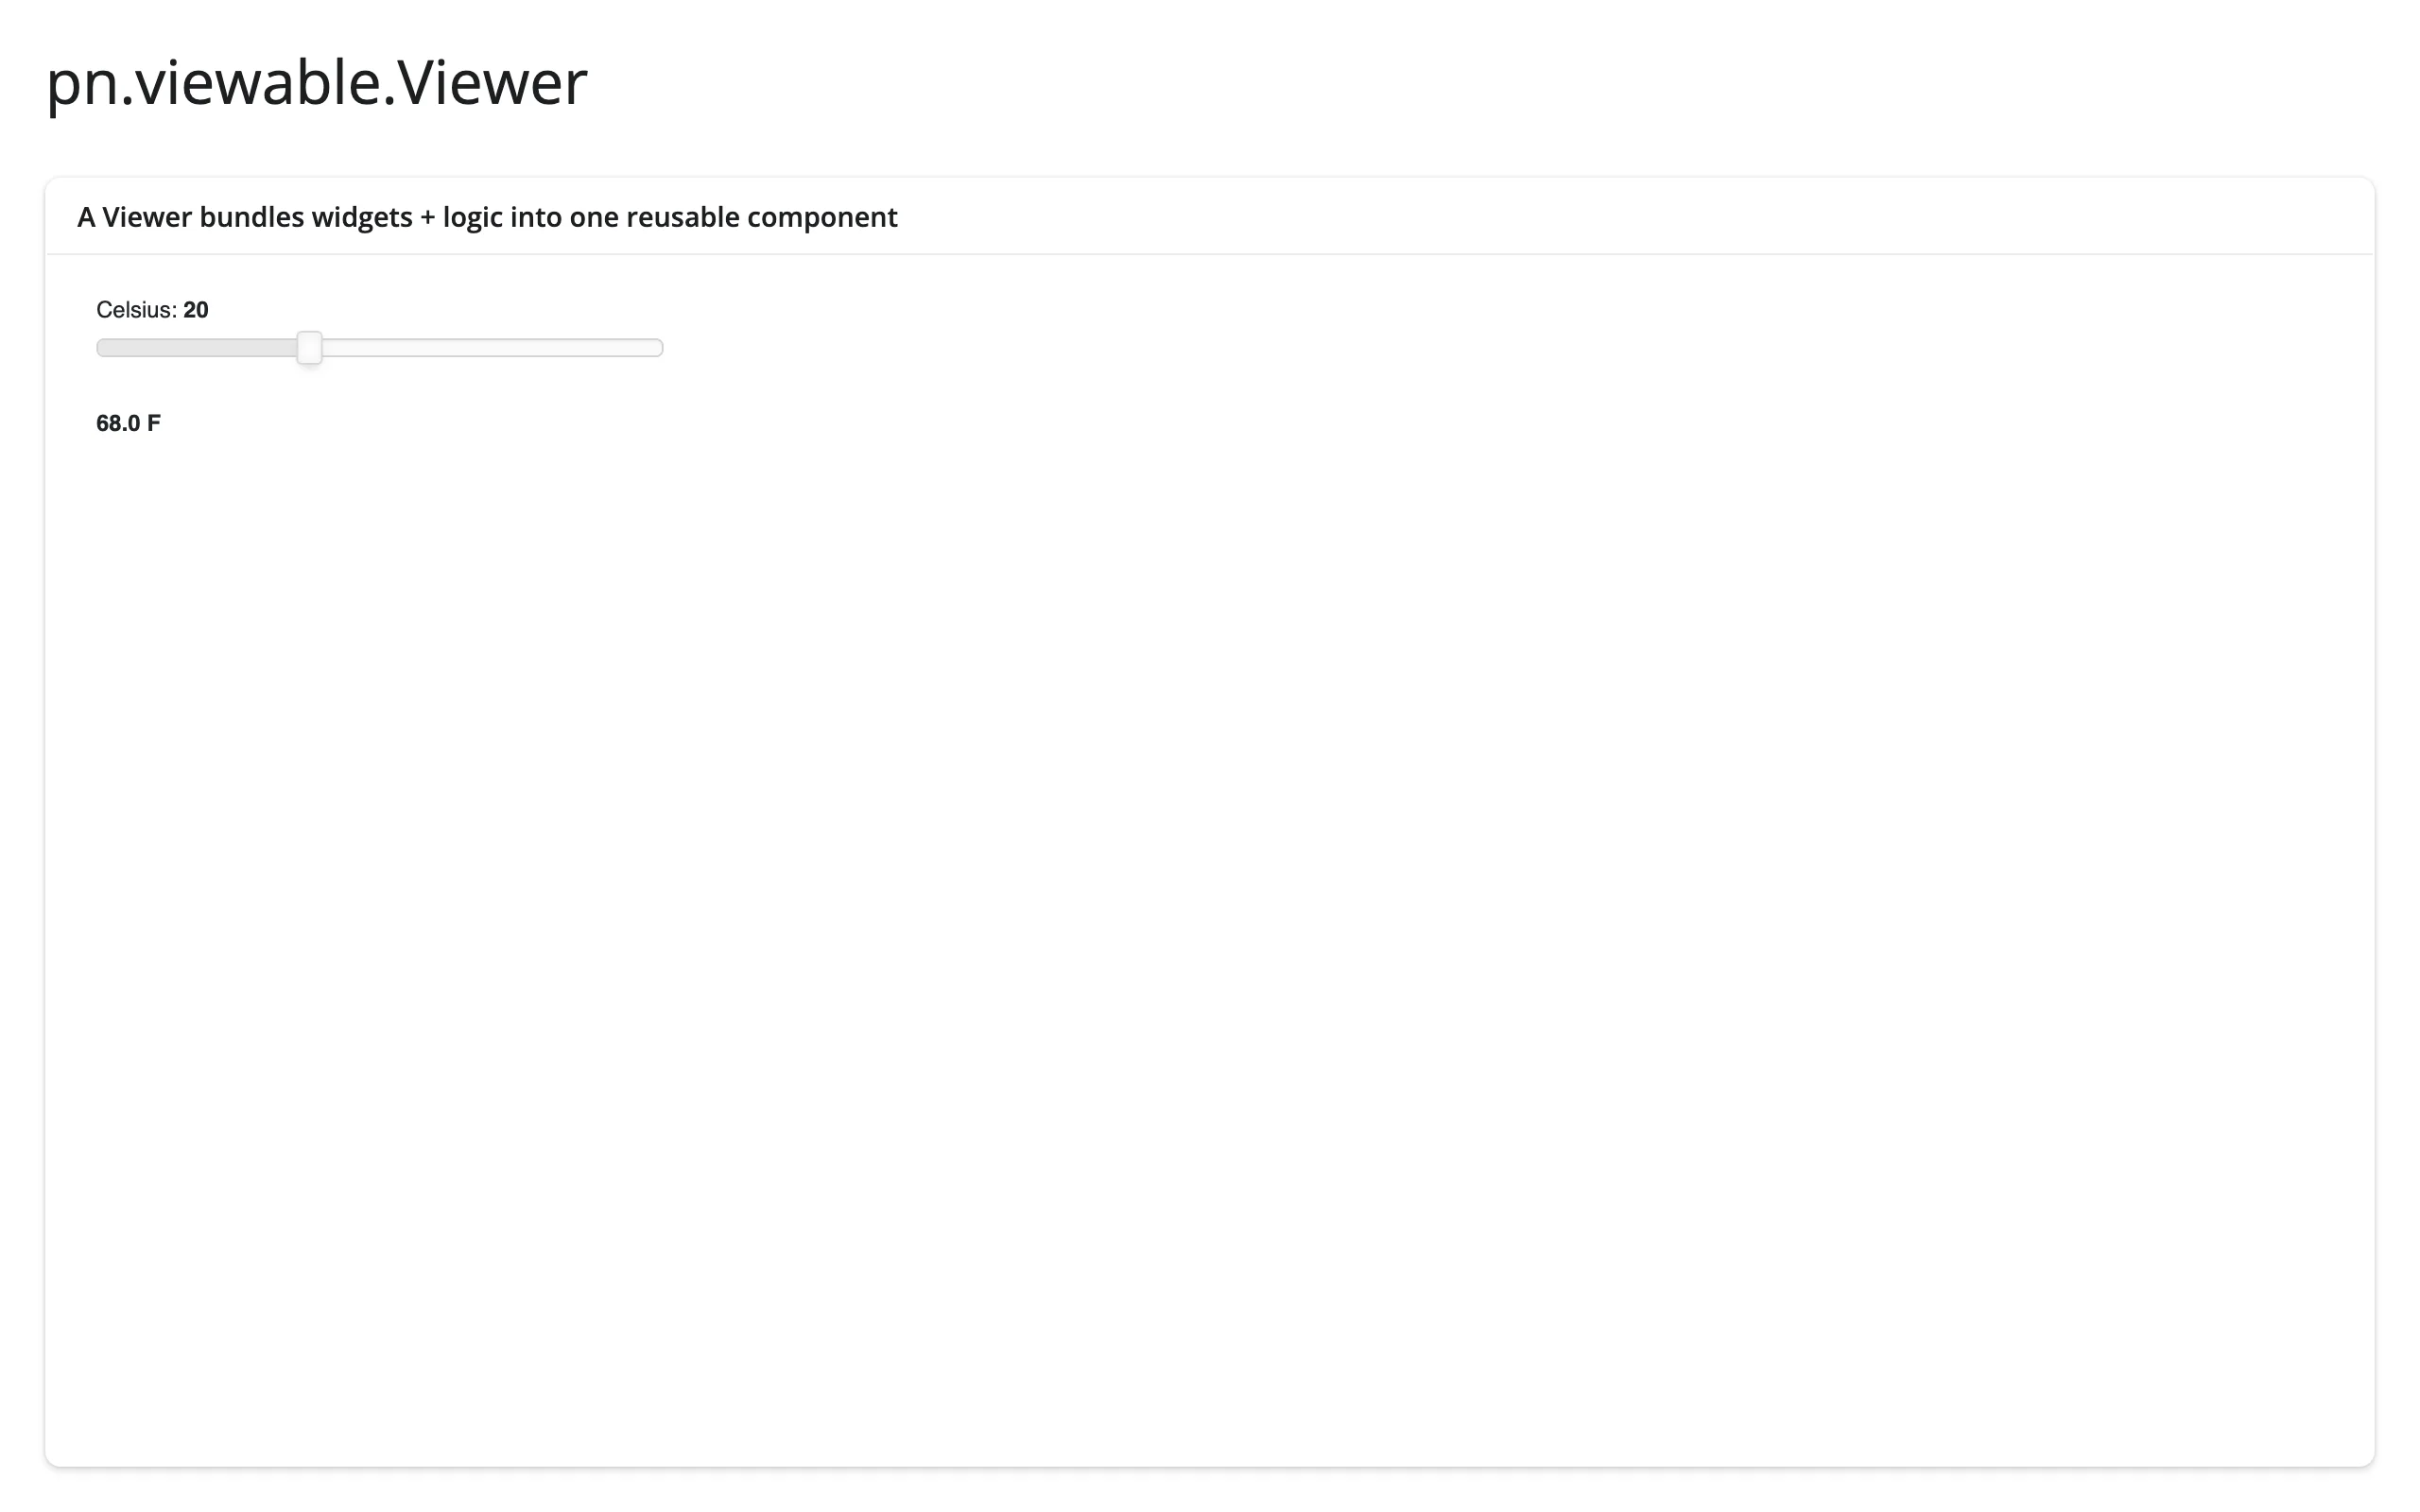
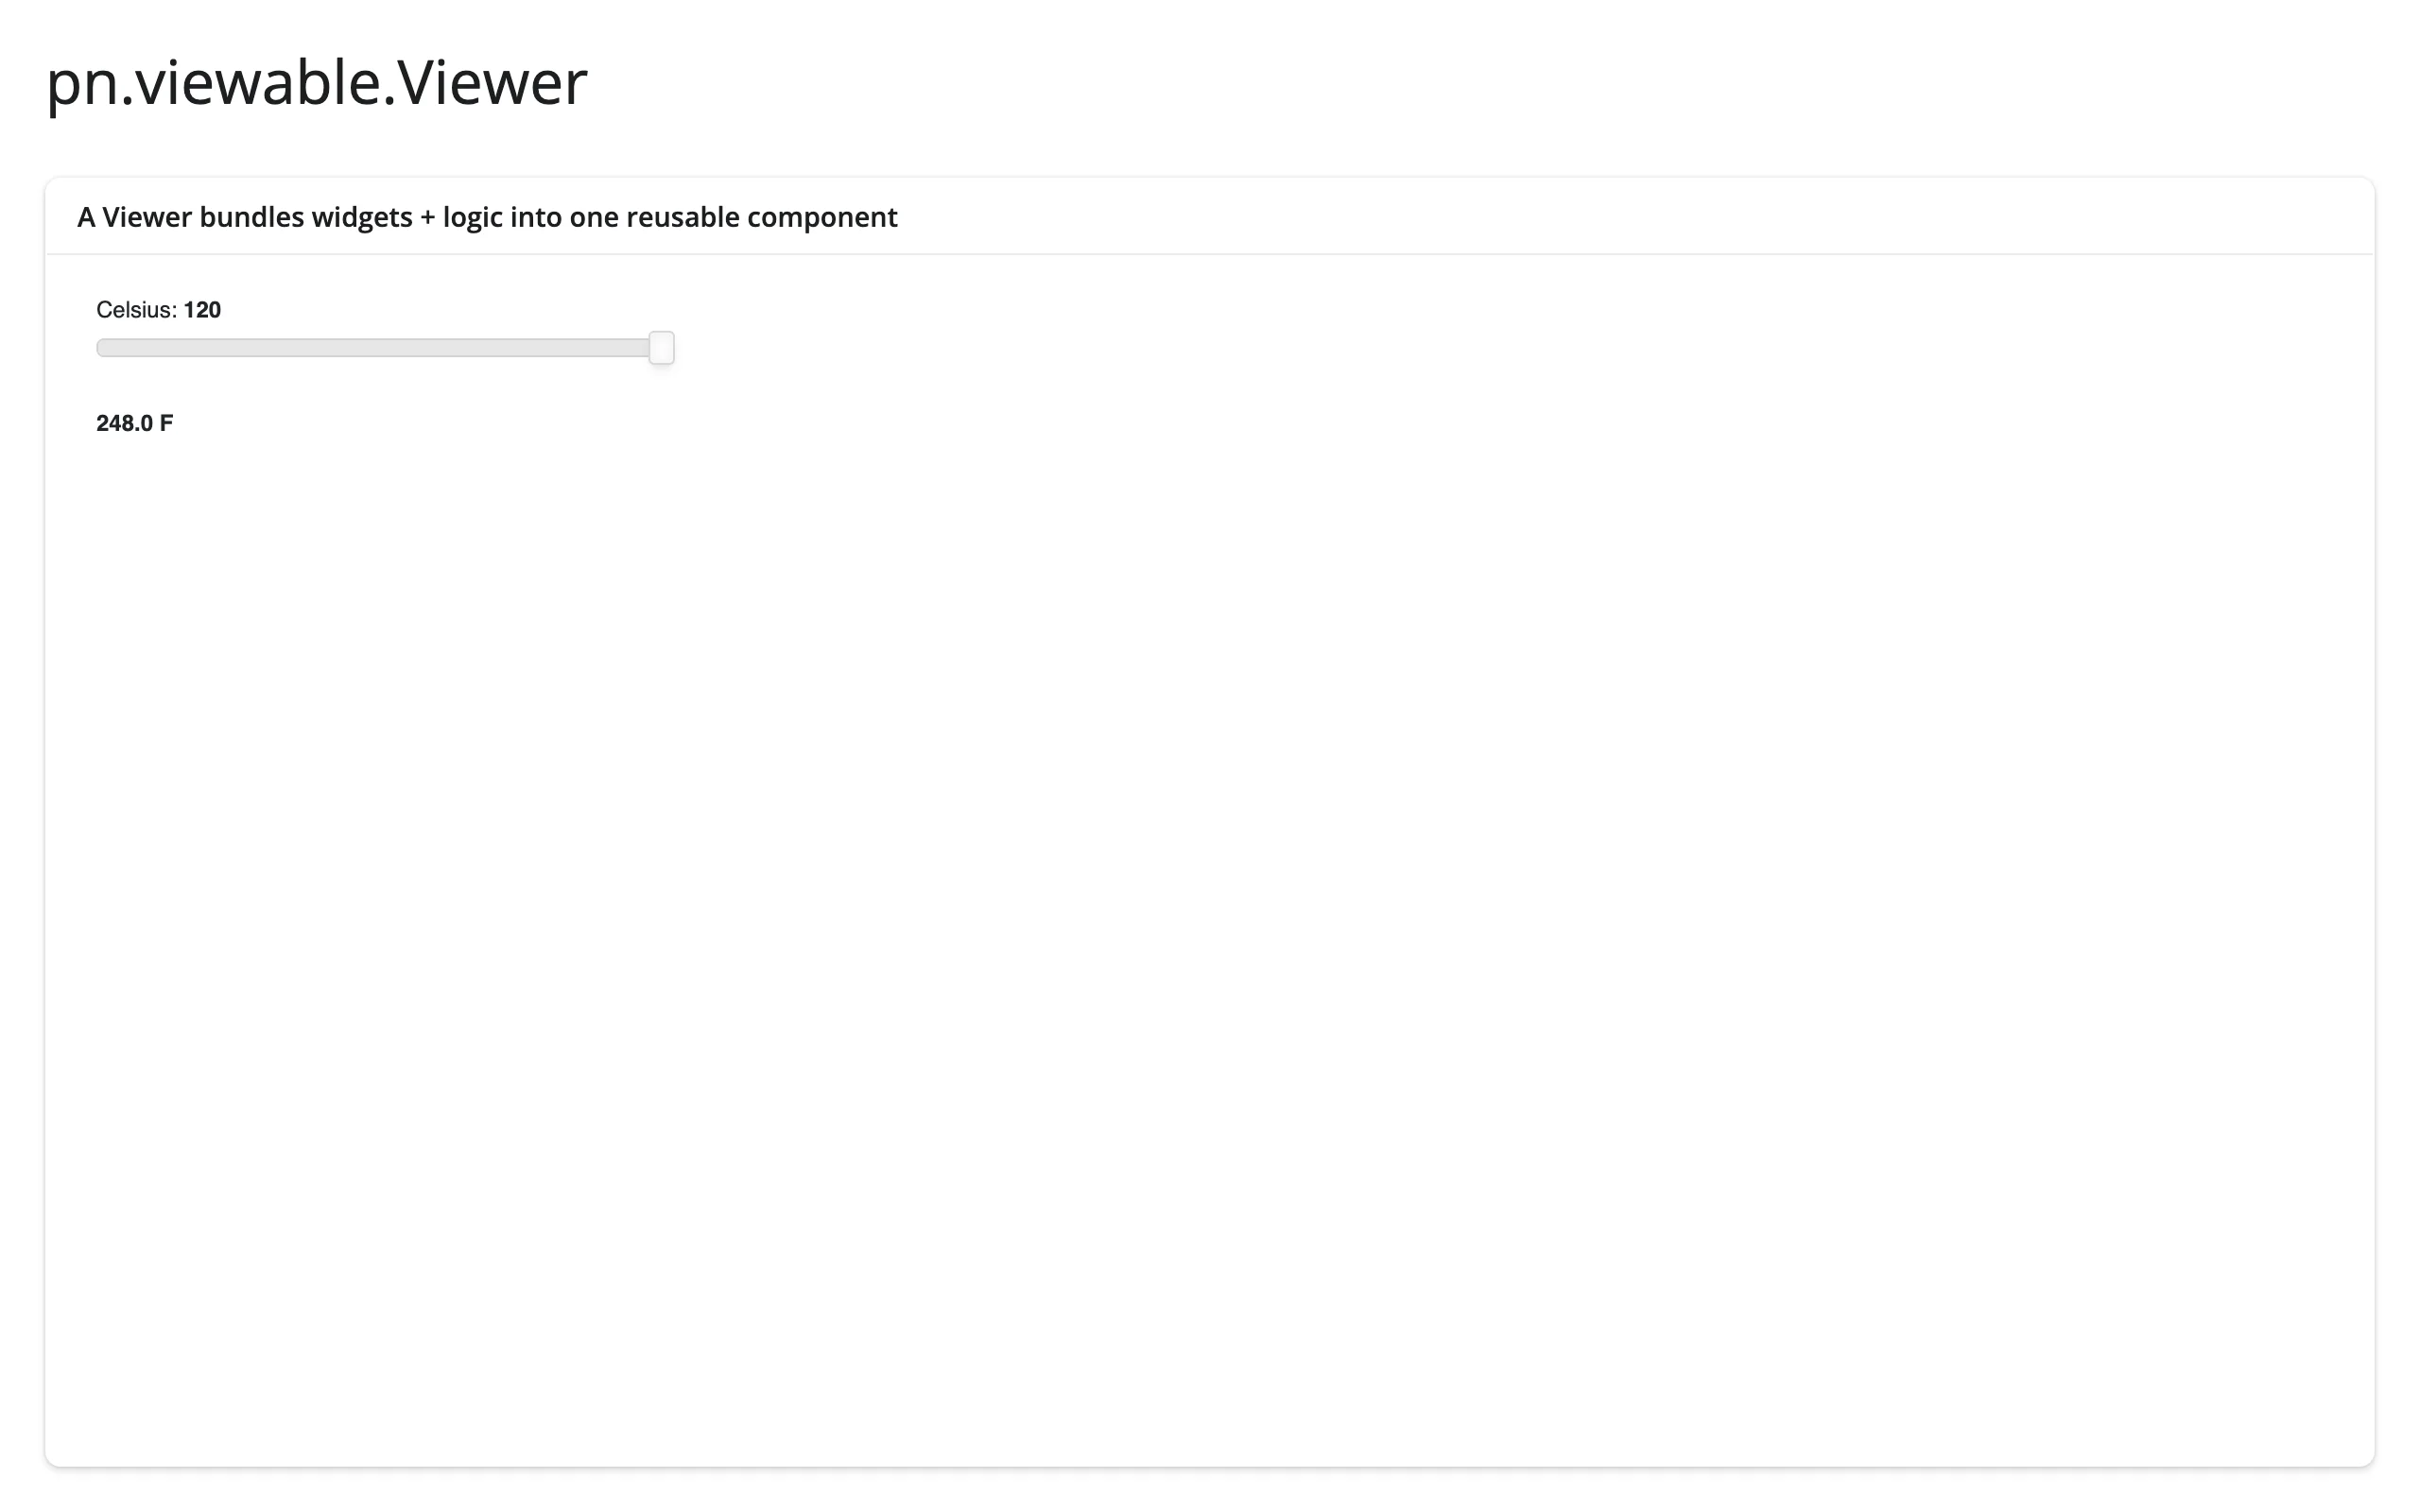
Dragging the slider to 120 C updated the Fahrenheit readout to 248.0 F entirely through Panel’s own pn.bind() – no Shiny code involved. render_panel.value is the live TemperatureConverter instance, so you can still reach into it from Shiny reactively with converter.param("celsius") (see Reacting to user interaction).
Reacting to user interaction
Accessor reference
| accessor | returns | before any interaction | across re-render | default rate policy |
|---|---|---|---|---|
param(name) |
the current value of the rendered object’s name parameter |
seeded value (the parameter’s value at render, not None) |
re-seeded (follows the new .value object) |
none – every change publishes immediately; read the parameter’s own throttled variant (e.g. value_throttled) if the library provides one |
param(name): read any Panel parameter like an input
Call param(name) in a reactive function and it re-runs whenever that parameter changes – from a browser gesture or from a plain Python assignment, both handled the same way. examples/07_param_accessor.py drives the same slider both ways:
import panel as pn
from shiny import reactive
from shiny.express import input, render, ui
from shinywidgets import render_panel

ui.page_opts(title="param(name): read a Panel parameter like an input", fillable=True)

with ui.layout_columns(col_widths=[6, 6]):
    with ui.card():
        ui.card_header("Drag the slider, or bump it from Python")
        ui.input_action_button("bump", "+2 from Python")

        @render_panel
        def slider():
            return pn.widgets.IntSlider(name="Quantity", value=5, start=0, end=20)

    with ui.card():
        ui.card_header("slider.param('value') -- reads both kinds of change")

        @render.text
        def value():
            return f"quantity = {slider.param('value')}"


@reactive.effect
@reactive.event(input.bump)
def _():
    slider.value.value += 2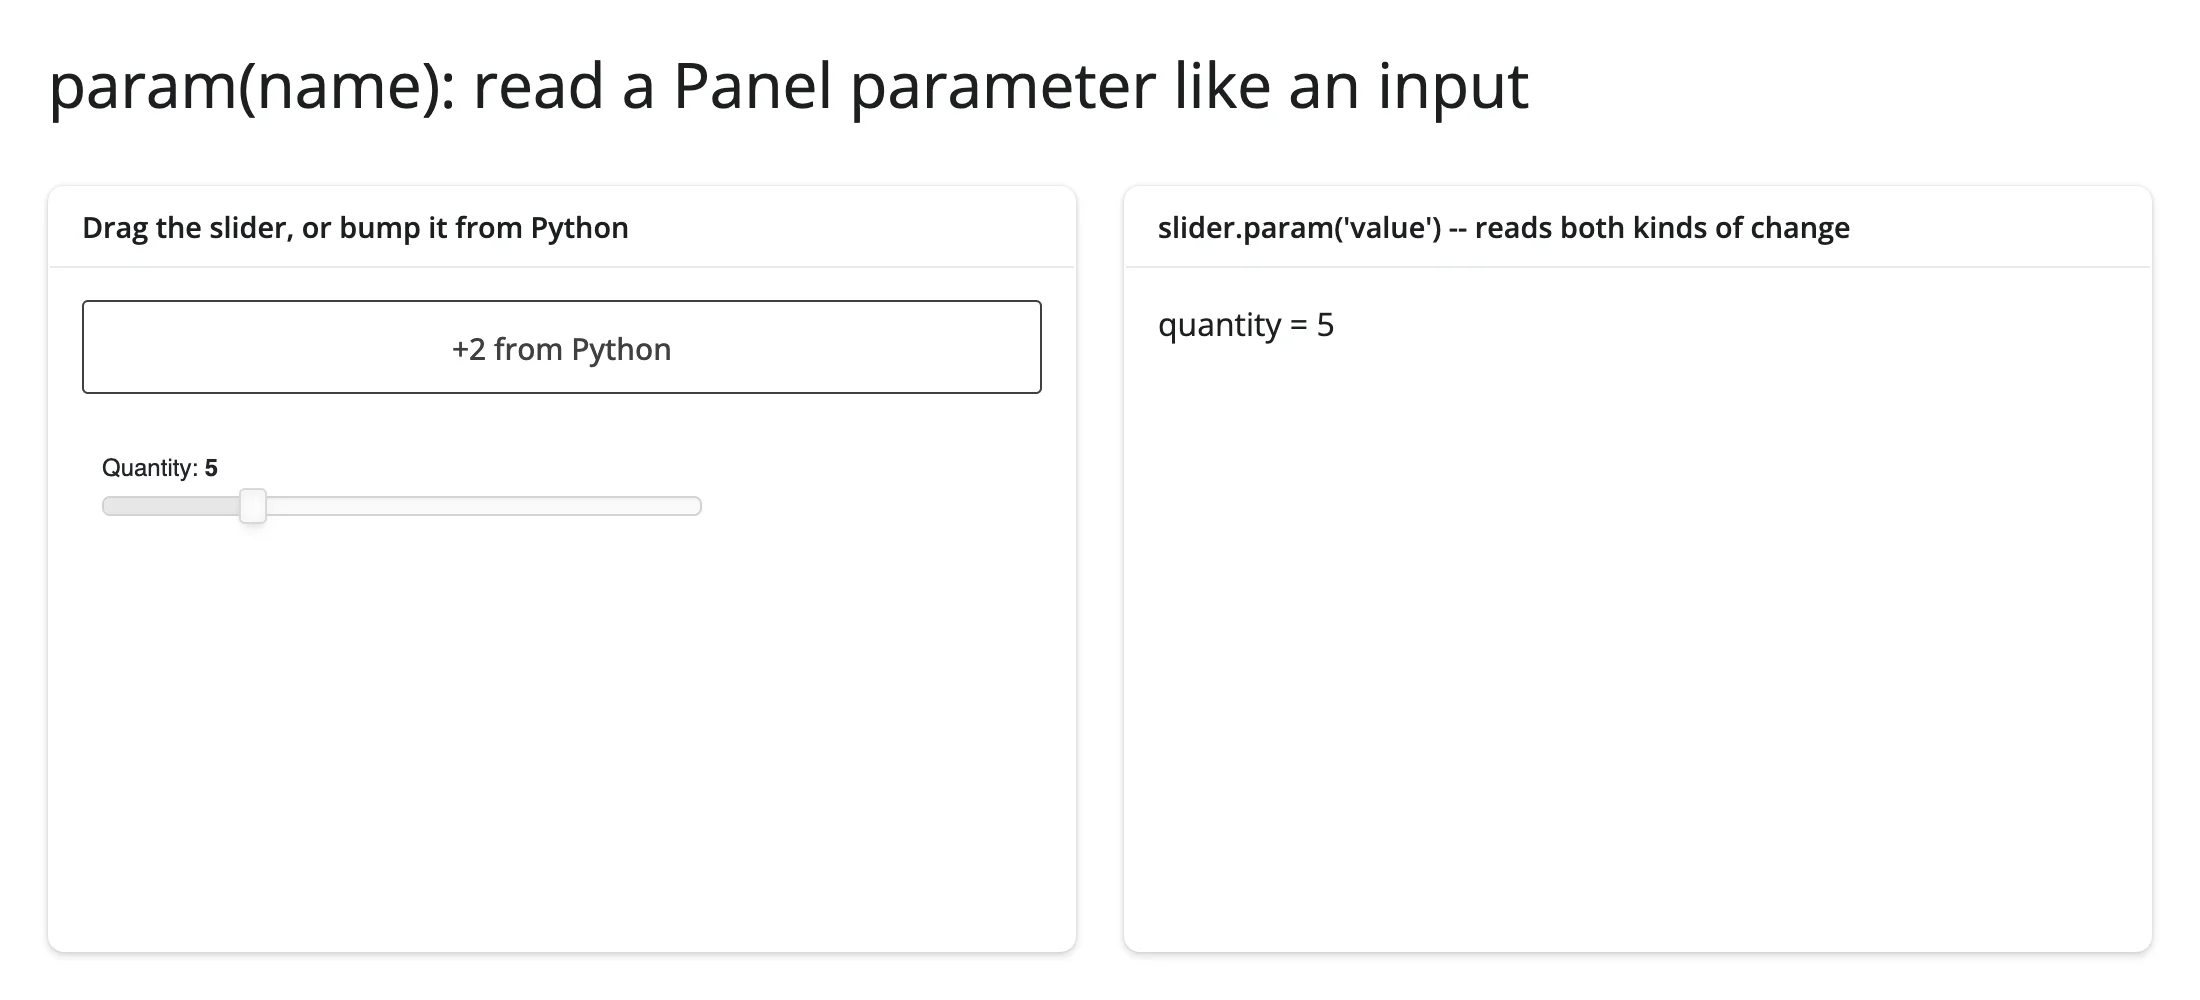
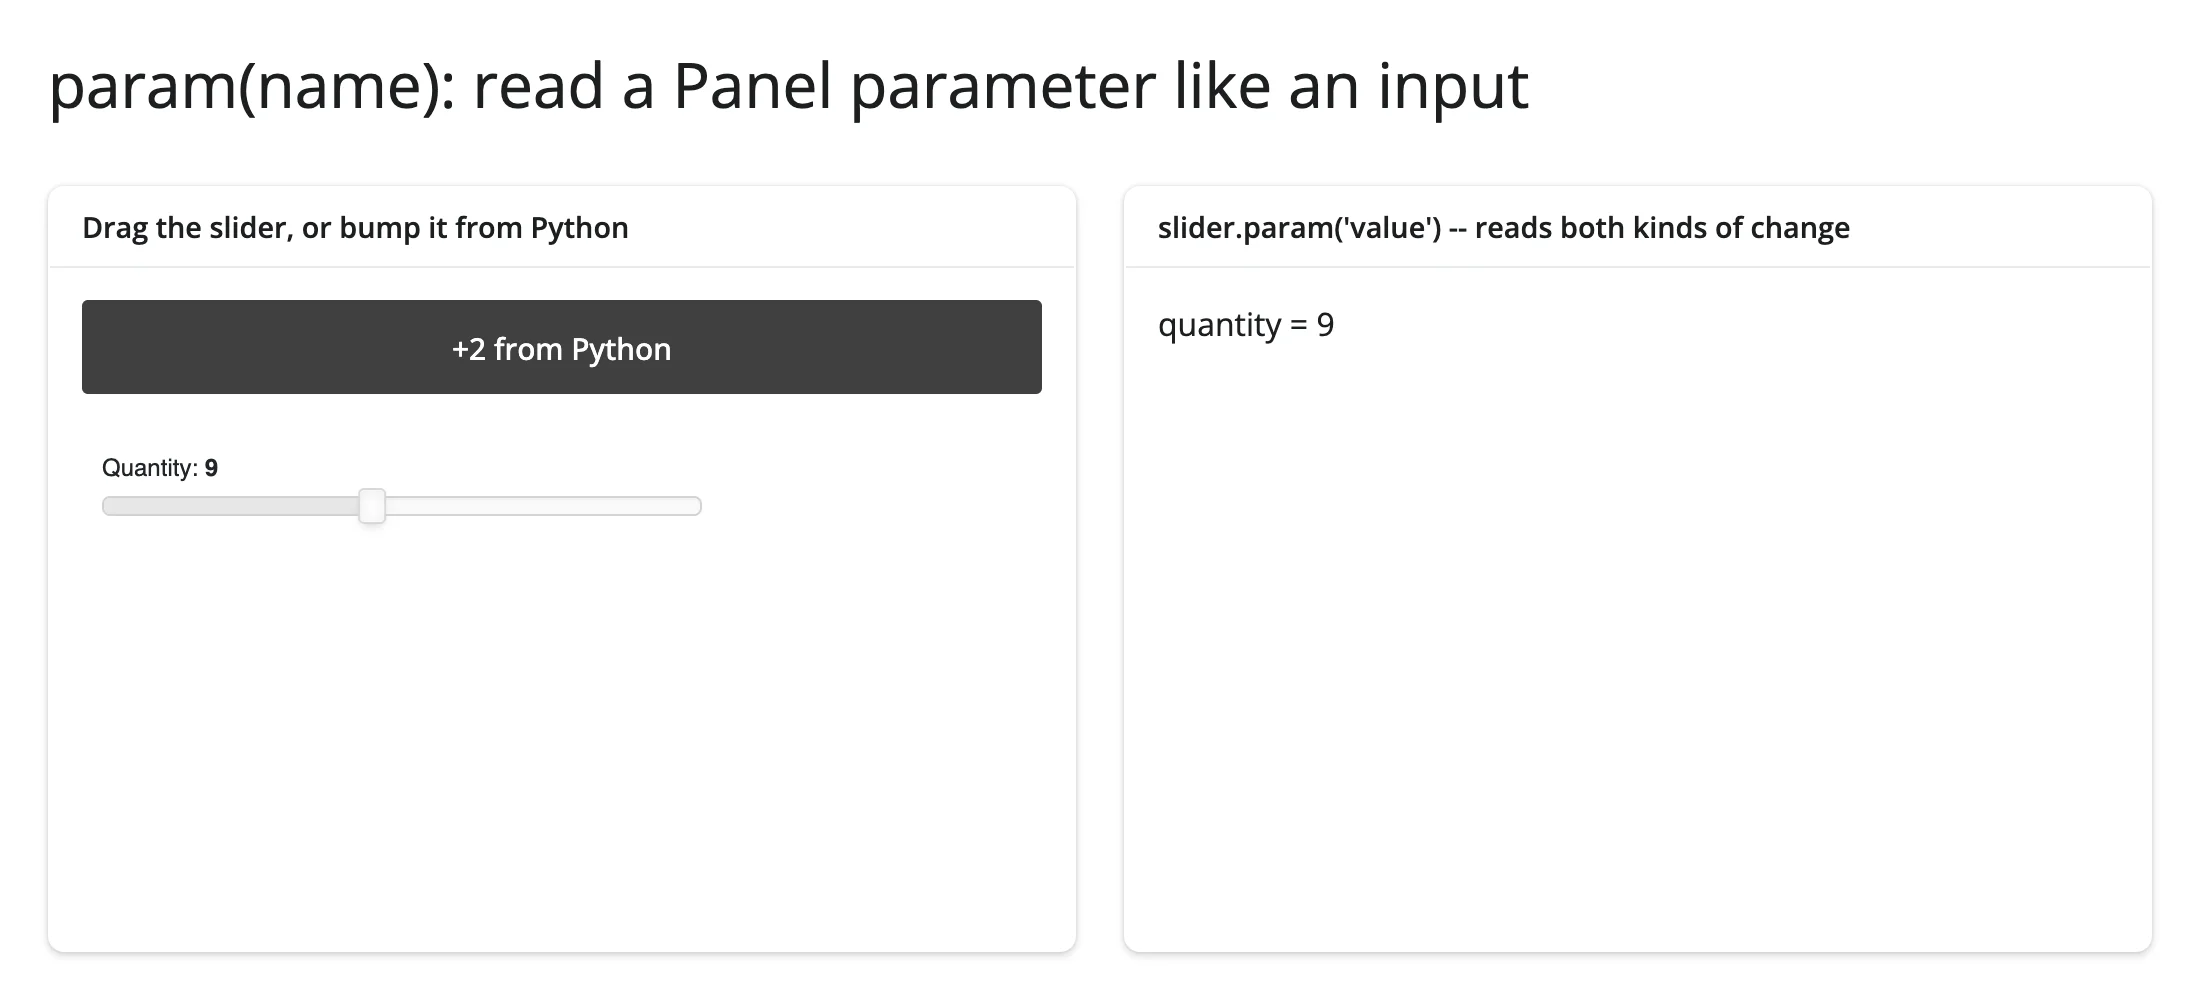
Two arrow-key steps in the browser took the readout from 5 to 7; one click of “+2 from Python” took it from 7 to 9 – the same accessor, the same readout, no branching code for which side changed. A few things to know:
- It’s seeded at render with the parameter’s current value, and re-seeded on every re-render, following the new
.valueobject – there’s noNoneto guard against before the first interaction, and no warm-up step needed before a reader can see a value. - It’s live from any reactive context, read at any time: a
@render.*function,@reactive.calc,@reactive.effect, a download handler, an LLM tool callback. You don’t need to have wired up a dedicated watcher ahead of time – any reader that callsslider.param("value")gets the current value and re-runs on the next change, the same as reading a Shiny input. - It raises if
.valueisn’t aparam.Parameterizedobject (e.g., the render function returned a raw DataFrame or string – “needs the rendered object to be a param.Parameterized”) or has no parameter by that name (“ExampleWidgethas no parameter ‘nope’ (its parameters are: …)”). - It can’t be read inside this output’s own render function, same restriction as every accessor – the render function builds a new object each time it runs, so there’s nothing stable to watch yet.
- In-place mutation of a mutable parameter (e.g., appending to a
param.List) needs an explicitobj.param.trigger(name)afterwards, same as Panel itself requires –param’s own change detection only catches reassignment, not mutation. - To throttle a continuously-changing parameter (a dragged slider firing on every pixel), read Panel’s own throttled variant instead of adding rate limiting yourself:
slider.param("value_throttled")for anIntSlider/FloatSlider.
When param(name) can’t reach it: a nested widget
param(name) only looks at parameters on the object you returned directly (render_panel.value) – not at anything nested inside it. Wrap a widget in a layout and the picture changes: examples/08_param_watch_nested.py returns a pn.Row(slider, button), so controls.param("value") raises (Row has no parameter 'value' – pn.Row is a layout, not a slider). Watch the nested widget directly instead, the same .param.watch() call Panel itself uses internally:
import panel as pn
from shiny import reactive
from shiny.express import render, ui
from shinywidgets import render_panel

ui.page_opts(title="A nested widget: param(name) can't reach it", fillable=True)

quantity = reactive.value(10)

with ui.layout_columns(col_widths=[6, 6]):
    with ui.card():
        ui.card_header("A slider + reset button, returned as one pn.Row")

        @render_panel
        def controls():
            slider = pn.widgets.IntSlider(name="Quantity", value=10, start=0, end=100)
            reset = pn.widgets.Button(name="Reset to 10")
            # controls.param("value") can't reach the slider: the rendered
            # object is the Row, which has no "value" of its own. Watch the
            # nested widget directly instead.
            slider.param.watch(lambda e: quantity.set(e.new), "value")
            reset.on_click(lambda _: setattr(slider, "value", 10))
            return pn.Row(slider, reset)

    with ui.card():
        ui.card_header("quantity (a Shiny reactive.value, set by the watcher)")

        @render.text
        def readout():
            return f"quantity = {quantity()}"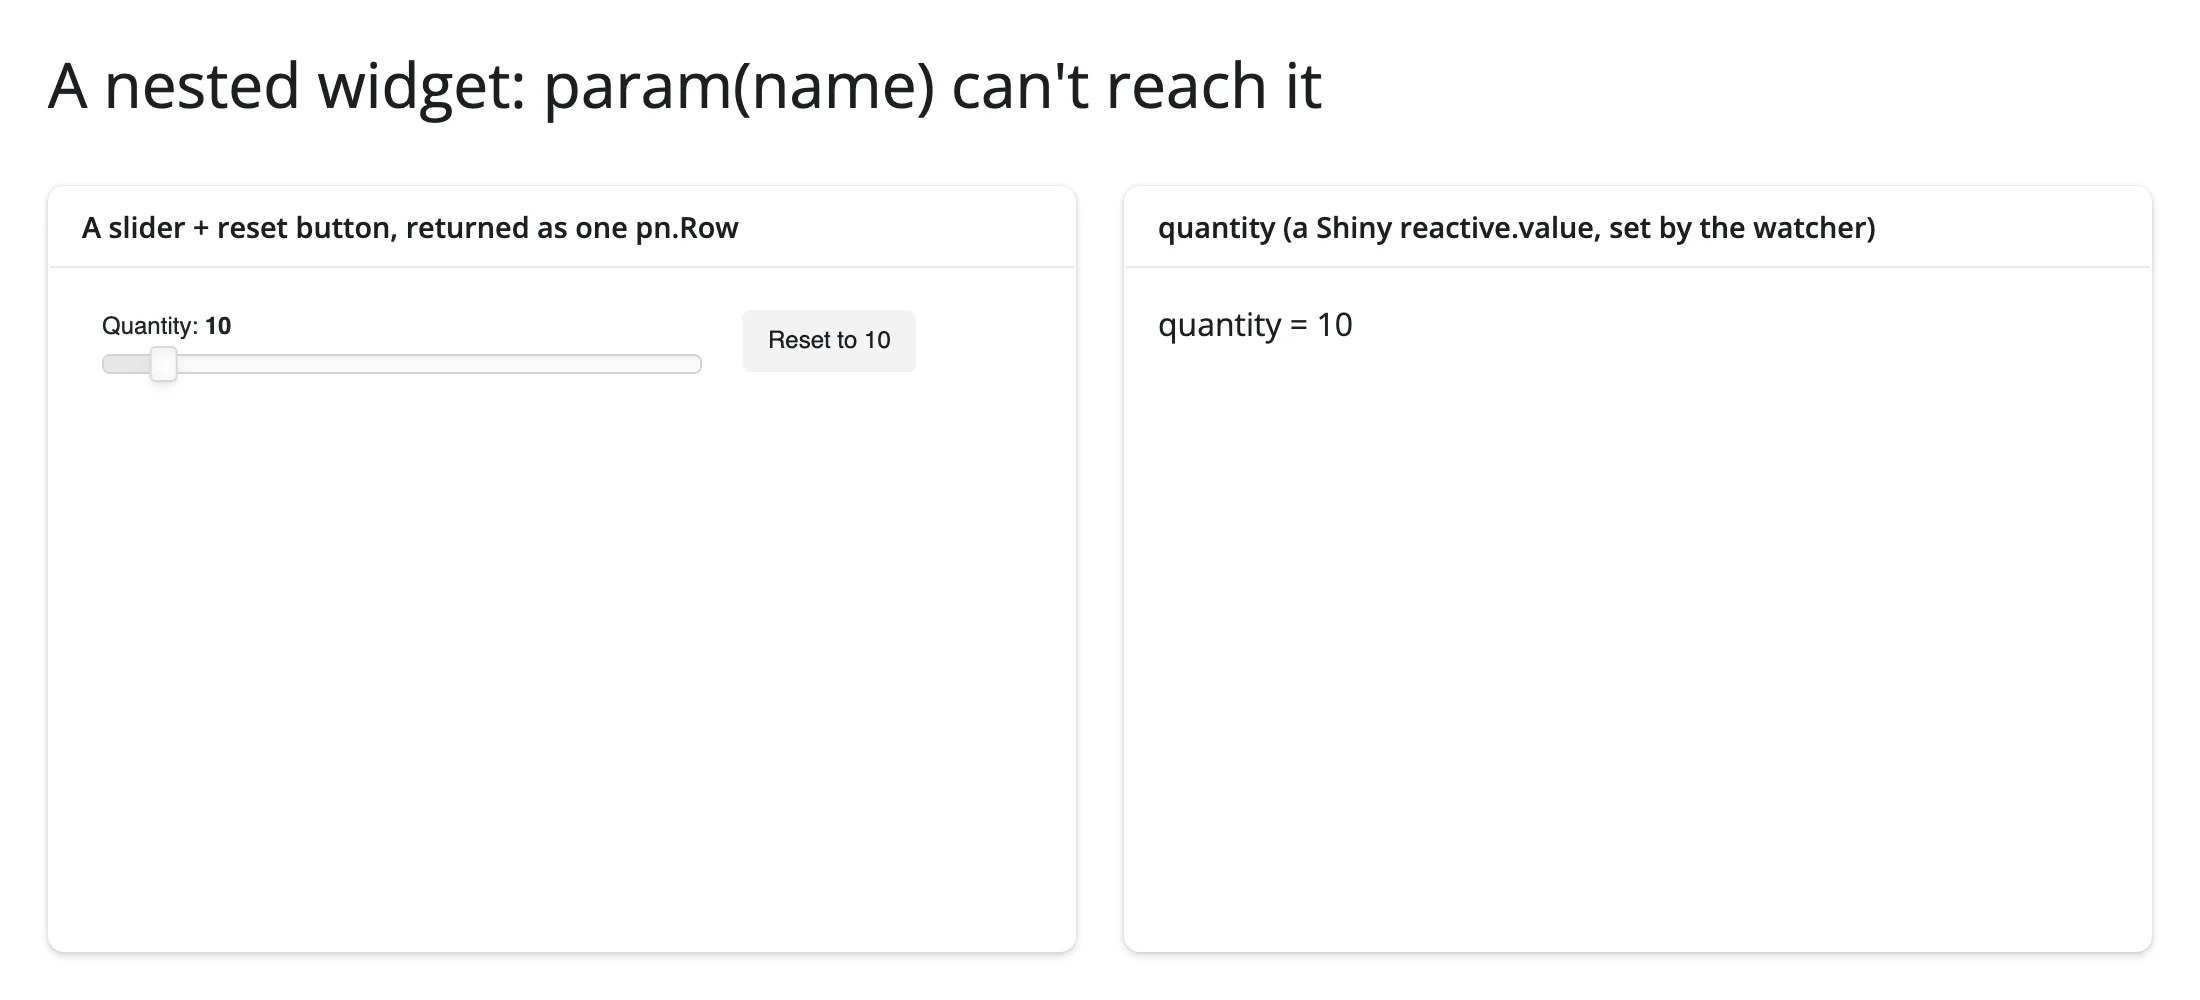
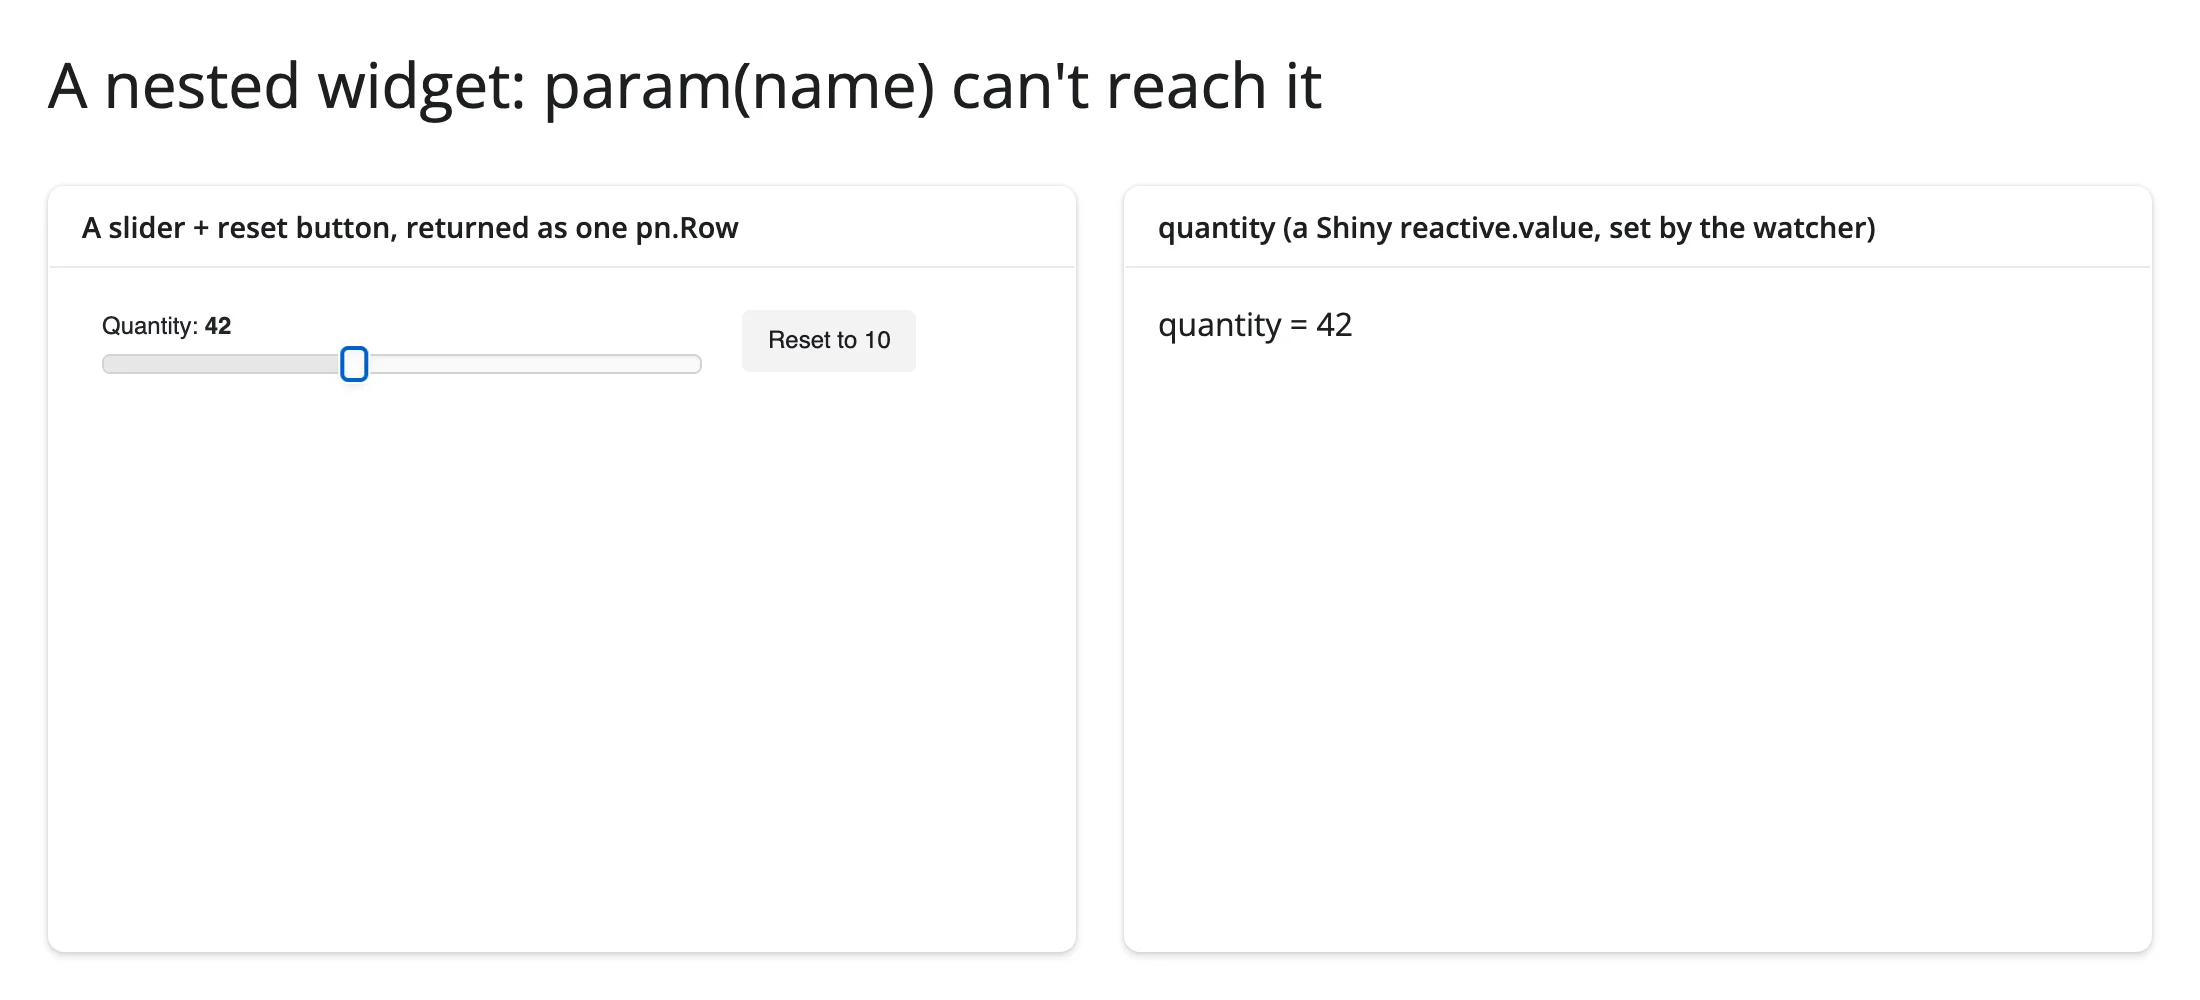
Dragging the slider to 42, then clicking “Reset to 10”, both came through the watcher into quantity. This is the one place in this guide where the pre-param(name) pattern – a Panel watcher feeding a reactive.value – is still the right tool, specifically because the state you want lives on an object one level below the one render_panel tracks.
Beyond param(): reactive_read() and .read()
reactive_read() is built for ipywidget traits (it calls .has_trait() and .observe()); a Panel object has neither – reactive_read(table.value, "selection") raises AttributeError: 'Tabulator' object has no attribute 'has_trait', verified directly on current main. render_panel also gets the generic .read(name) every renderer has, but it isn’t useful here: .read(name) falls through to reactive_read() on .widget, the internal jupyter_bokeh.BokehModel, whose handful of traits don’t reflect anything happening in the Panel object (see Gotchas) – and it doesn’t reach param(name) either, since a dynamically-named accessor like param("value") is stored internally as "param:value", not "value" (verified: table.read("value") raises AttributeError, with a “did you mean ‘param:value’?” hint that isn’t itself a valid call). Always call .param(name) directly.
Rate limiting
render_panel(rate_policy=..., rate_delay=...) exist on the decorator (inherited from the same base class every render_* decorator shares) but have nothing to act on: param(name)’s default rate policy is fixed at “none” regardless of these kwargs (verified by reading shinywidgets/_panel.py’s dynamic_accessor_spec(), which doesn’t set rate_policy). Use the parameter’s own throttled variant where the library provides one (see above), or a plain time-based guard in a manual .param.watch() callback for anything else.
Updating the widget from Python
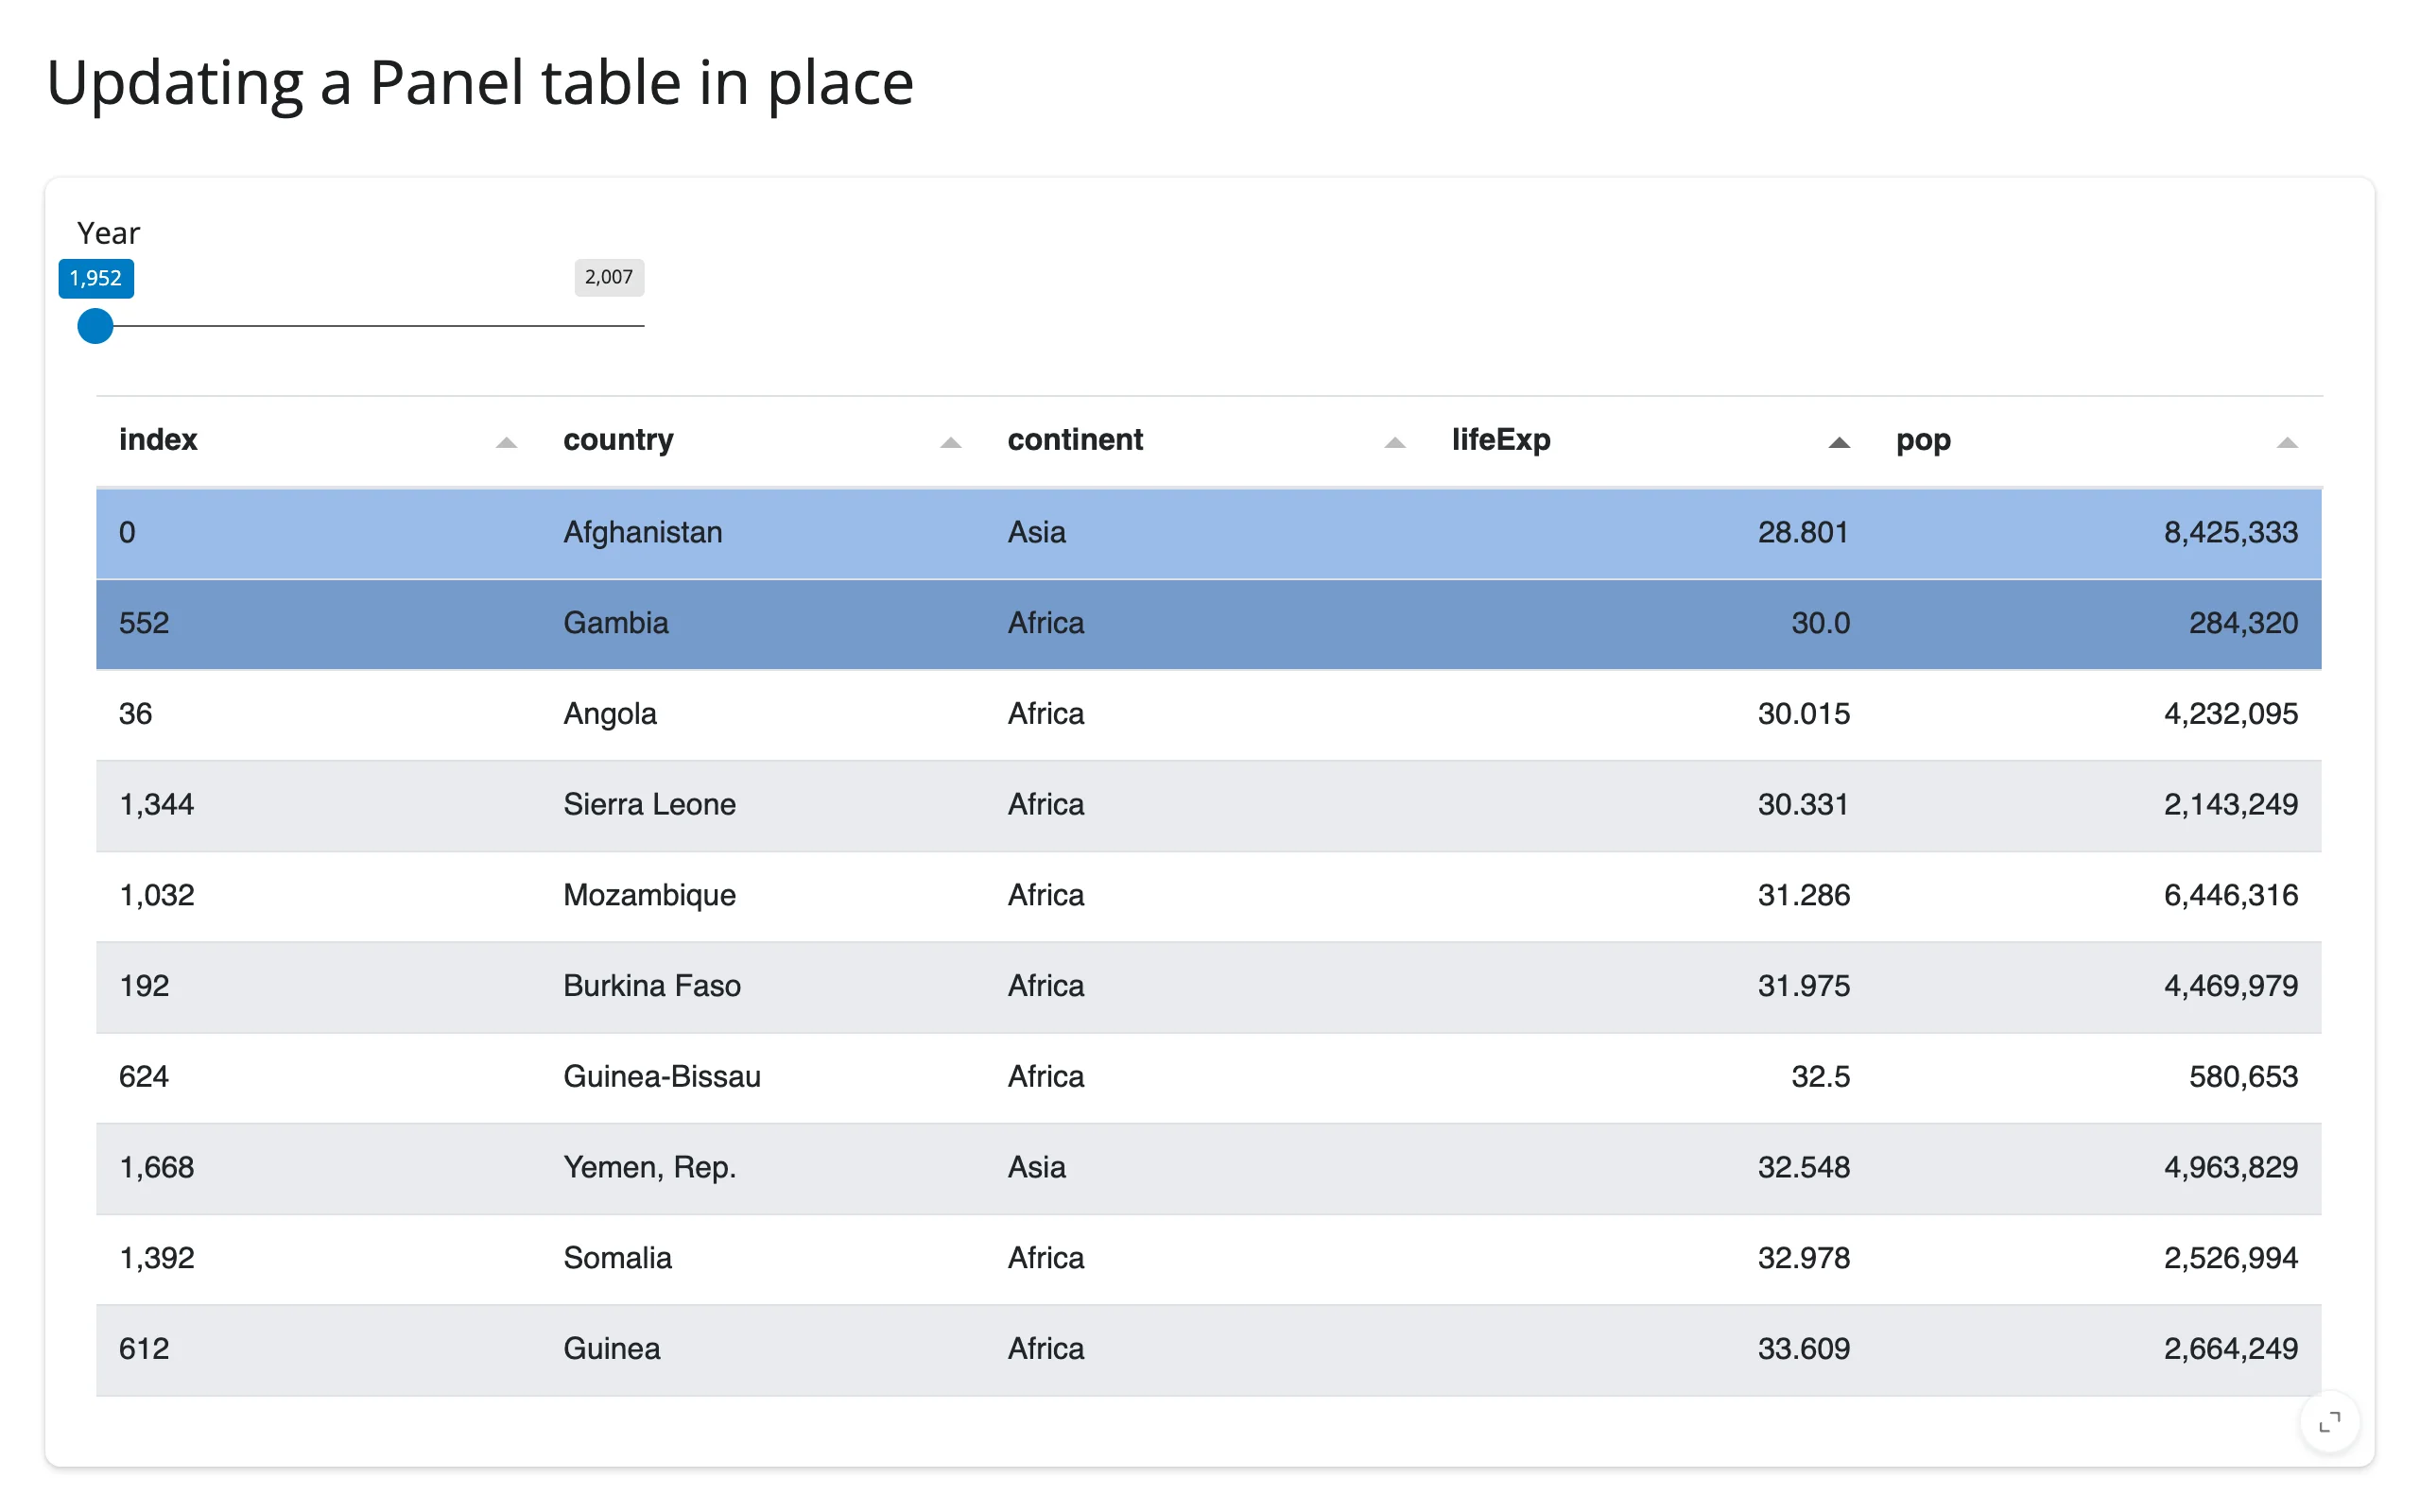
Because render_panel.value is the live Panel object you returned, you can mutate it from a @reactive.effect instead of re-rendering. This matters for the same reason it matters for Bokeh: re-rendering gives the user a brand new table, resetting sort order and selection; mutating .value in place keeps both, and sends only a small patch over the comm instead of rebuilding and resending the whole table:
import pandas as pd
import panel as pn
import plotly.express as px
from shiny import reactive
from shiny.express import input, ui
from shinywidgets import render_panel

pn.extension("tabulator")

gapminder = px.data.gapminder()
years = sorted(gapminder["year"].unique().tolist())

ui.page_opts(title="Updating a Panel table in place", fillable=True)

with ui.card(full_screen=True):
    ui.input_slider("year", "Year", min=years[0], max=years[-1], value=years[0], step=5)

    @render_panel
    def table():
        with reactive.isolate():
            df = gapminder[gapminder["year"] == input.year()]
        return pn.widgets.Tabulator(
            df[["country", "continent", "lifeExp", "pop"]],
            selectable=True, disabled=True, theme="bootstrap5",
            layout="fit_columns", sizing_mode="stretch_both",
        )


@reactive.effect
def _():
    # Mutating `.value` in place (instead of returning a new Tabulator from
    # the render function) keeps the table's current client-side sort, and
    # re-points the row selection at the same countries by name.
    tab = table.value
    kept = set(tab.value.iloc[tab.selection]["country"])
    df = gapminder[gapminder["year"] == input.year()][
        ["country", "continent", "lifeExp", "pop"]
    ]
    tab.value = df
    tab.selection = [i for i, c in enumerate(df["country"]) if c in kept]
Sorted ascending by life expectancy, with Afghanistan and Gambia selected at 1952:
After moving the year slider to 1972: the sort order is still ascending by life expectancy, and the same two countries are still selected – at new row positions, since their relative rank changed:
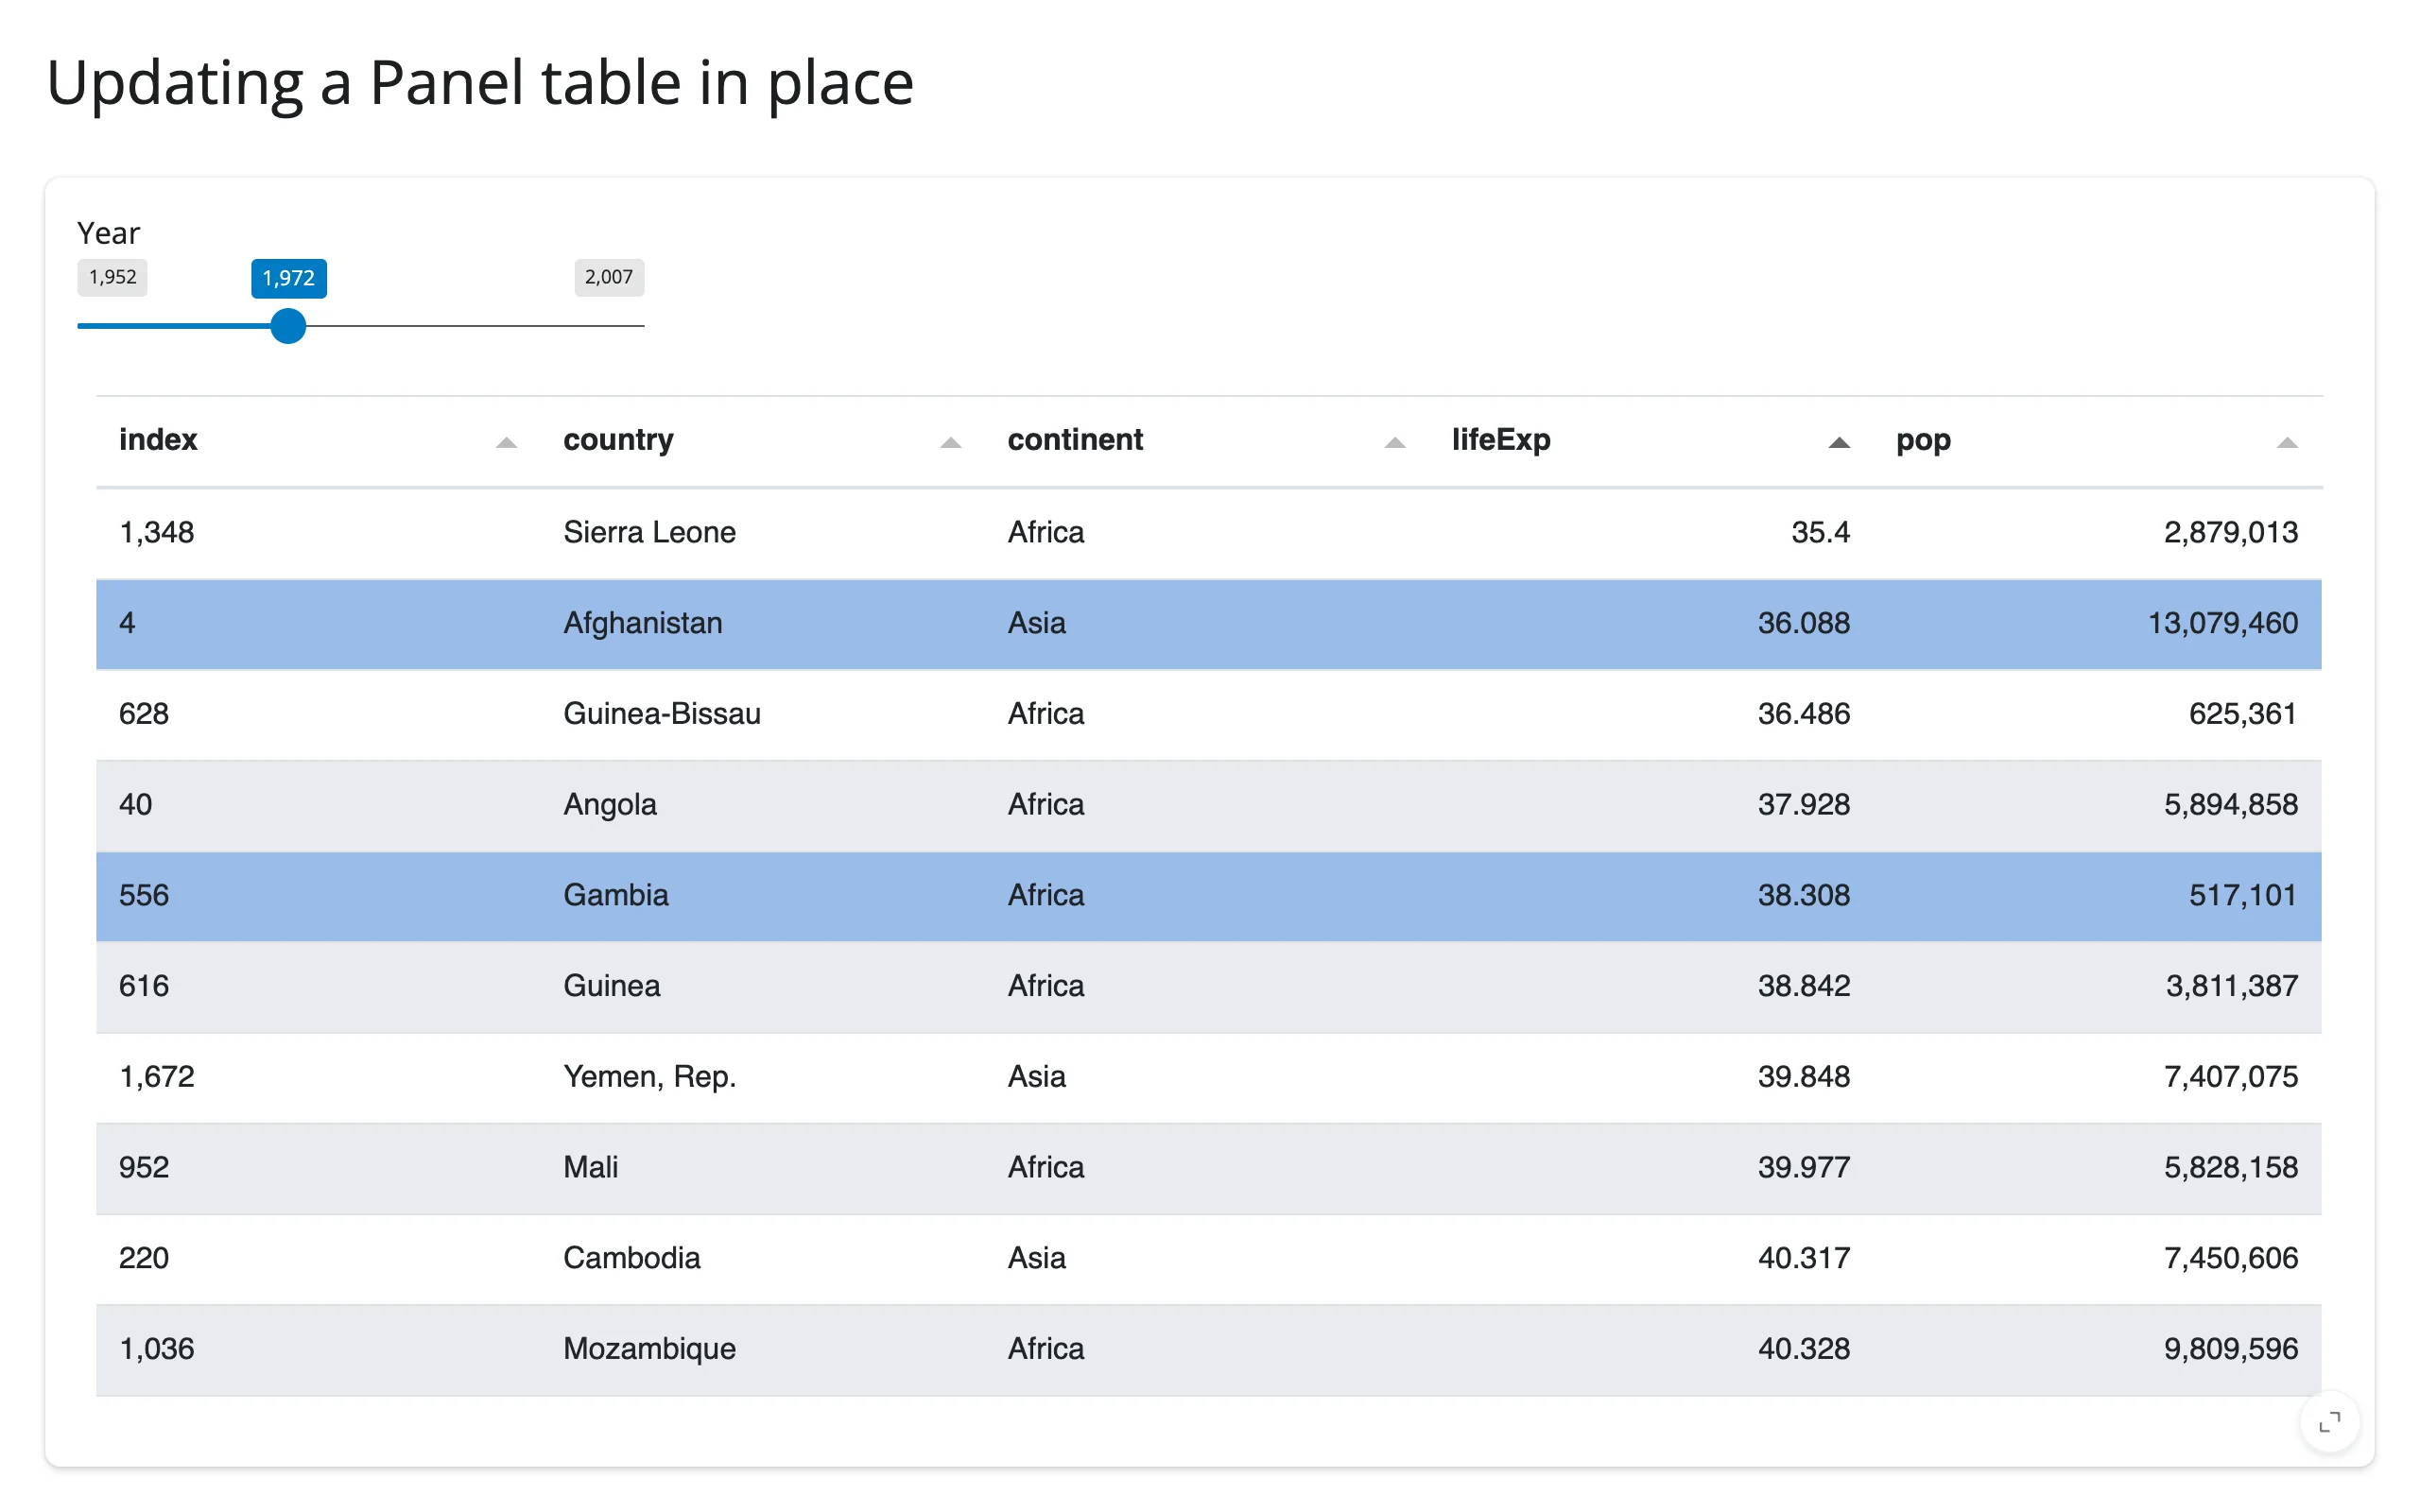
Tabulator.selection holds row positions in the current .value, not stable row identifiers – replacing .value without re-pointing .selection leaves the old integer positions pointing at whatever rows happen to be there now, which is why the snippet re-maps positions by country name after each update.
Coordinating multiple views
Table selection drives a chart
table.param("selection") reads a Tabulator’s current row selection directly – no separate bridge to wire up – which plugs into any other renderer, here a Shiny-native render_plotly chart with no Panel involvement:
import panel as pn
import plotly.express as px
from shiny.express import ui
from shinywidgets import render_panel, render_plotly

pn.extension("tabulator")

gapminder = px.data.gapminder()
latest = gapminder[gapminder["year"] == 2007].sort_values("pop", ascending=False).head(15)

ui.page_opts(title="Table selection drives a plotly chart", fillable=True)

with ui.layout_columns(col_widths=[7, 5]):
    with ui.card(full_screen=True):
        ui.card_header("The 15 most populous countries, 2007 (select some rows)")

        @render_panel
        def table():
            return pn.widgets.Tabulator(
                latest[["country", "continent", "pop"]],
                selectable=True, disabled=True, theme="bootstrap5",
                layout="fit_columns", sizing_mode="stretch_both",
            )

    with ui.card(full_screen=True):
        ui.card_header("Life expectancy trend of the selected countries")

        @render_plotly
        def trend():
            idx = table.param("selection")
            countries = table.value.value.iloc[idx]["country"].tolist() if idx else []
            df = gapminder[gapminder["country"].isin(countries)] if countries else gapminder.iloc[:0]
            return px.line(df, x="year", y="lifeExp", color="country", markers=True)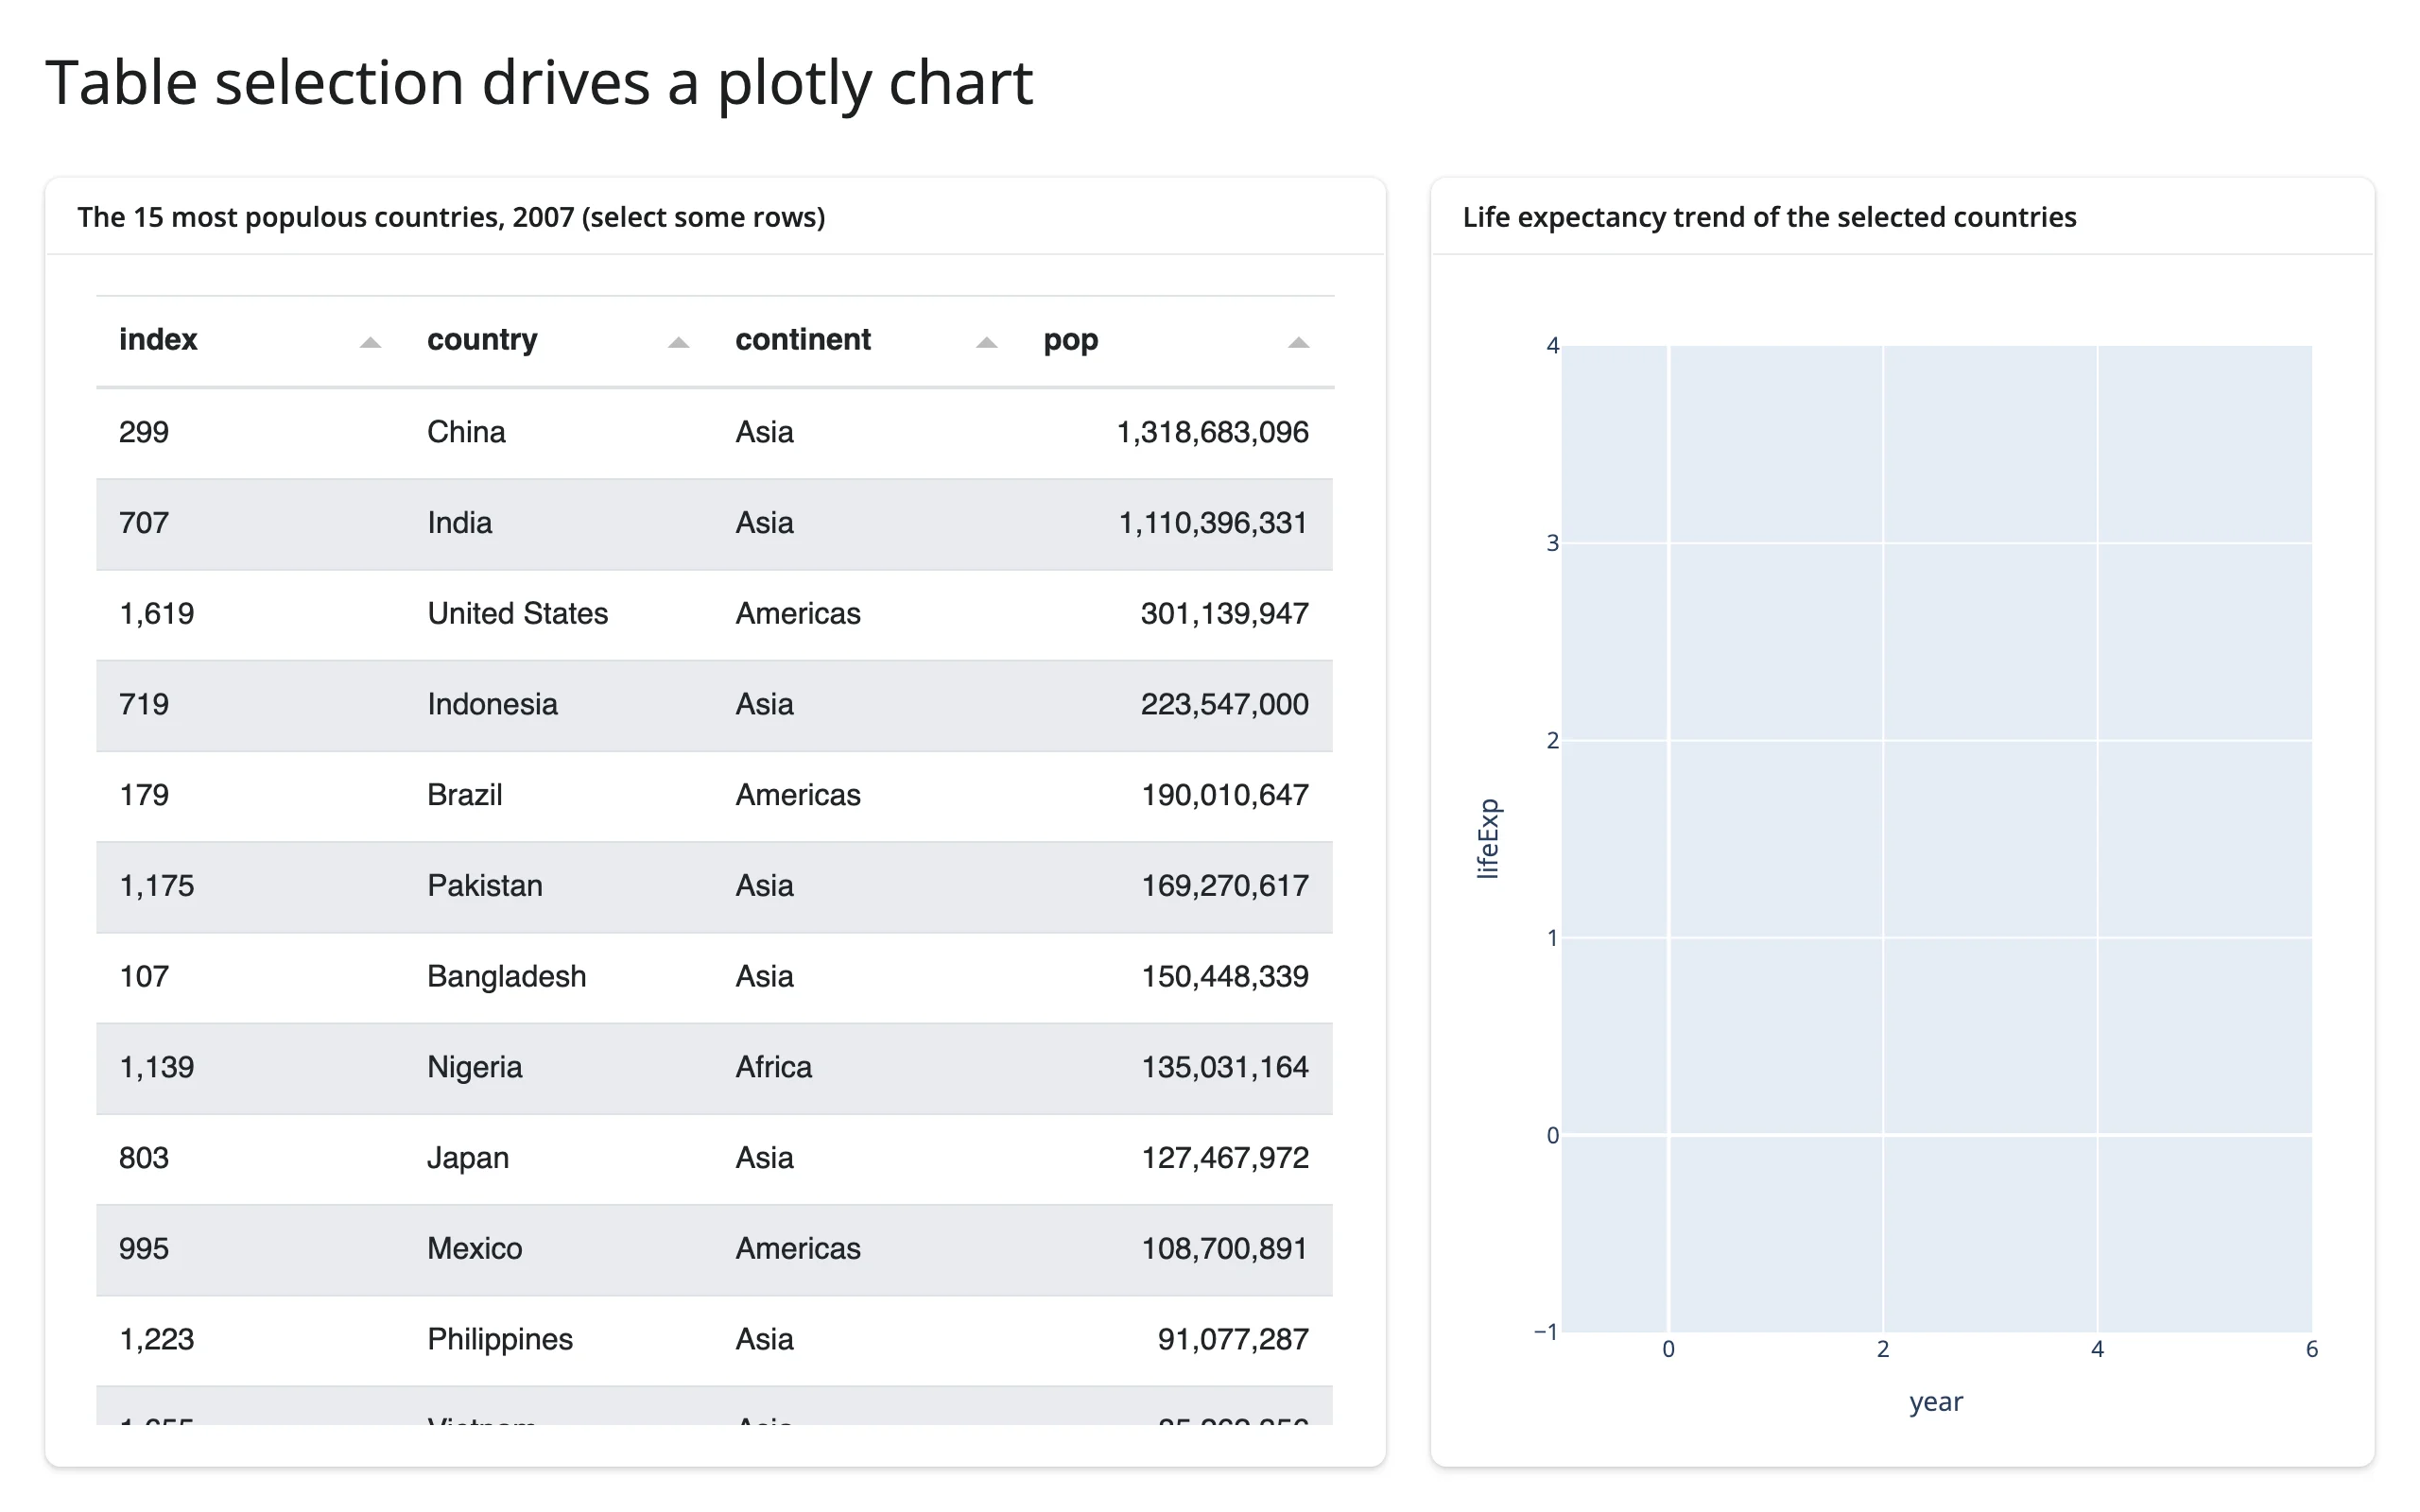
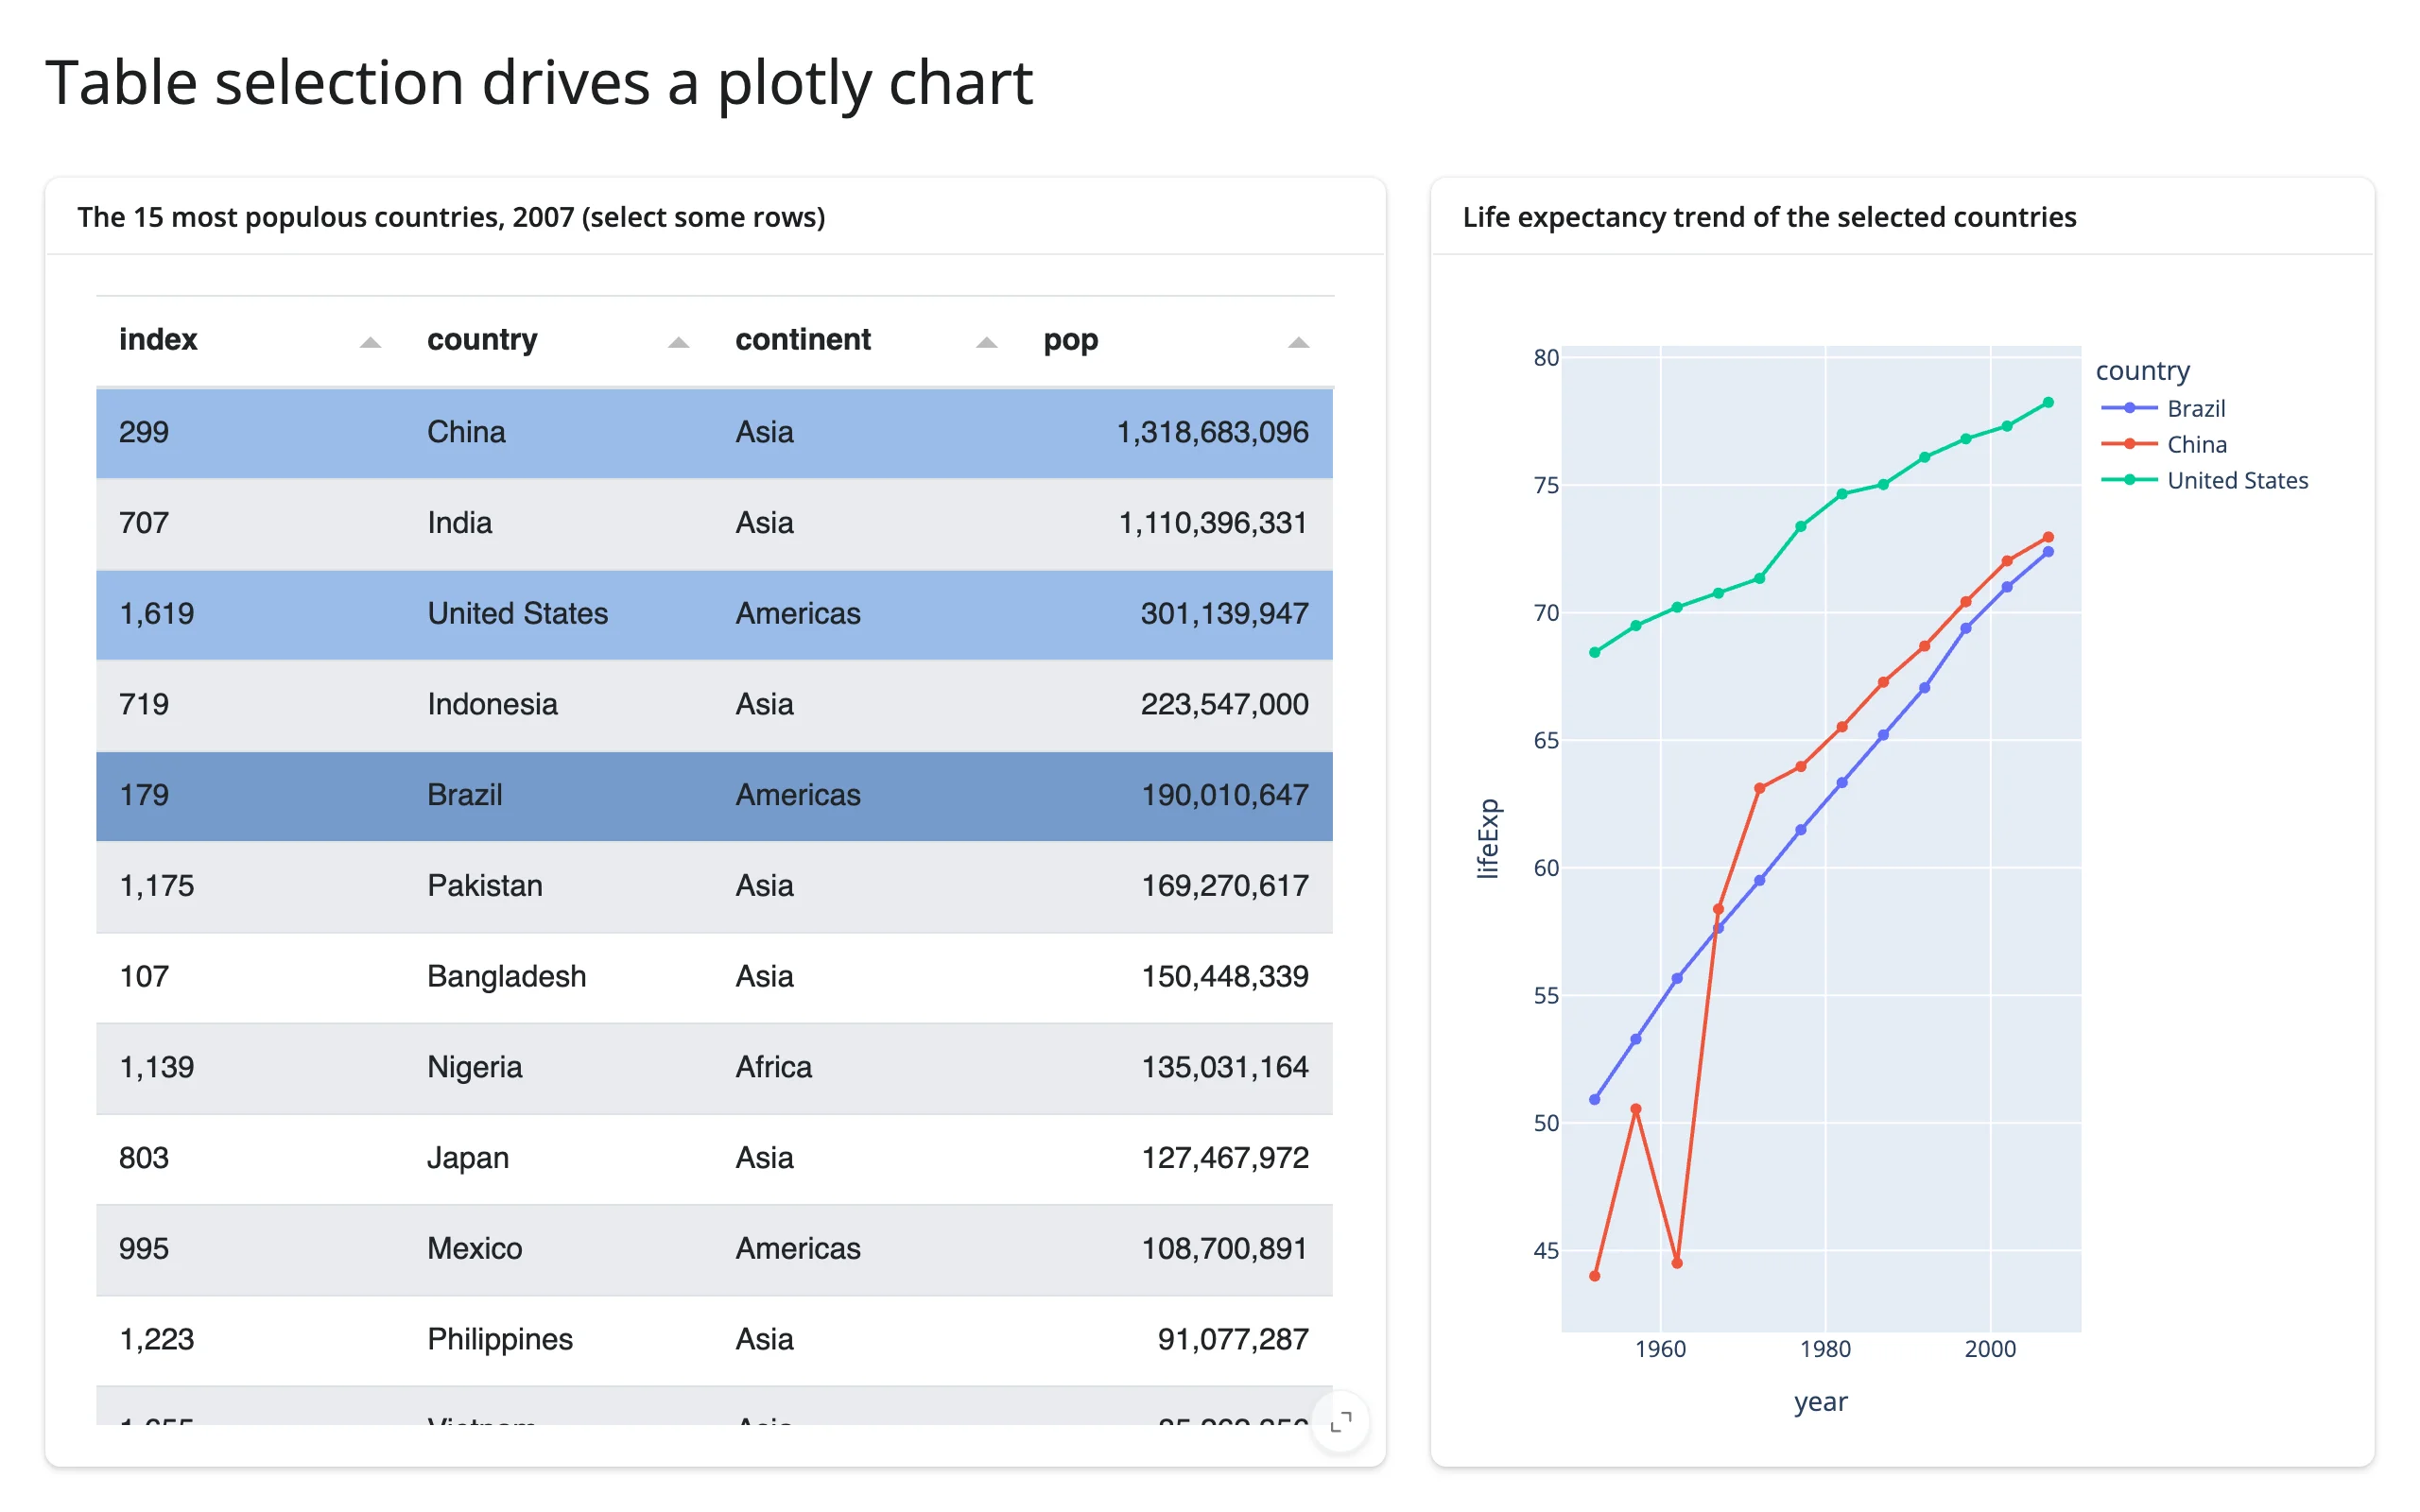
Cmd-clicking China, the United States, and Brazil populates the render_plotly trend chart with exactly those three countries’ life-expectancy history. table.value is read here too (outside table’s own render function, where it’s fine) to turn the selected positions back into rows – param("selection") gives you the indices, .value gives you the frame they index into.
Click a row, update a detail card in place
A single-row click can drive a focused detail view – here a pn.indicators.Number in a separate card, mutated in place rather than re-rendered, so it never flickers:
import panel as pn
import plotly.express as px
from shiny import reactive
from shiny.express import ui
from shinywidgets import render_panel

pn.extension("tabulator")

latest = px.data.gapminder().query("year == 2007").sort_values("pop", ascending=False).head(15)

ui.page_opts(title="Click a row to update a detail card in place", fillable=True)

with ui.layout_columns(col_widths=[7, 5]):
    with ui.card(full_screen=True):
        ui.card_header("Click a country")

        @render_panel
        def table():
            return pn.widgets.Tabulator(
                latest[["country", "continent", "lifeExp", "pop"]],
                selectable=1, disabled=True, theme="bootstrap5",
                layout="fit_columns", sizing_mode="stretch_both",
            )

    with ui.card():
        ui.card_header("Selected country (updated in place, not re-rendered)")

        @render_panel
        def detail():
            # Built once with a placeholder; the effect below mutates it.
            return pn.indicators.Number(
                name="Select a row", value=0, format="{value:.1f} yrs",
                sizing_mode="stretch_width",
            )


@reactive.effect
def _():
    idx = table.param("selection")
    ind = detail.value
    if not idx:
        ind.name, ind.value = "Select a row", 0
    else:
        row = table.value.value.iloc[idx[0]]
        ind.name = f"{row['country']} -- life expectancy"
        ind.value = row["lifeExp"]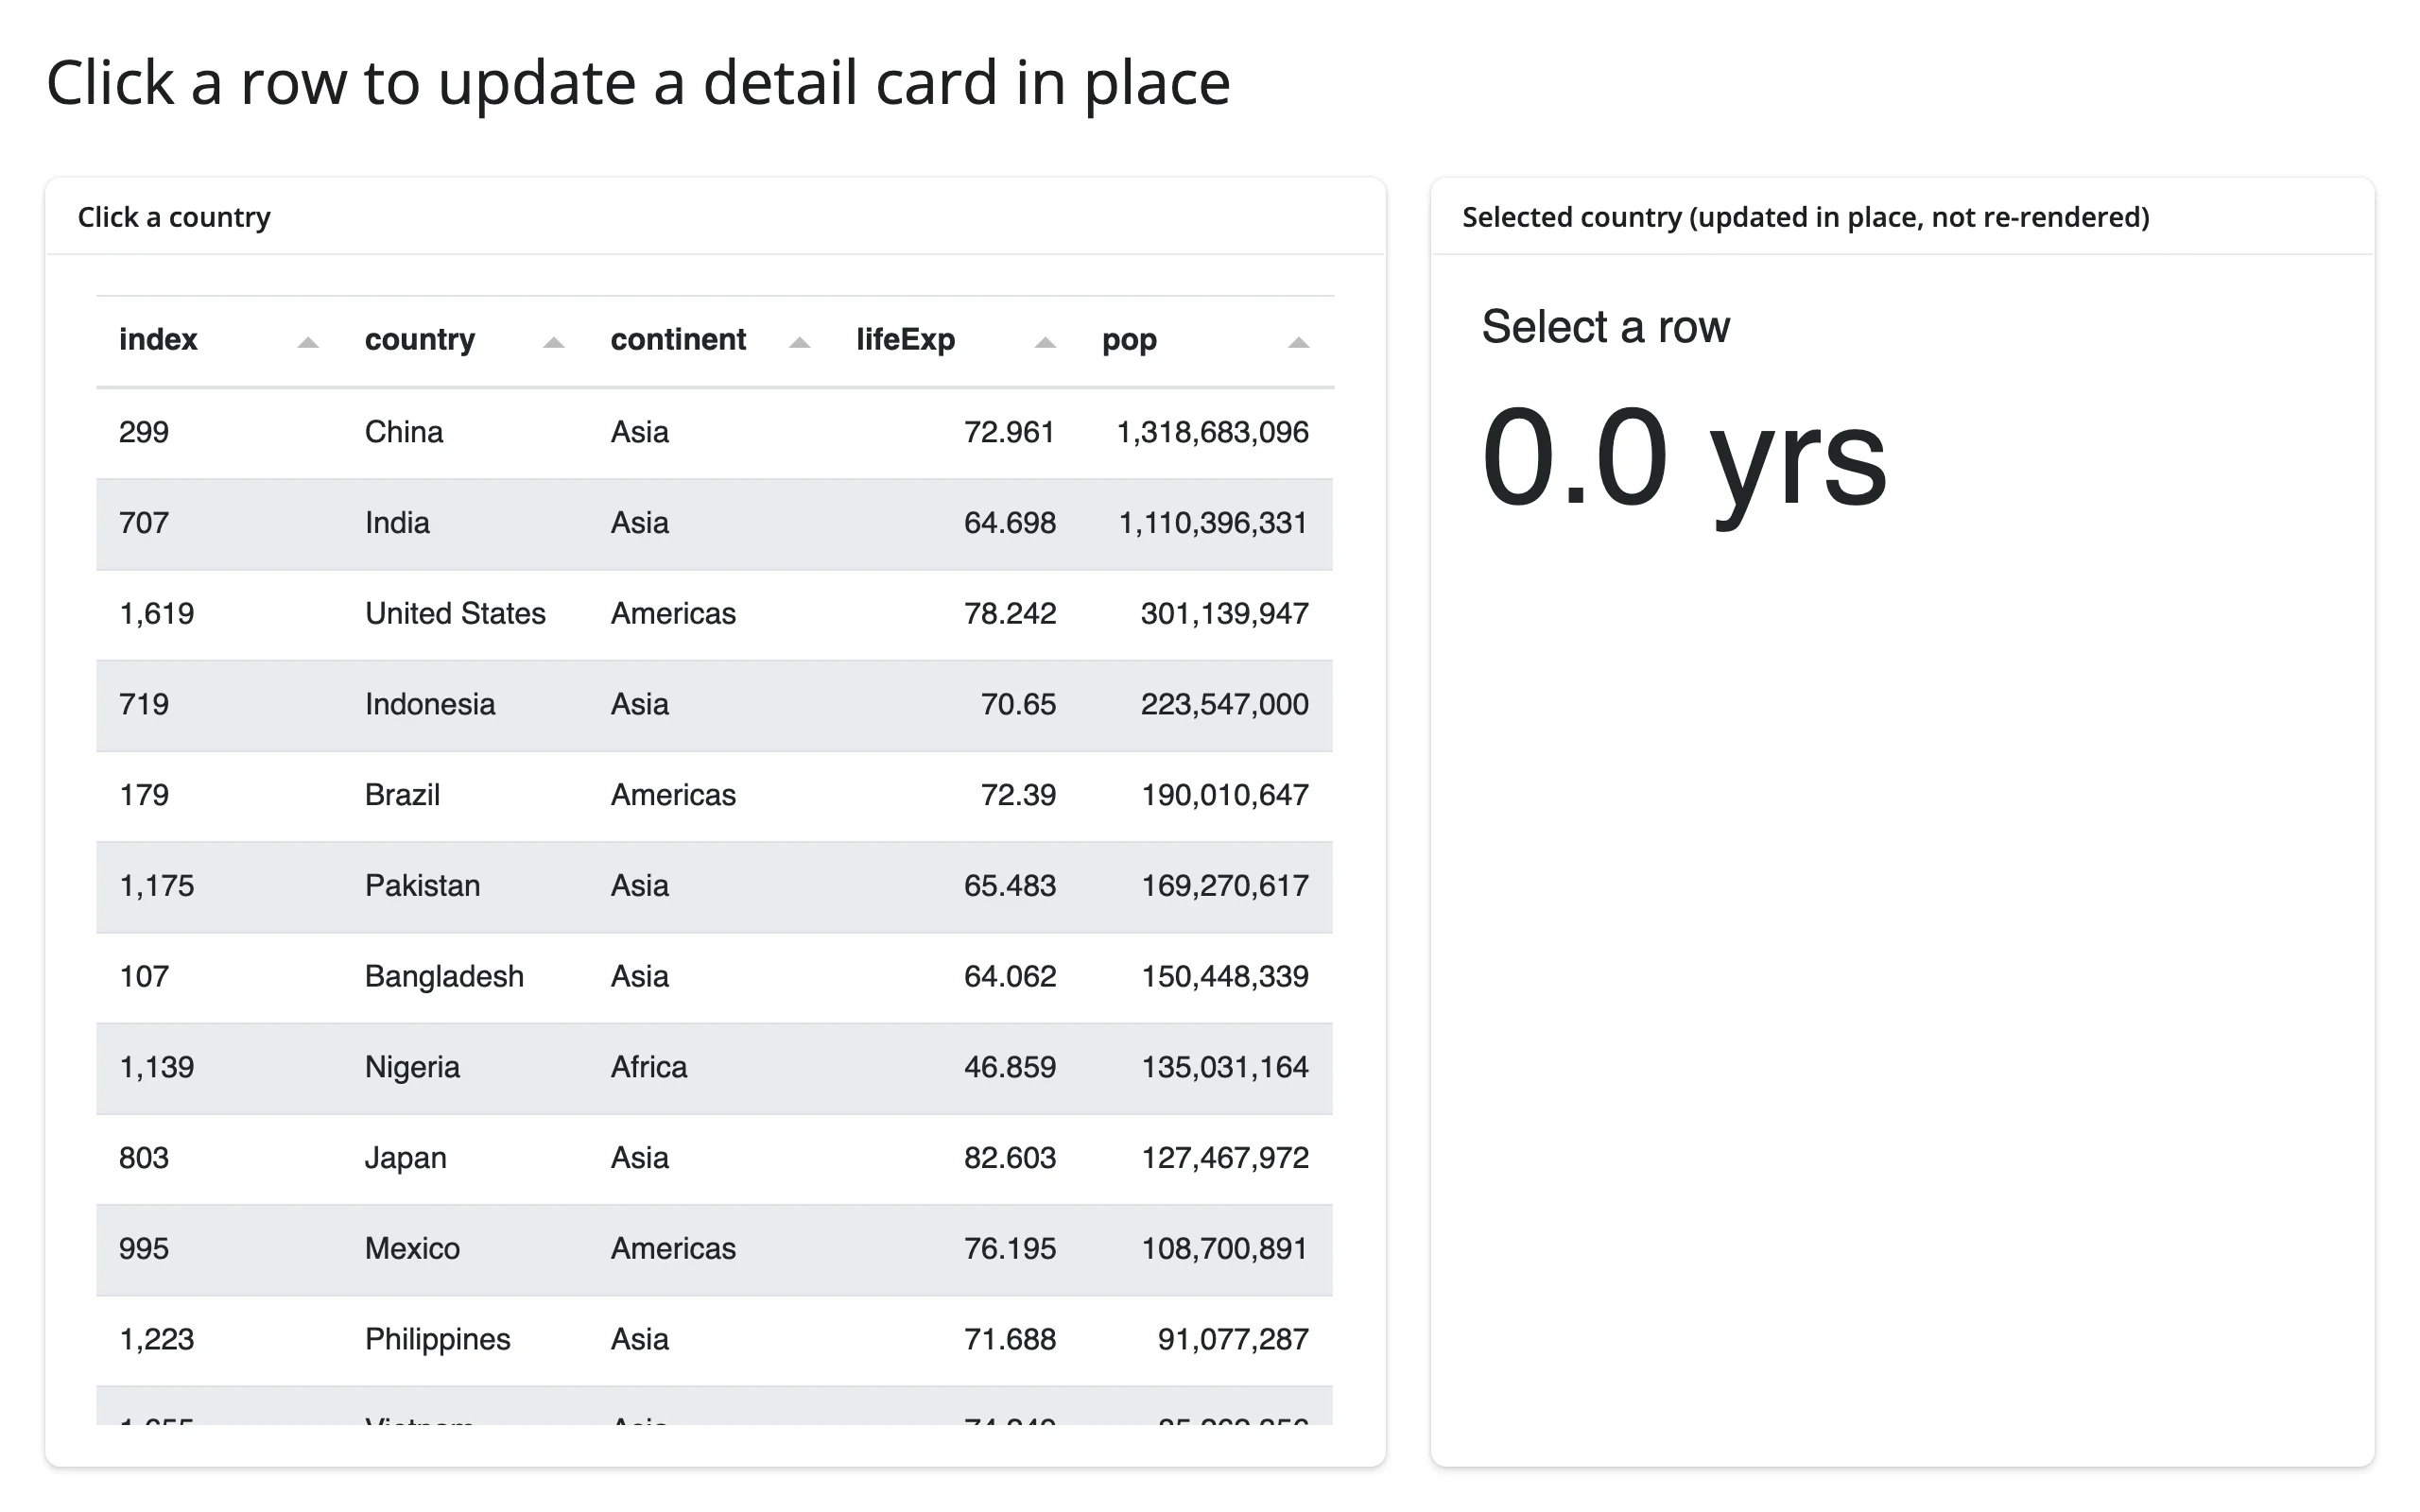
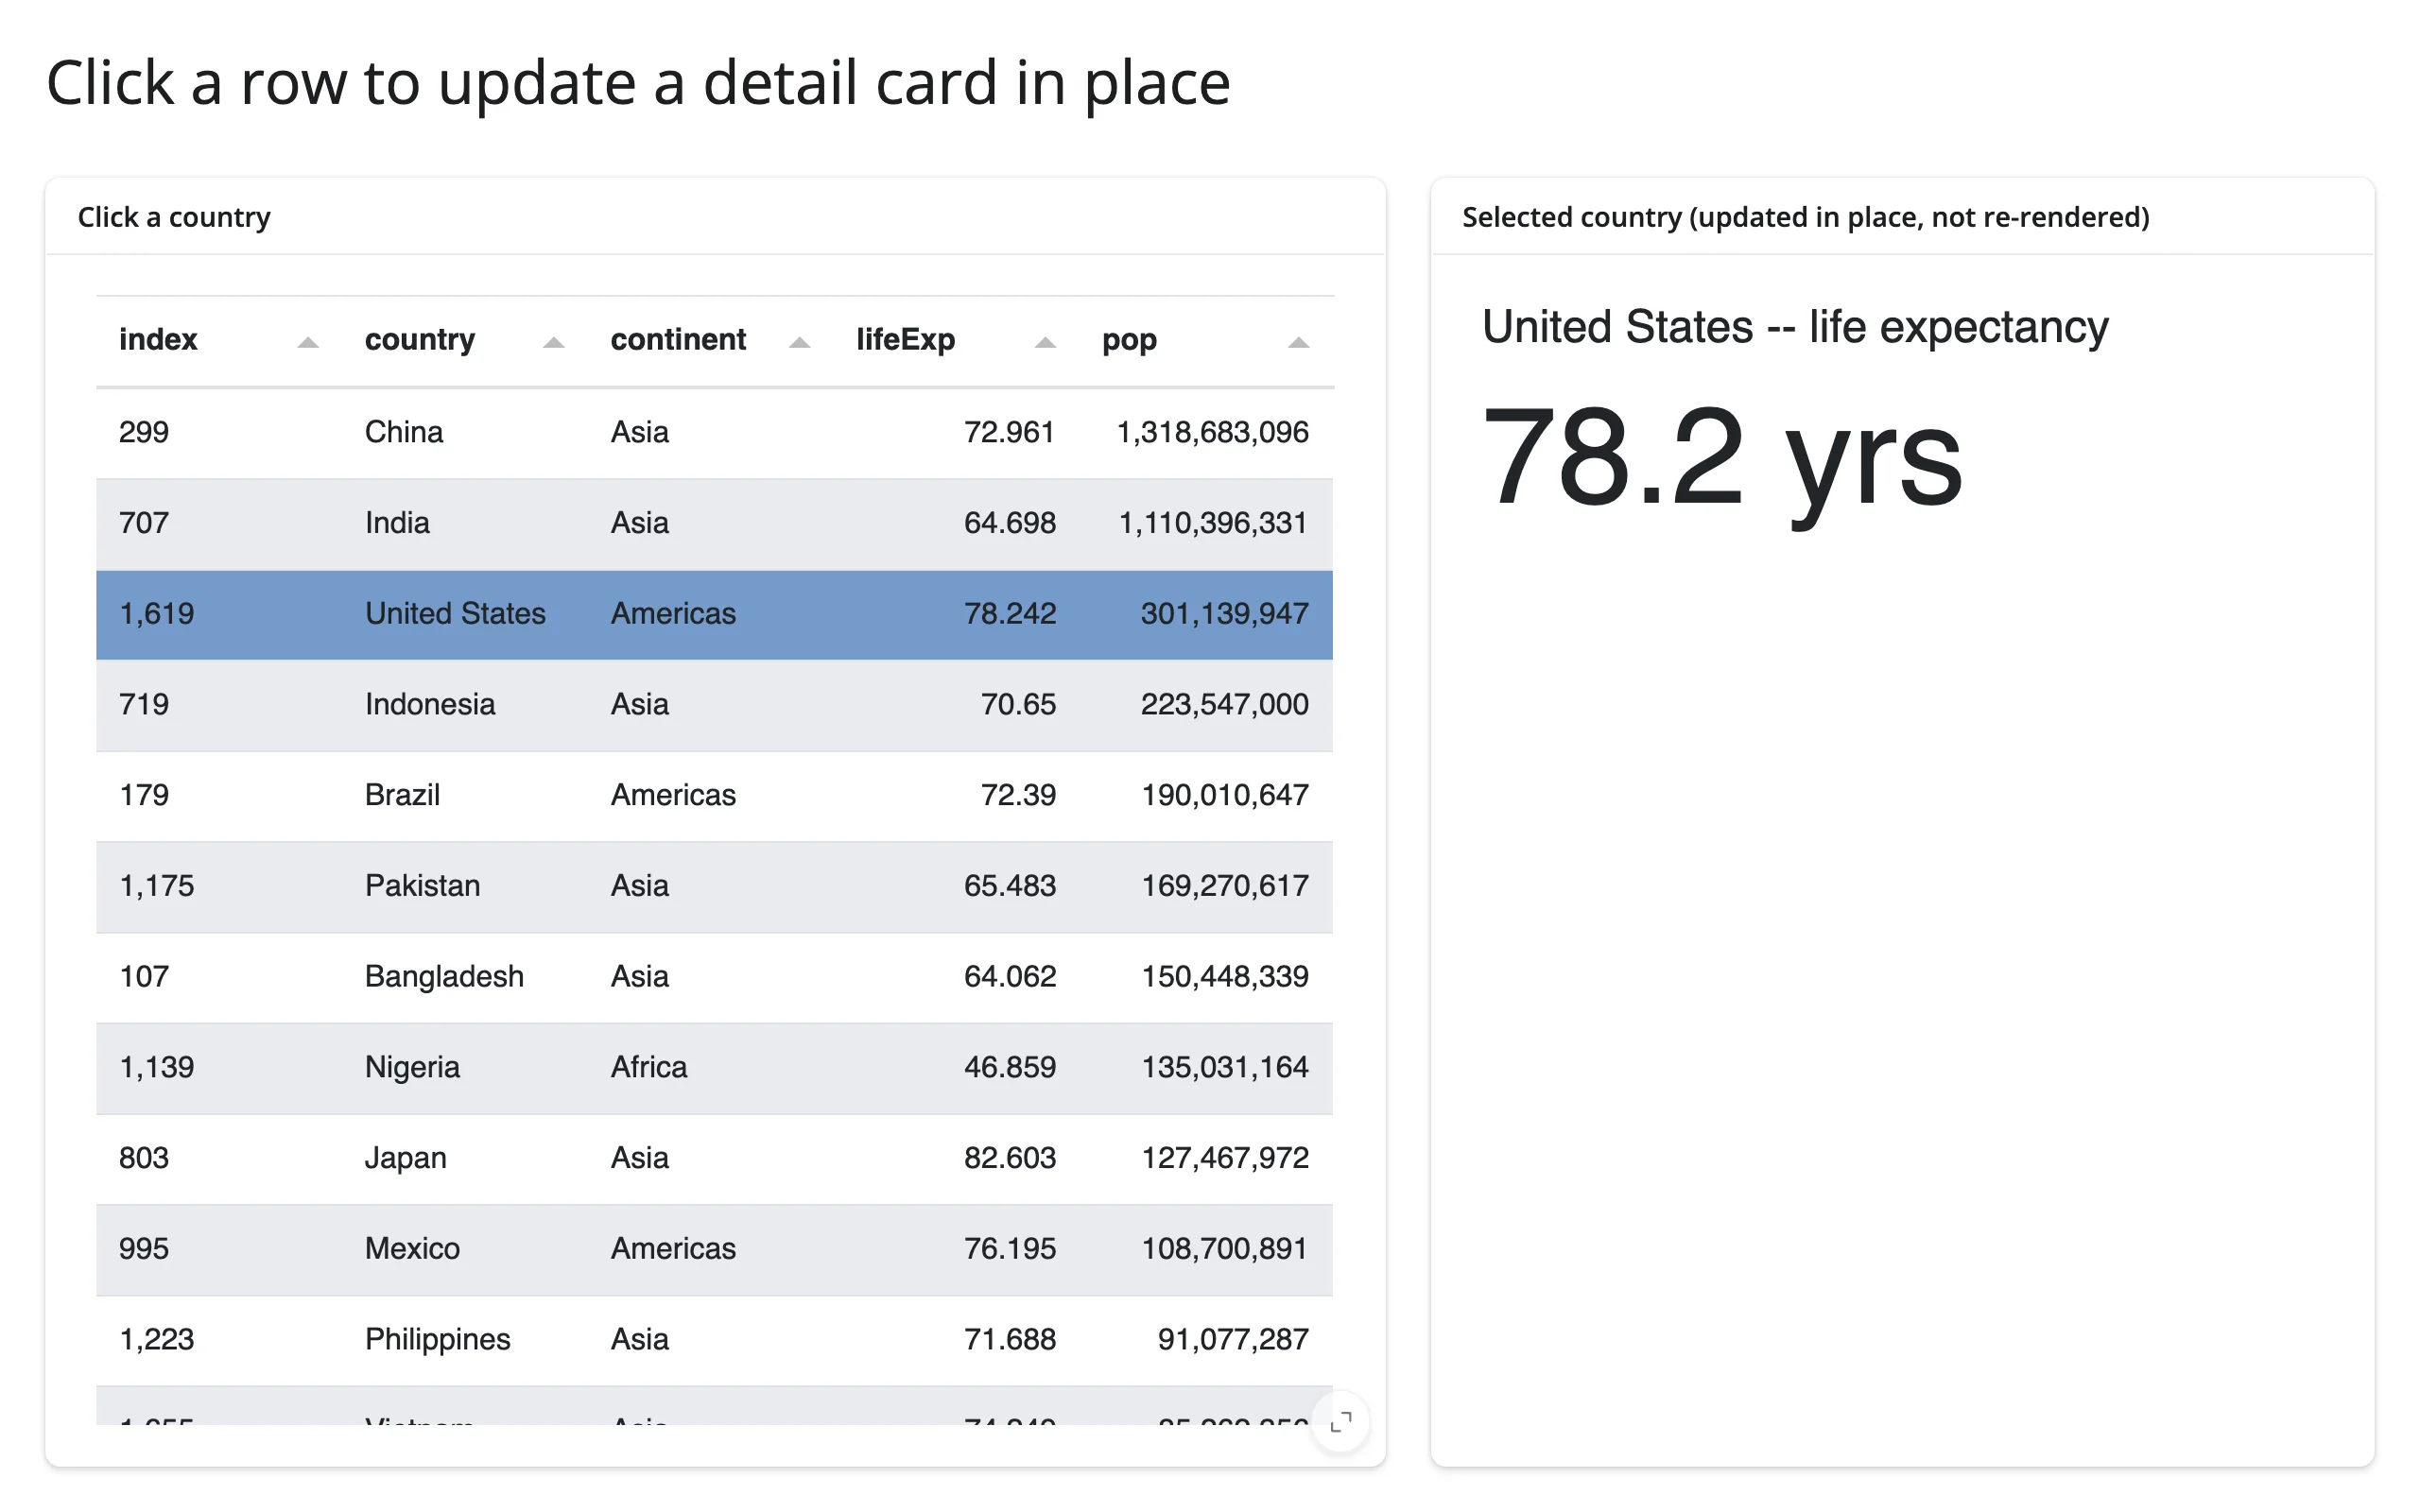
selectable=1 (an integer, not True) caps the Tabulator at a single selected row – useful whenever “click one row for detail” is the interaction you want, rather than multi-select.
A different widget family drives an indicator
param(name) works the same way regardless of which Panel component produces the state. Here, the number of messages in a pn.chat.ChatInterface (its objects parameter) drives a pn.indicators.Number in a sibling card – proving the accessor generalizes past tables:
import panel as pn
from shiny import reactive
from shiny.express import ui
from shinywidgets import render_panel


def canned_reply(contents: str, user: str, instance: pn.chat.ChatInterface):
    return f"Got it: \"{contents}\""


ui.page_opts(title="Chat activity drives an indicator", fillable=True)

with ui.layout_columns(col_widths=[8, 4]):
    with ui.card(full_screen=True):
        ui.card_header("Chat")

        @render_panel
        def chat():
            return pn.chat.ChatInterface(
                callback=canned_reply, show_rerun=False, show_undo=False,
                sizing_mode="stretch_both",
            )

    with ui.card():
        ui.card_header("Messages so far (a different Panel widget, updated in place)")

        @render_panel
        def counter():
            return pn.indicators.Number(
                name="Messages", value=0, sizing_mode="stretch_width",
            )


@reactive.effect
def _():
    counter.value.value = len(chat.param("objects"))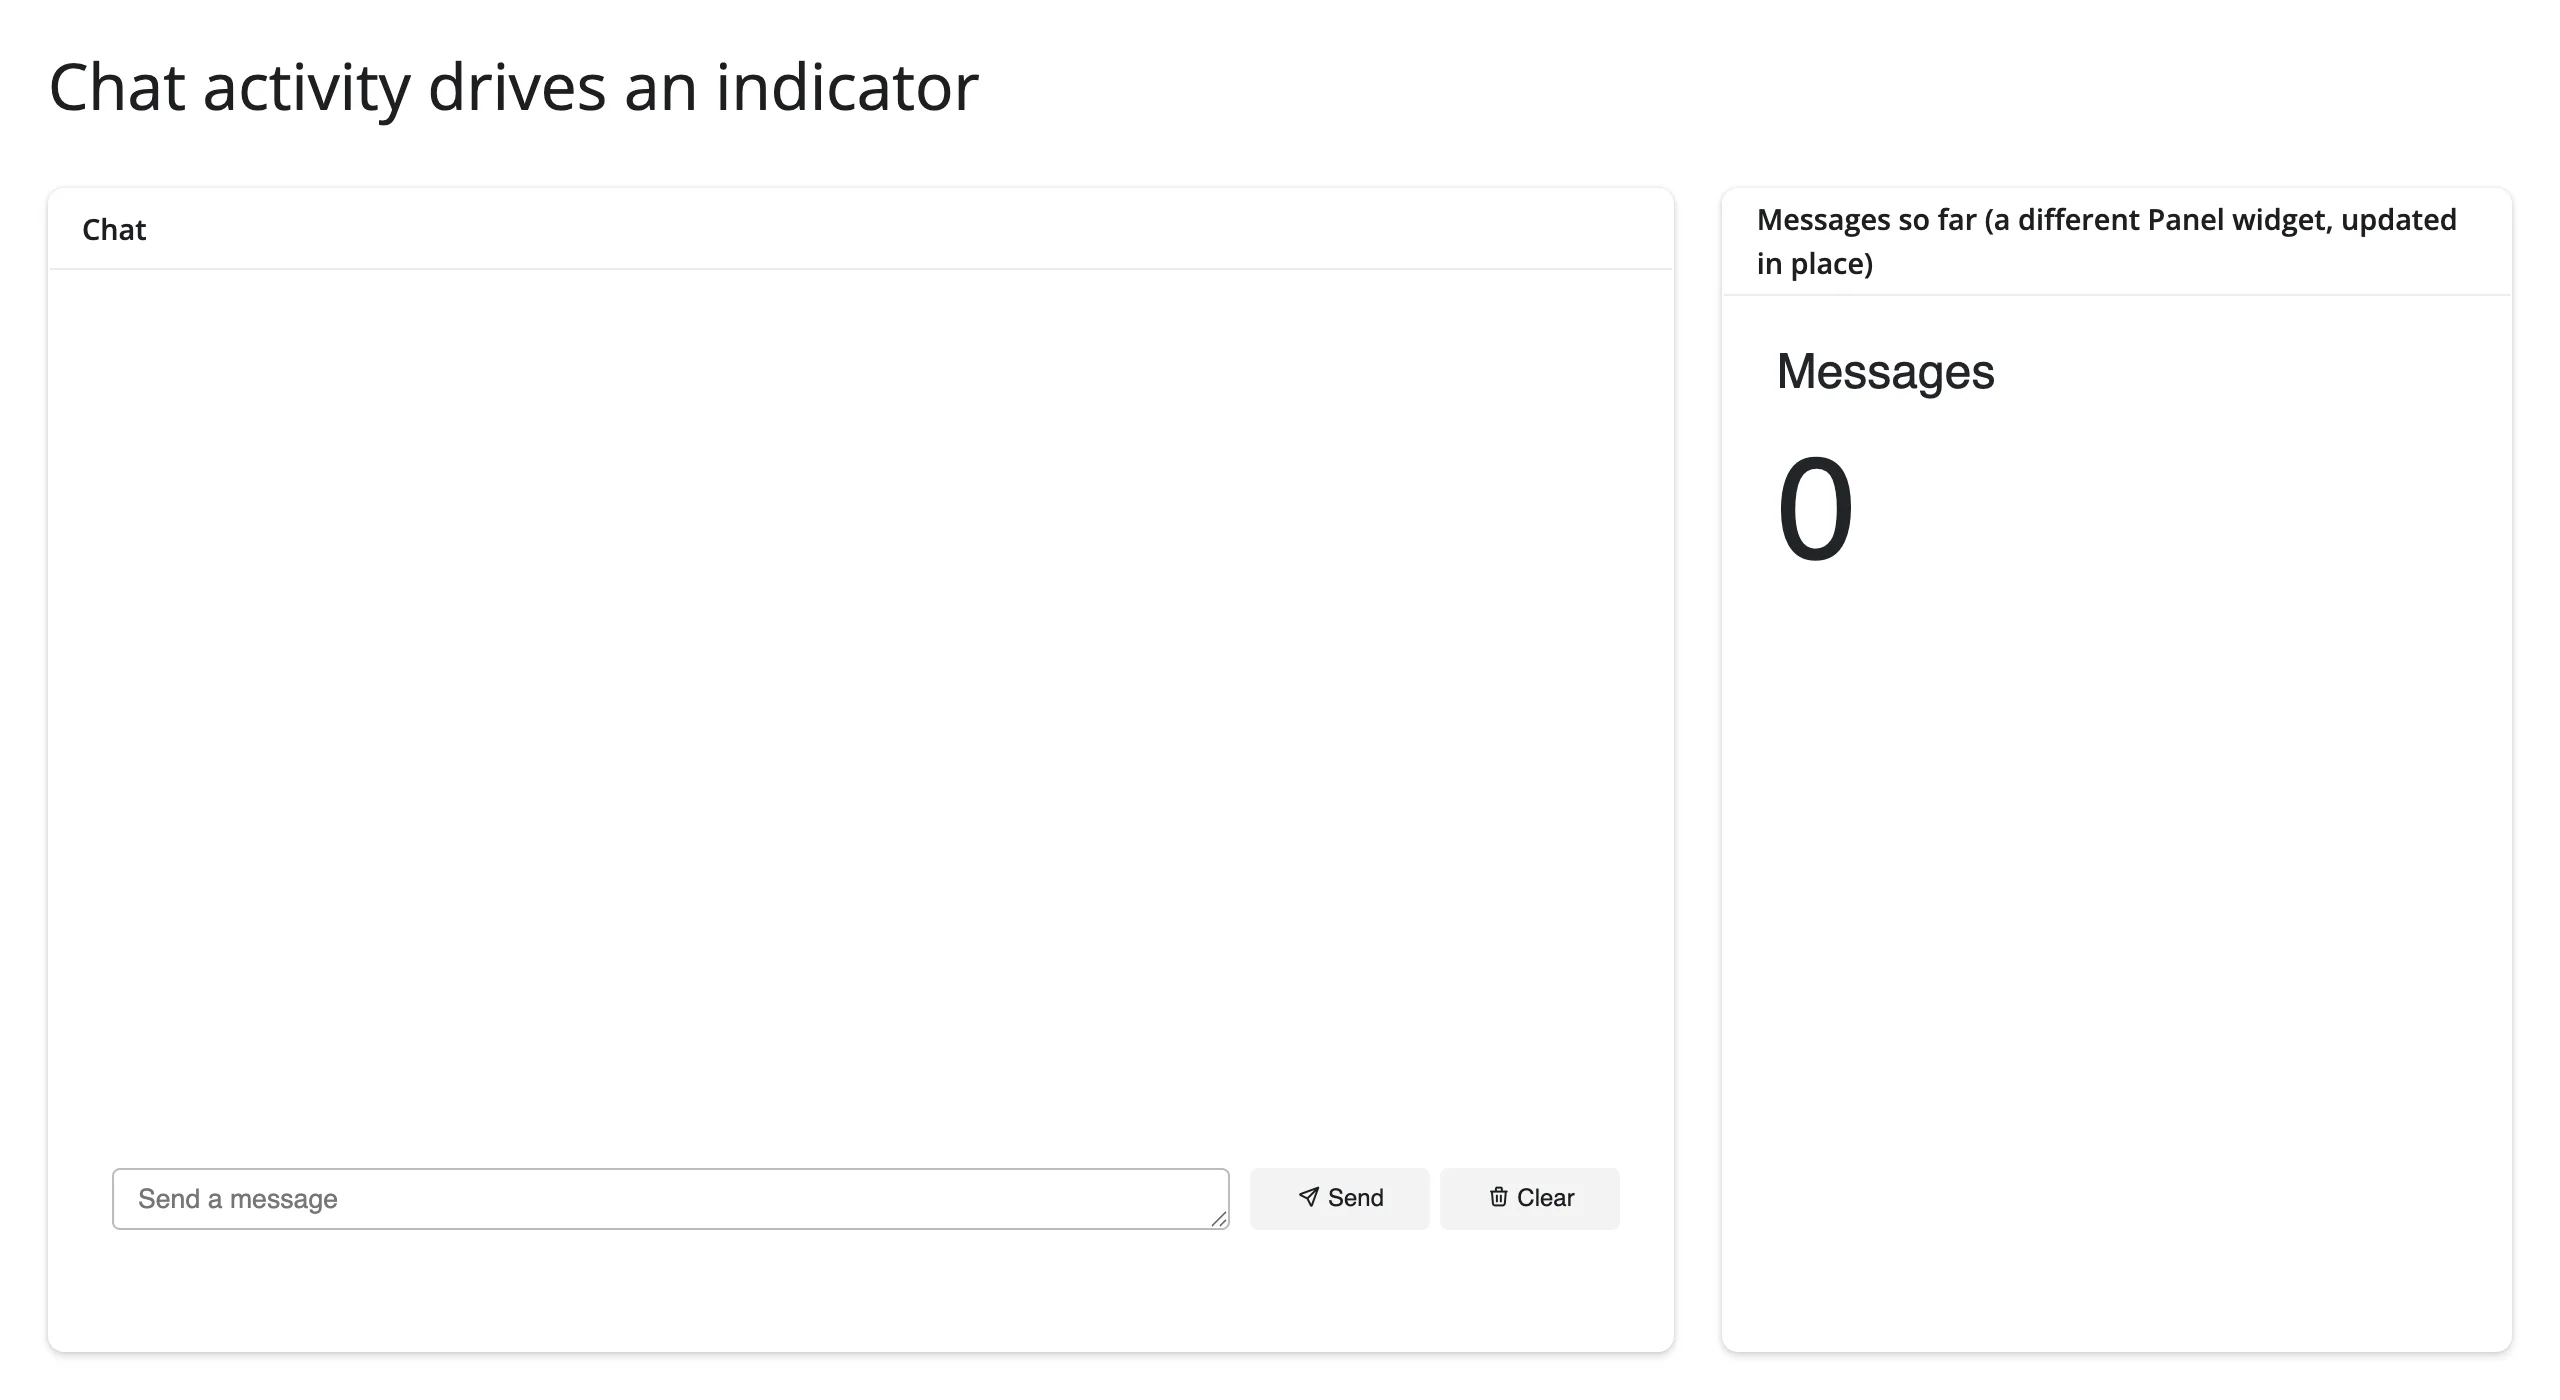
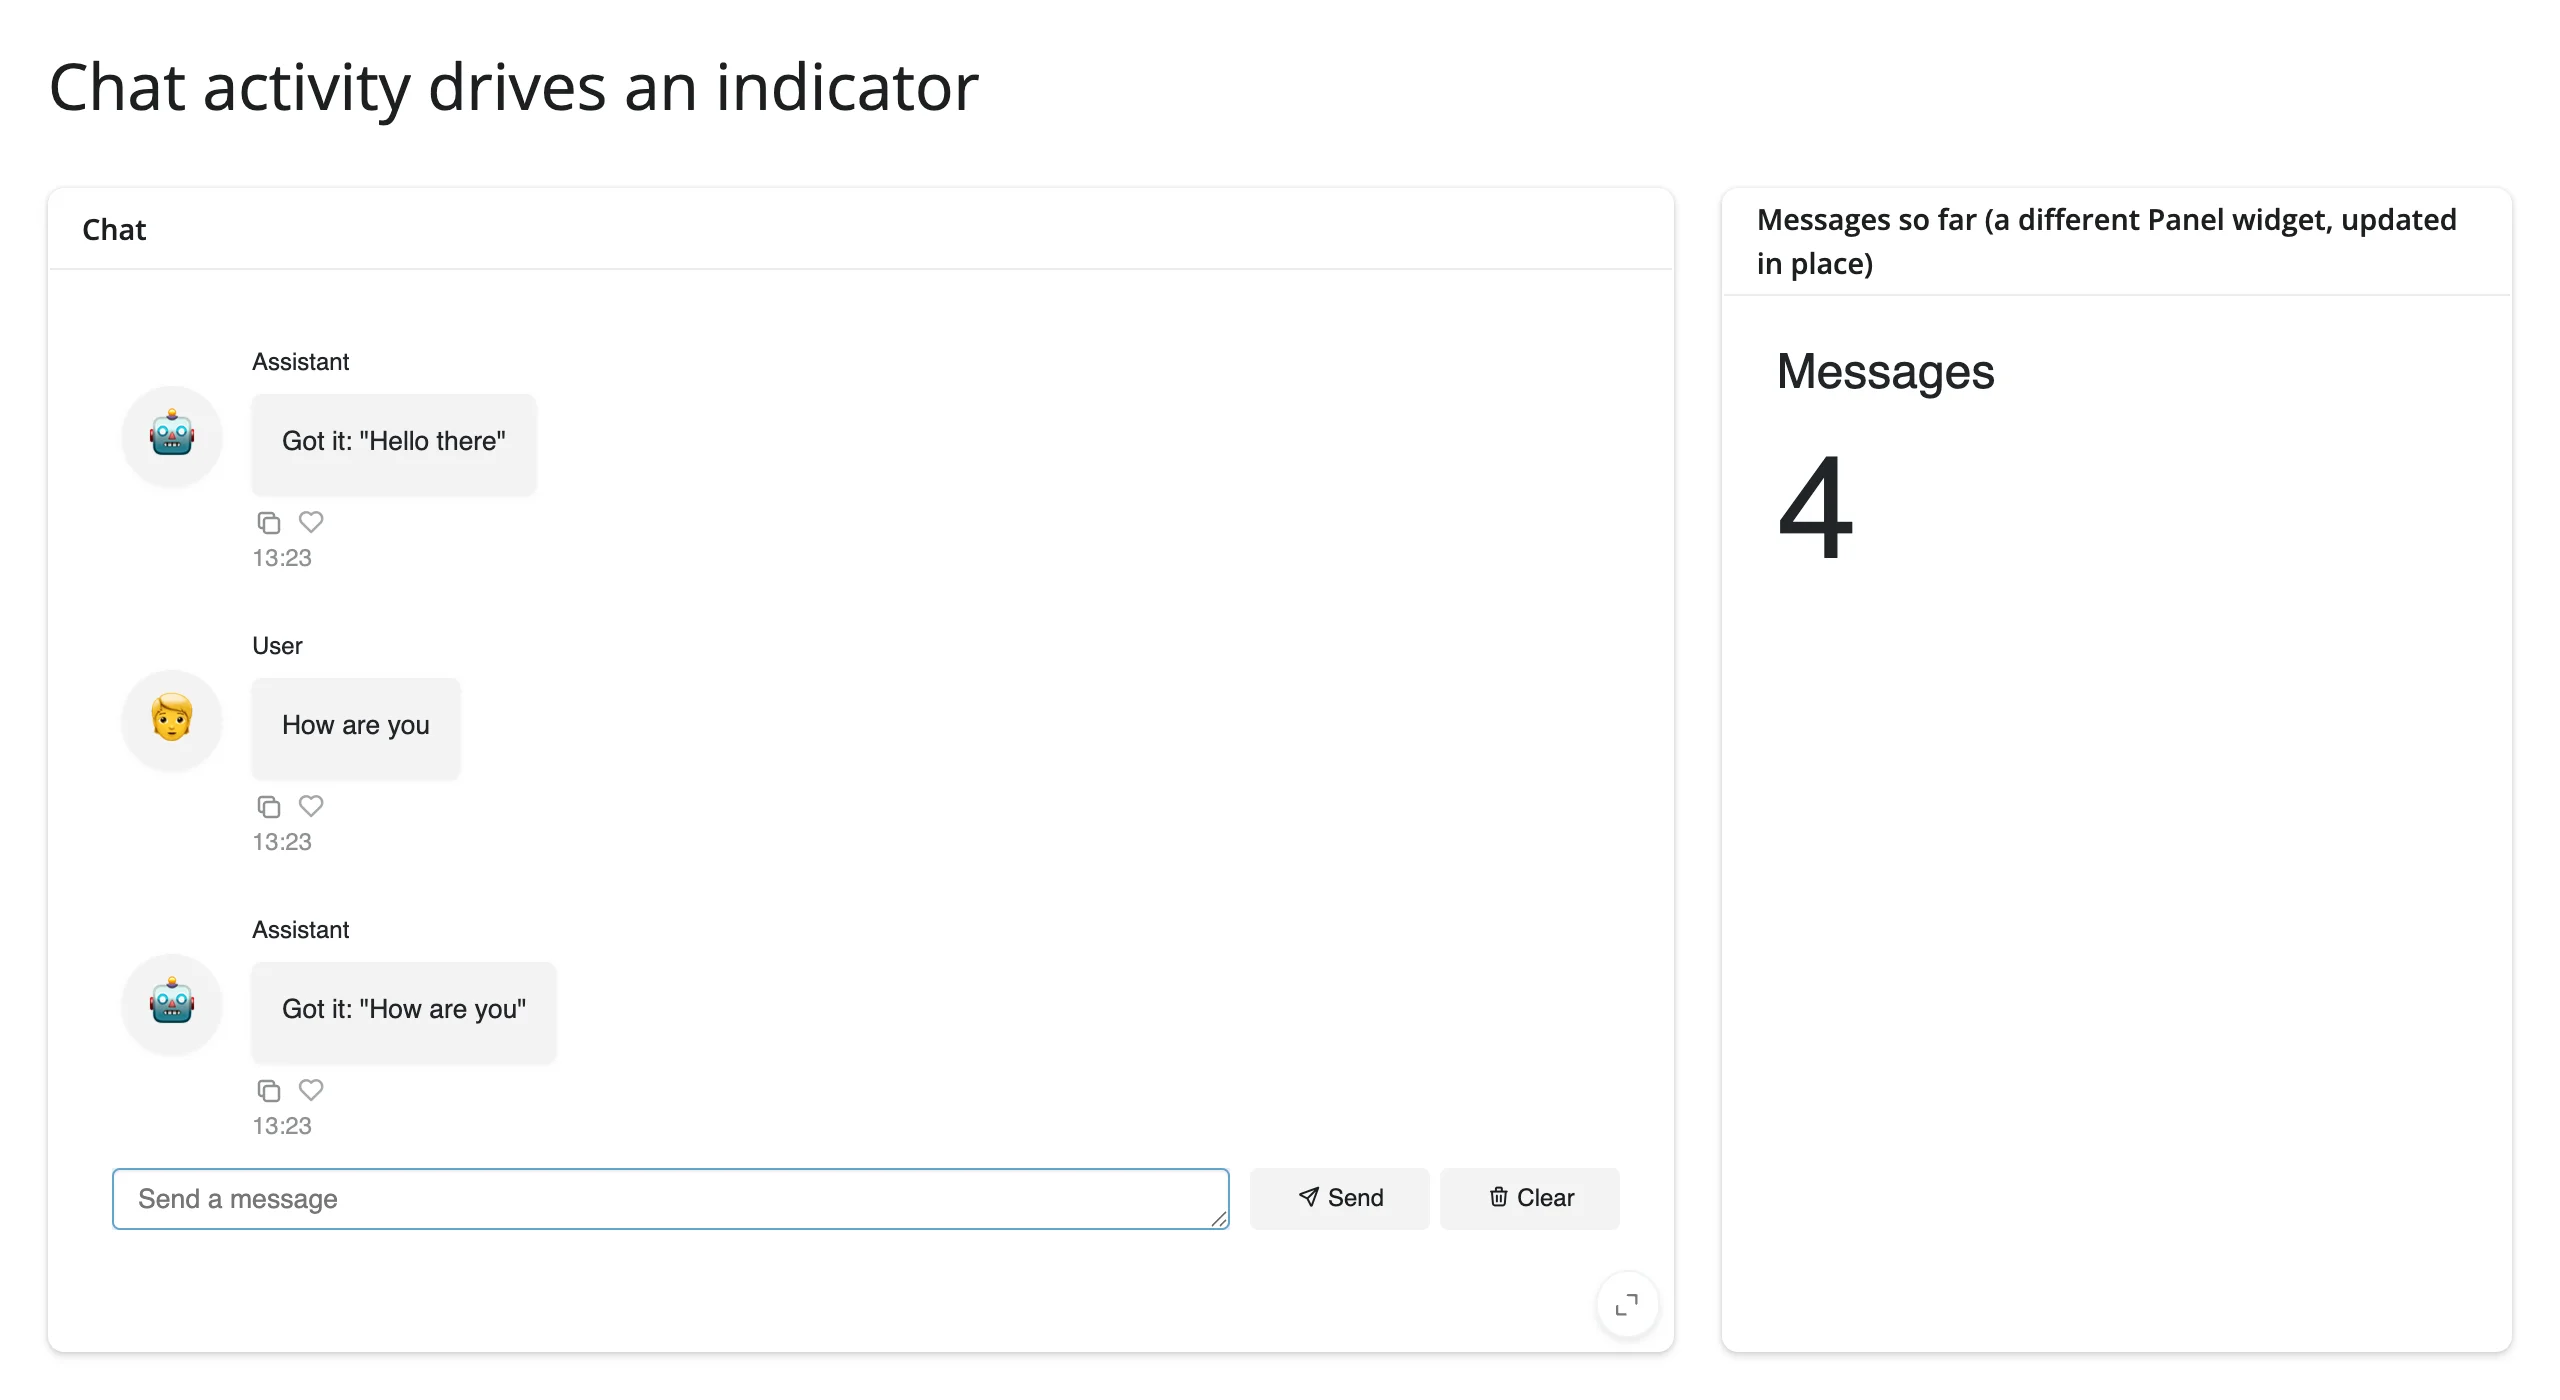
Two round trips (four messages total) moved the counter from 0 to 4.
Large data
Panel has no large-data story of its own – render_panel is a thin wrapper around whichever component you hand it, so scale depends entirely on that component’s own guide: itables or reactable for a large table, bokeh or holoviews for a large chart (Panel’s own panes render through Bokeh via jupyter_bokeh, the same engine as the HoloViews guide). Build the large-data version of the component directly and pass it to render_panel, or render it with that component’s own @render_* decorator alongside a render_panel output for anything Panel-specific – see Large data & performance for how the underlying approaches compare.
Layout and sizing
sizing_mode="stretch_both"(or"stretch_width"/"scale_both"/"scale_height") is what lets a Panel object fill its card. Verified directly:render_panel’s fill behavior checks the rendered root’s actualsizing_mode(the same logicrender_bokehuses, since both produce ajupyter_bokeh.BokehModel) – a plainpn.widgets.Tabulator(df)with nosizing_modekeeps its intrinsic (~1150px) width even inside afull_screen=Truecard, while the same table withsizing_mode="stretch_both"fills exactly the available space.- Not every indicator sizes responsively.
Dial,Number, andProgressacceptsizing_mode.LinearGauge,Trend, andBooleanStatusrender blank withsizing_mode="stretch_both"and no explicit size in a plainui.card()(verified); give them explicitwidth=/height=instead. This is a Panel sizing quirk specific to those SVG-based indicators, not a shinywidgets bug. - Stacking more than one
ui.layout_columns()underui.page_opts(fillable=True)needs the same care as any Shiny fill layout: give exactly one block (usually the tallest, most important one) room to grow, and passfill=False(or an explicitheight=) to the others – otherwise they compete for the same vertical space and overlap. The fleet dashboard gallery app does this with a fixed-height indicator row above a filling table-and-chat row. output_widget()(Shiny Core) or a bare@render_panelfunction underui.card()(Express) is the same for Panel as for every other renderer.
Gotchas and limitations
- Panel templates aren’t supported, with a cryptic error.
pn.template.FastListTemplate(...)(or anyBaseTemplatesubclass) raisesAttributeError: 'FastListTemplate' object has no attribute 'get_root', verified on currentmain. This matches therender_paneldocstring’s advice (“Panel templates are full pages… use Shiny’s page layouts instead”), but the implementation doesn’t yet give a friendlier error for it – a long-standing rough edge, not a new regression. reactive_read()doesn’t work on Panel objects, and.widgetisn’t useful either. See Beyondparam():reactive_read()and.read()in Reacting to user interaction.- Call
pn.extension(...)for components that might first appear after the initial render (e.g., inside apn.bind()-driven conditional).shinywidgetscomputes a render’s extension bundle once per comm-open based on what’s referenced at that point; a component introduced later (without having been imported/declared viapn.extension) can render blank with only a browser console error and a server-log warning to go on. Declaringpn.extension("tabulator", "plotly", ...)for everything you might use, at import time, avoids this. - Build Panel objects inside your render function (or
server()), not at the top level of a Shiny Core app. A module-level widget is constructed once and shared by every visitor under Shiny Core (Shiny Express already re-runs top-level code per session, so this is automatic there). Testing this directly with two concurrent browser sessions against a module-levelpn.widgets.IntSlideron currentmaindid not reproduce the cross-session leak an earlier evaluation of this integration reported (dragging the slider in one session’s browser left the other session’s browser unaffected) – but build Panel objects per session anyway, since that’s the supported, tested pattern and the exact mechanism behind the old report’s finding wasn’t re-traced here. - Tabulator’s multi-select modifier key follows the browser’s reported platform, not your deployment server’s OS: Ctrl-click on Windows/Linux, Cmd-click on macOS. This is standard Tabulator behavior, not specific to Shiny.
render_panel.widgetis an internaljupyter_bokeh.BokehModel; don’t use it. Use.value, the Panel object exactly as you returned it, for everything – reading state, mutating it in place, and passing it to.param.watch().
Gallery candidates
gallery/template_tabulator_filter.py – a clean starting point: Shiny checkboxes filter a formatted Tabulator in place, and its row selection drives a render_plotly trend chart. Good base for any Panel-table-plus-chart dashboard.
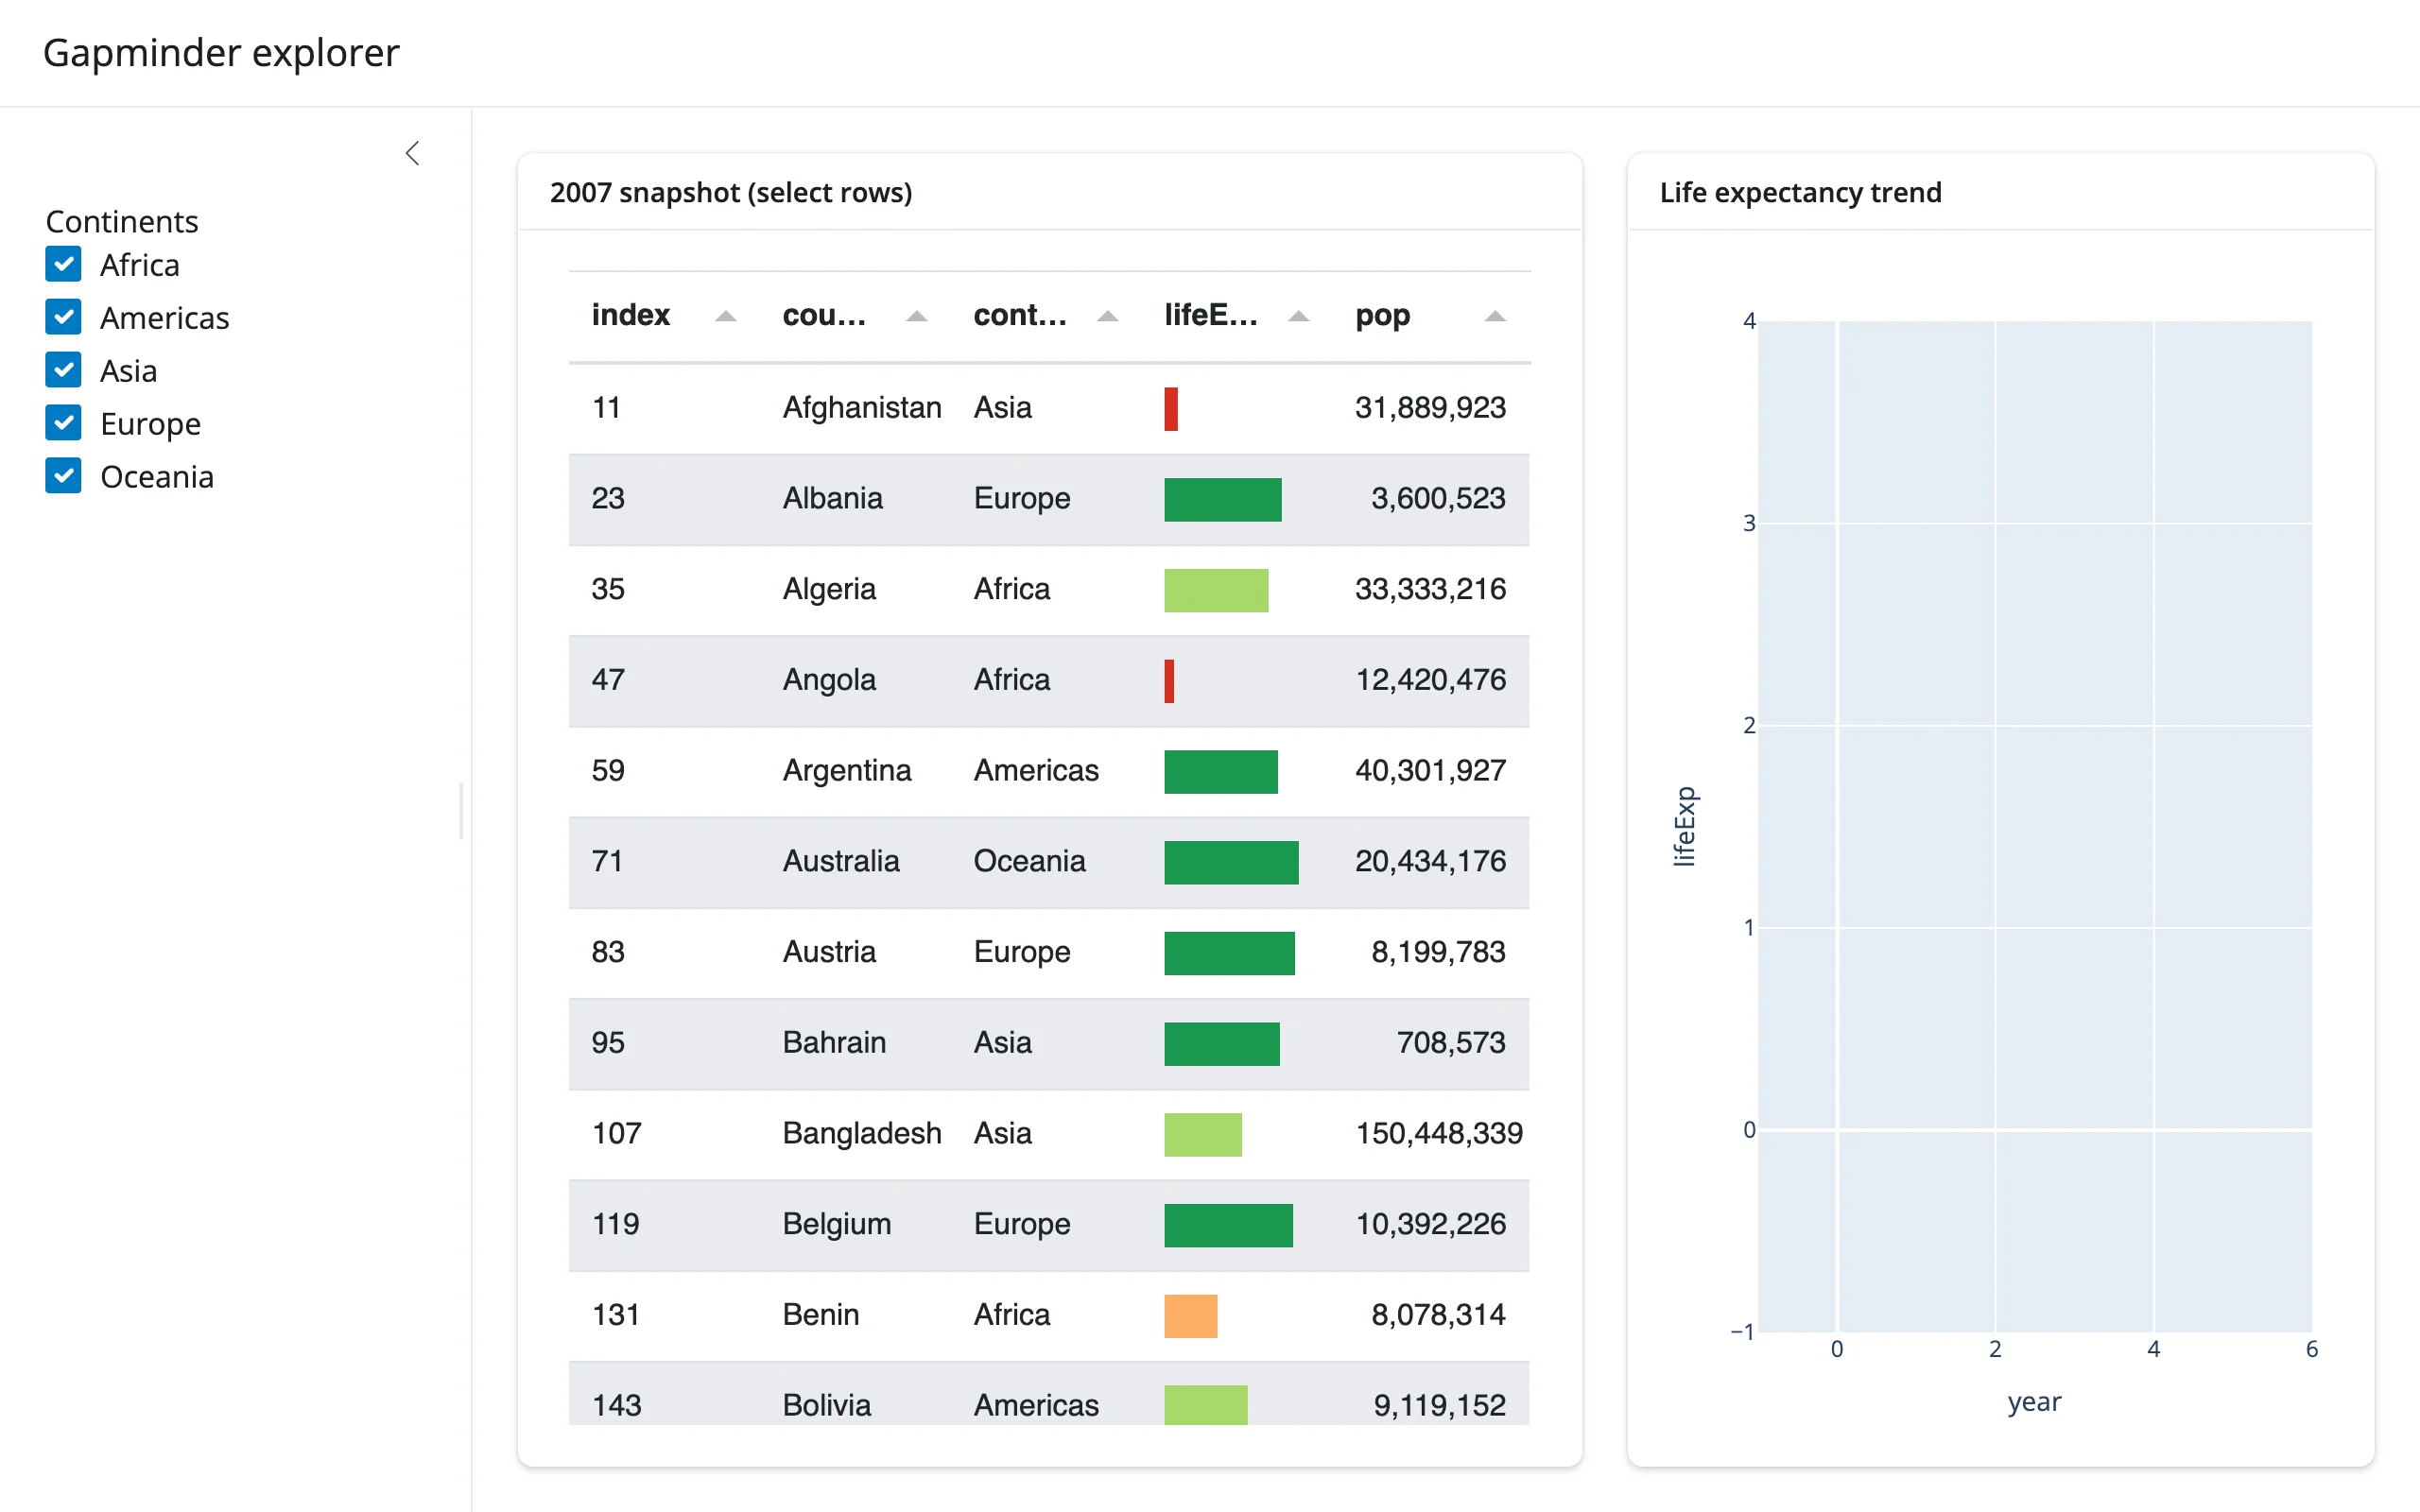
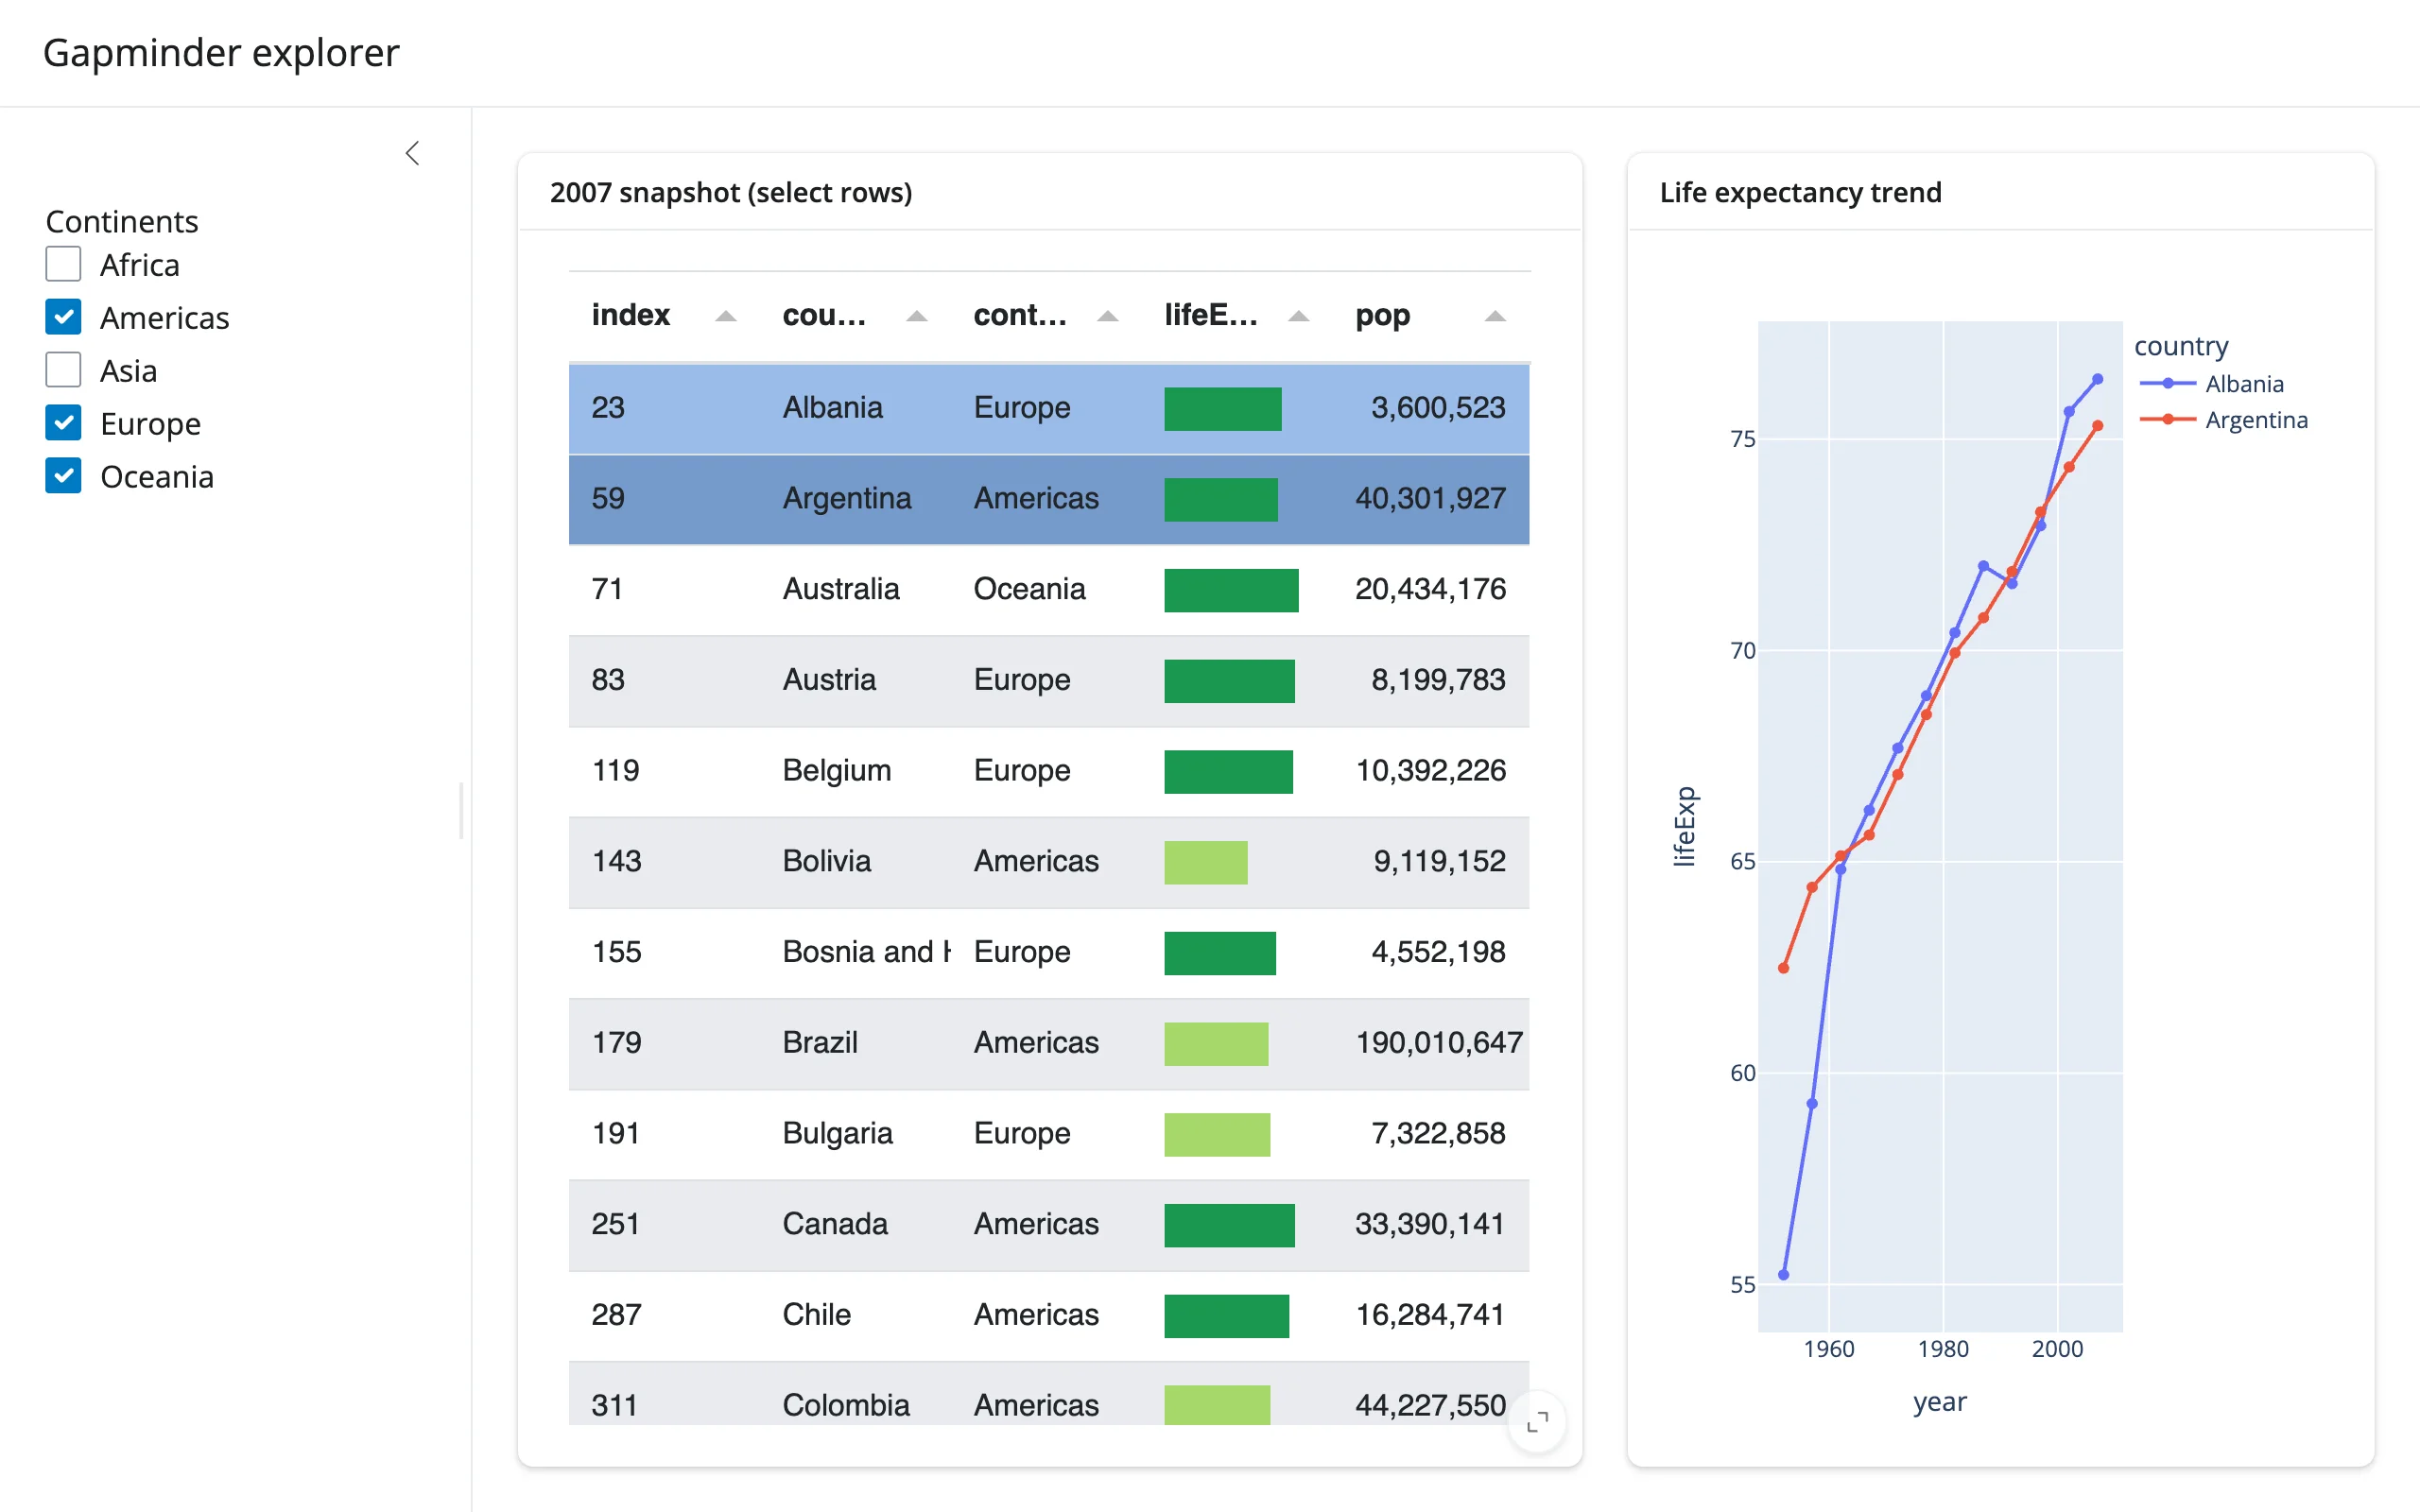
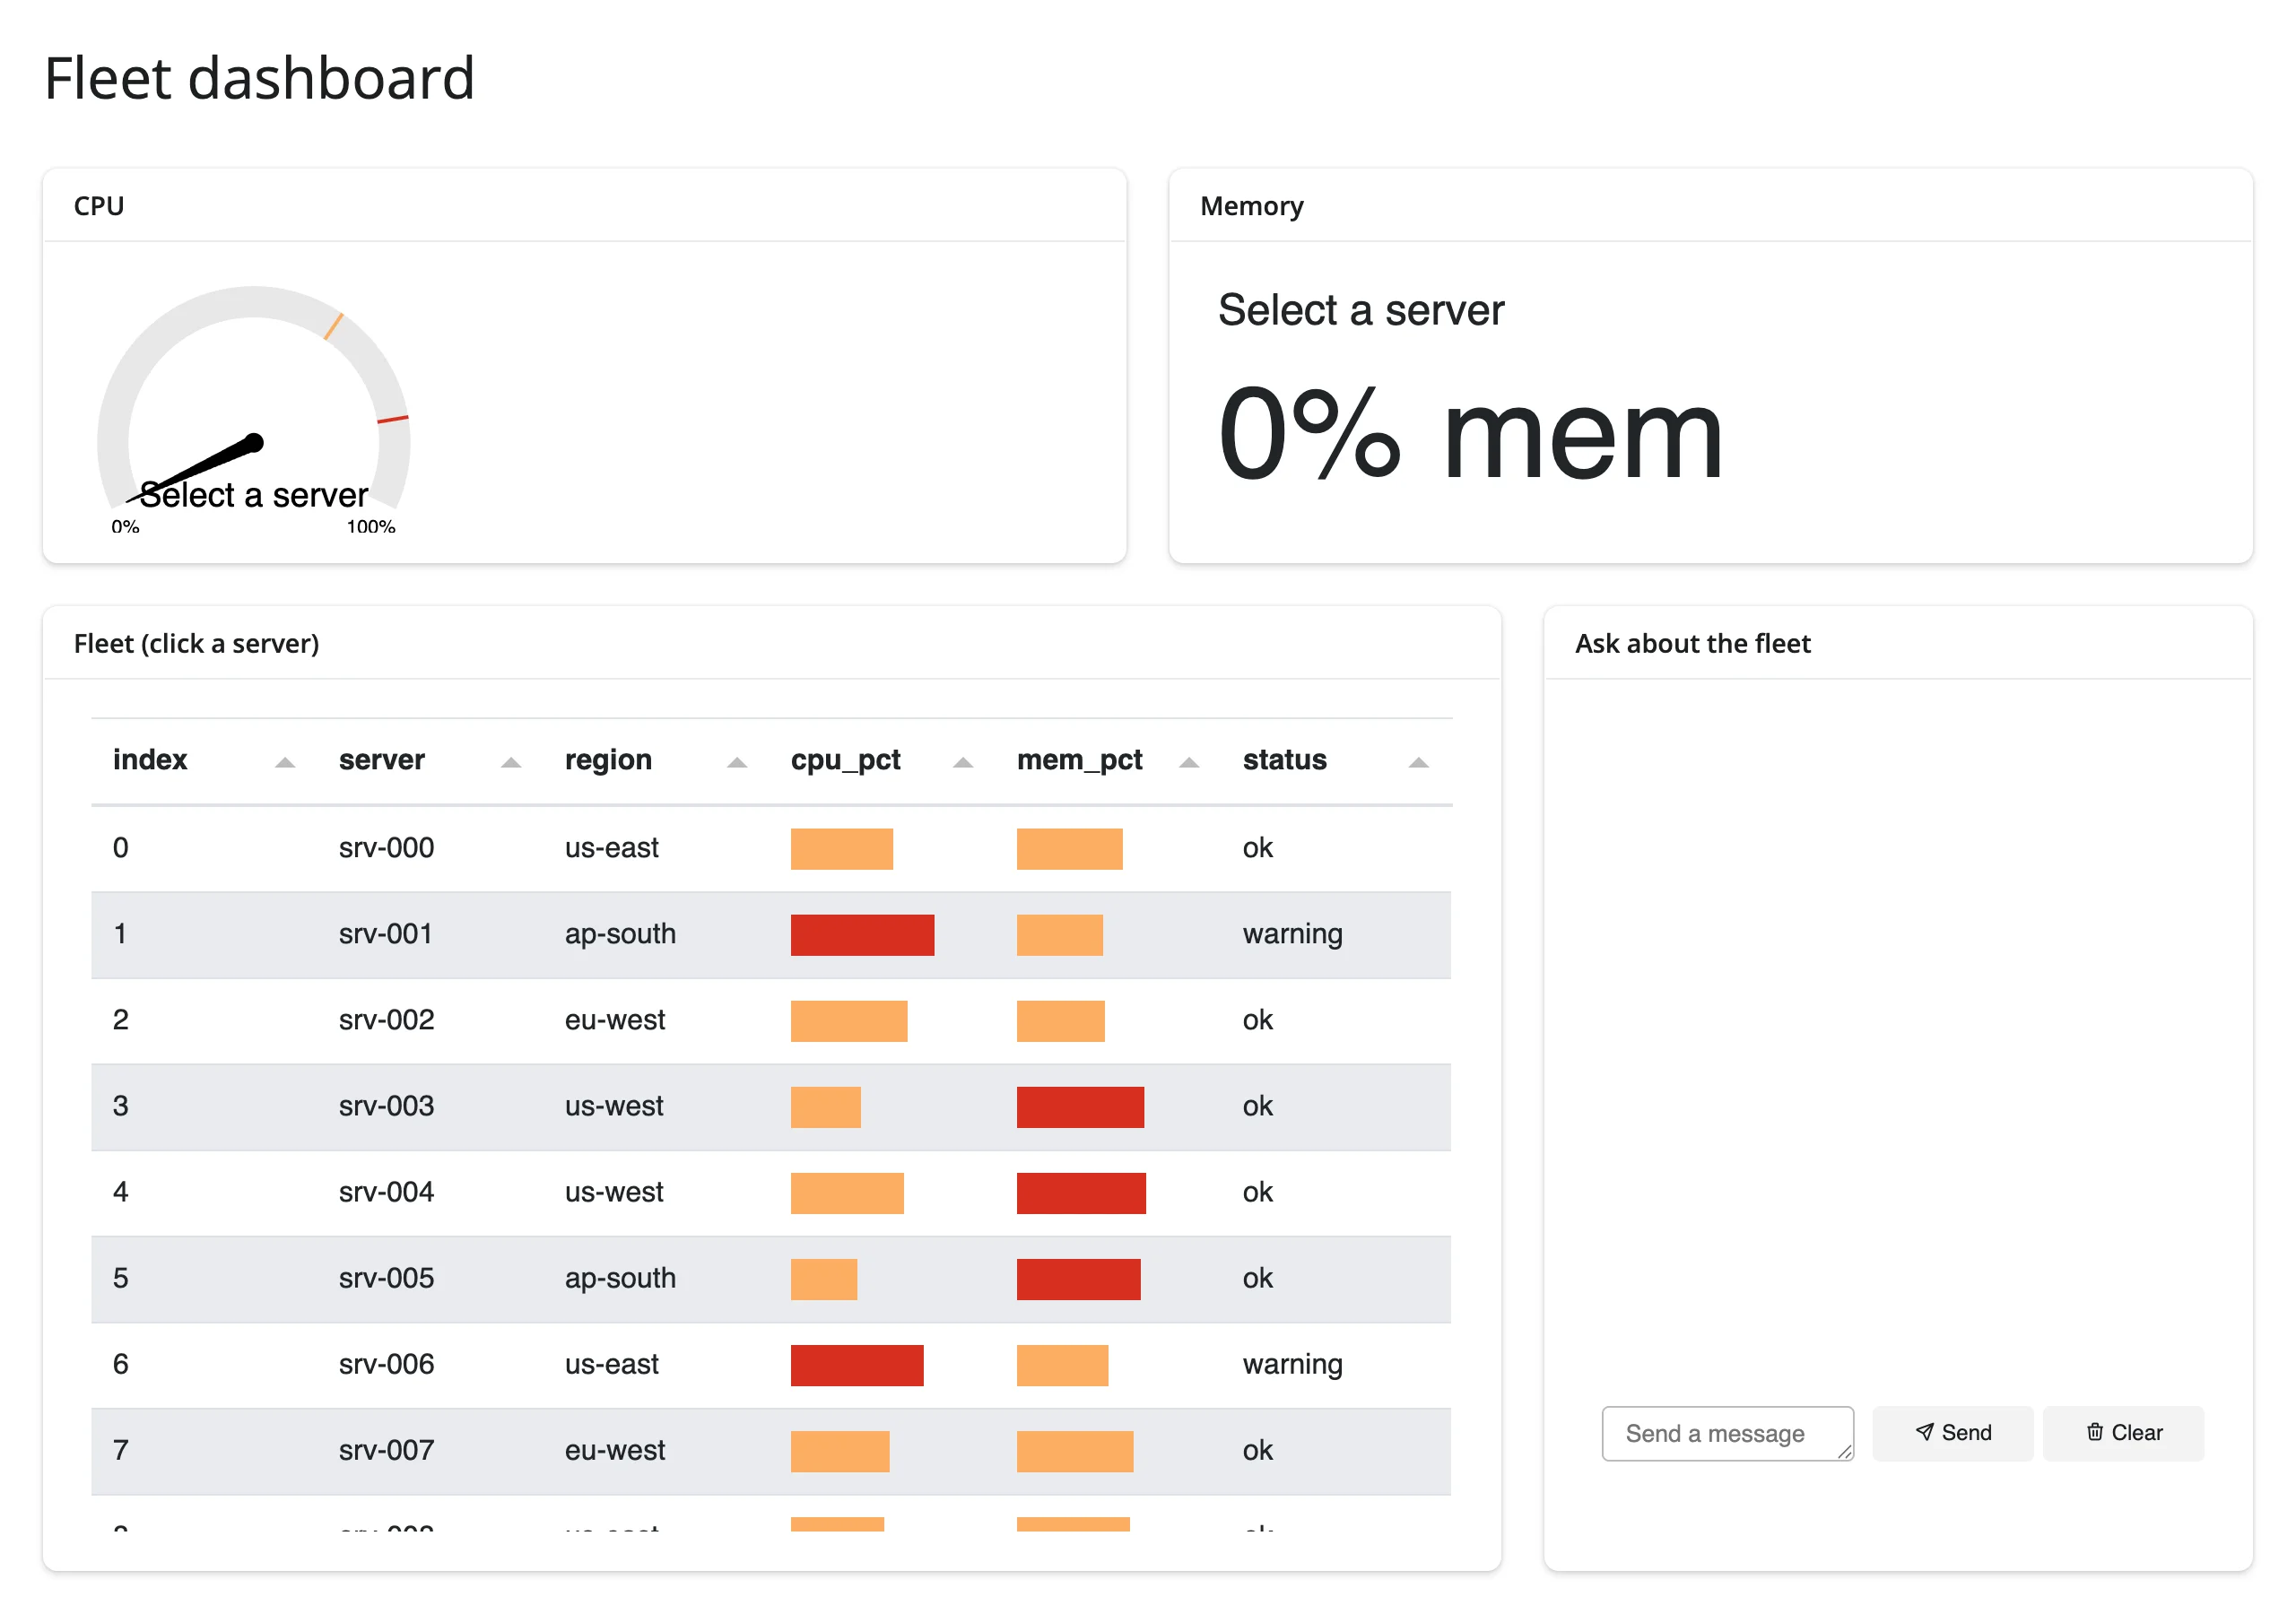
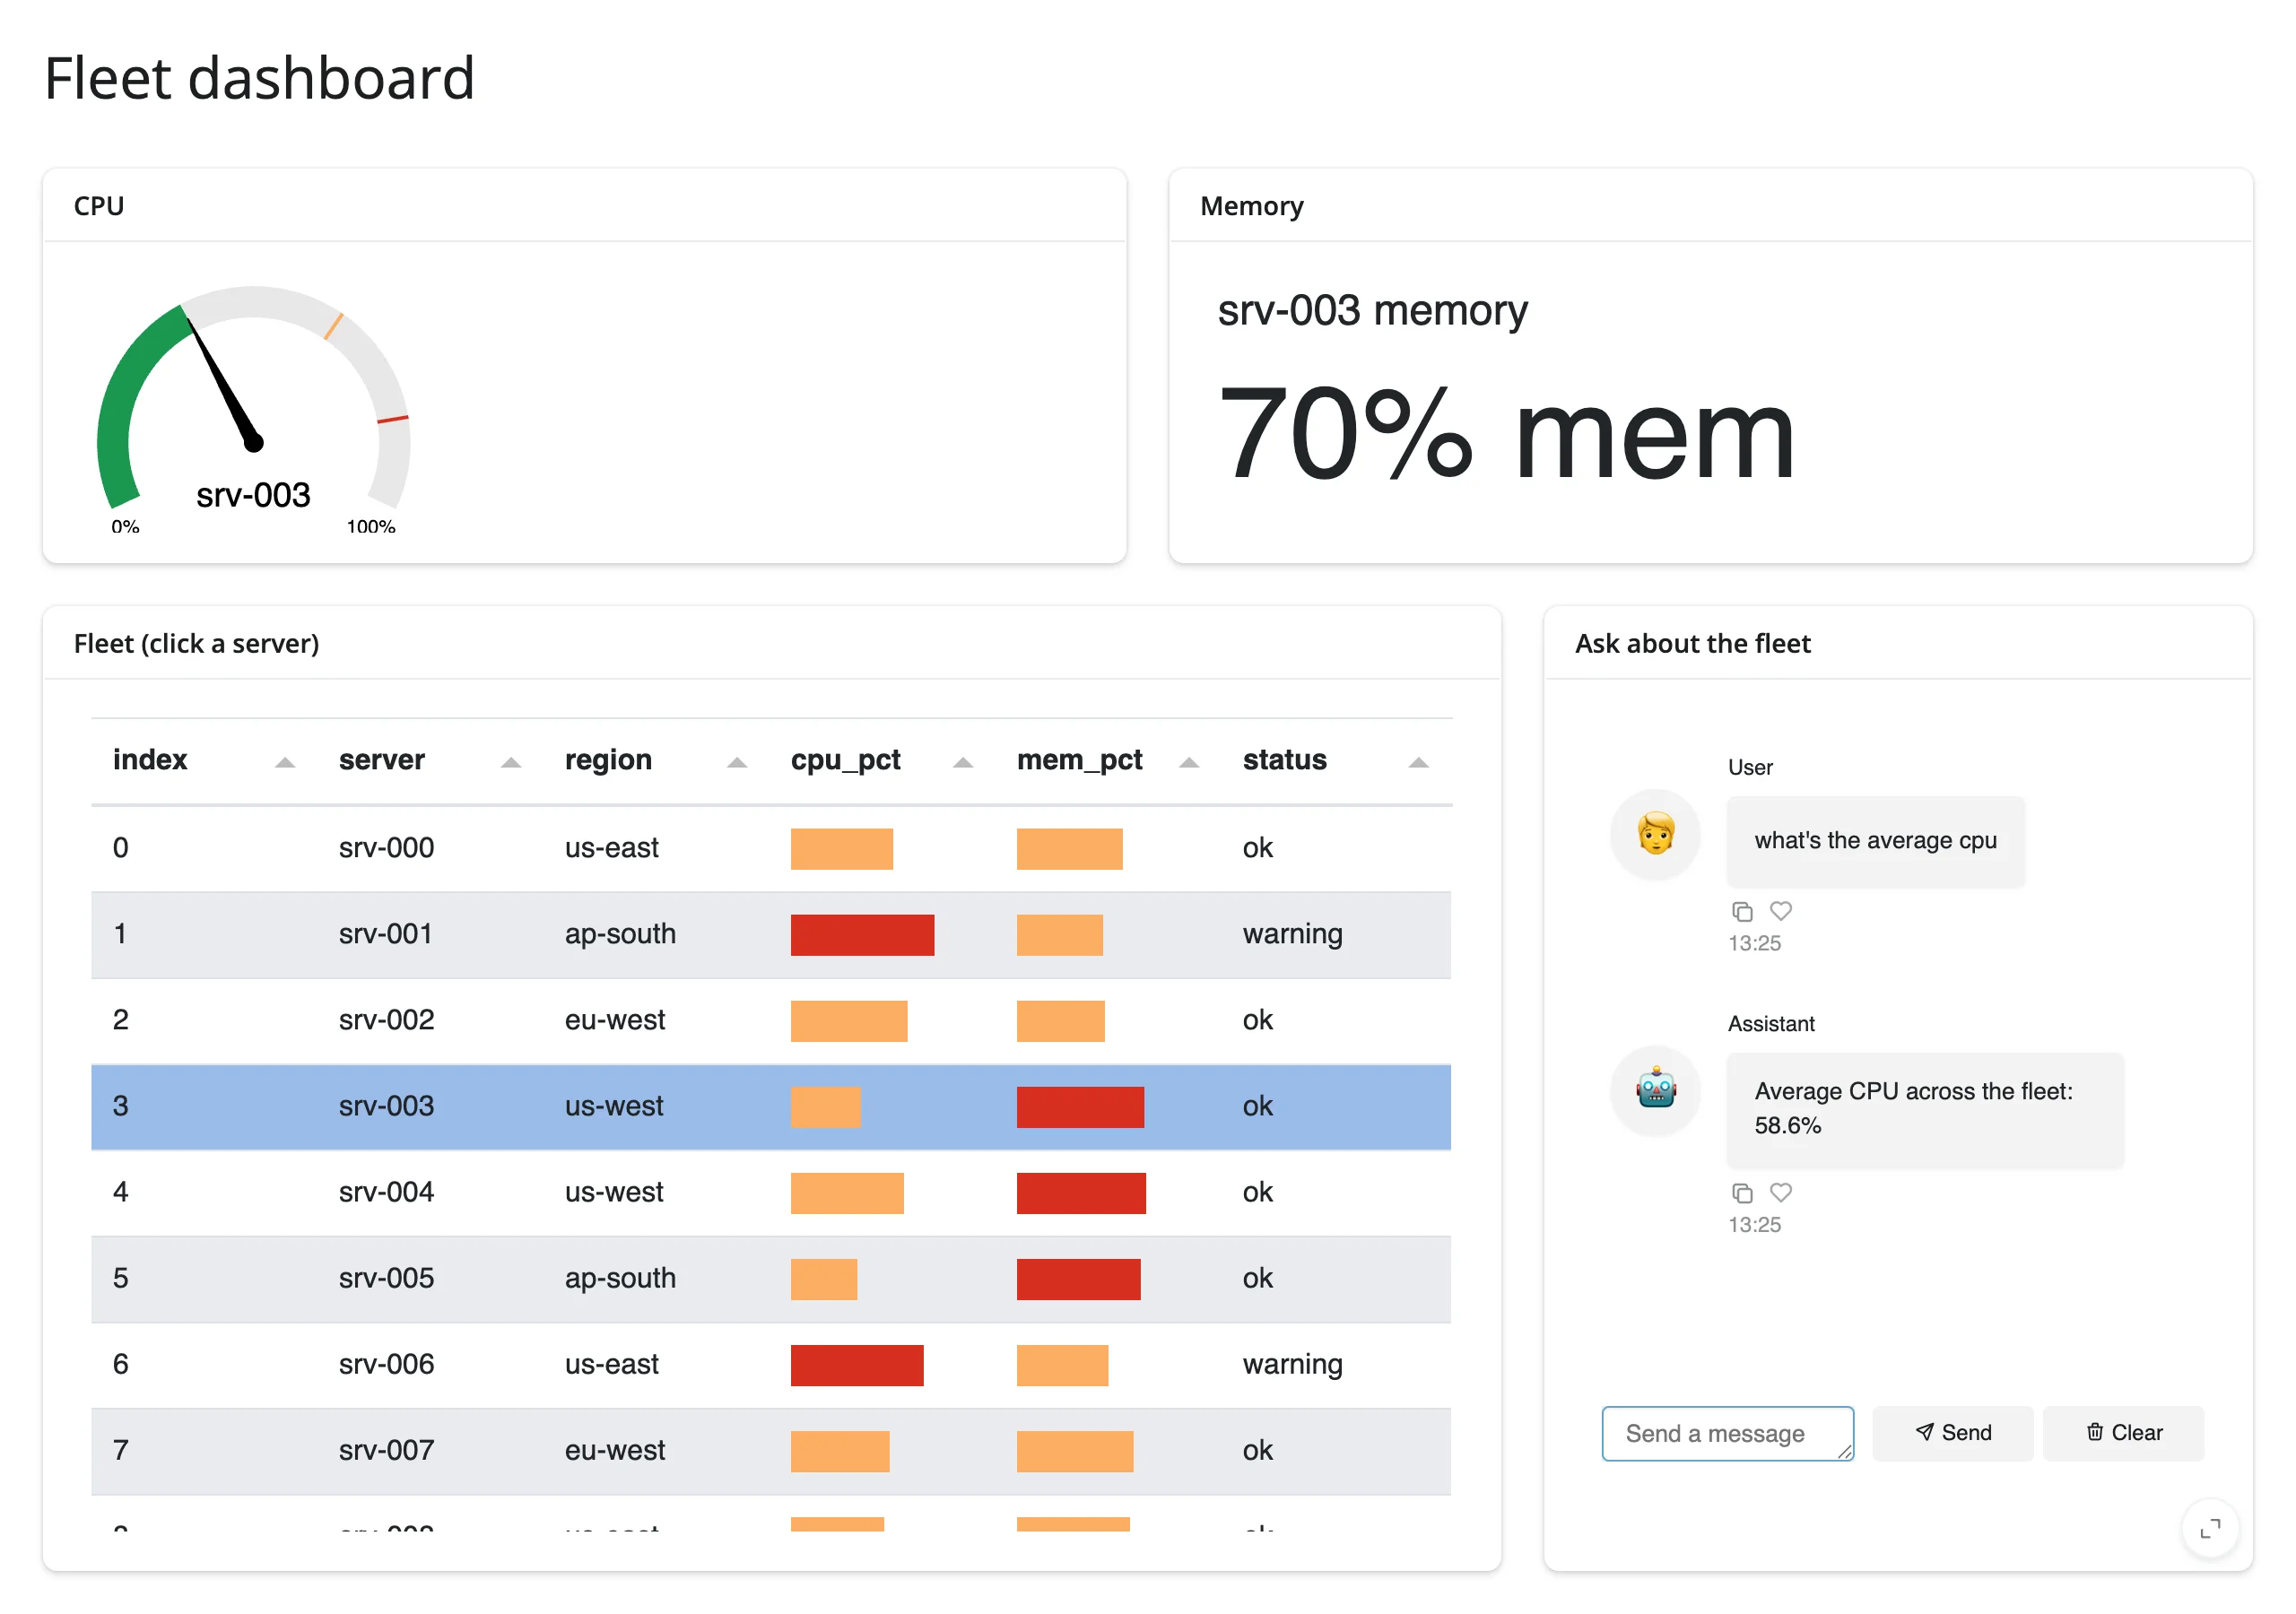
gallery/showcase_fleet_dashboard.py – a small ops dashboard combining three different Panel component families: a formatted Tabulator of (synthetic) servers, Dial/Number indicators that update in place when you click a row, and a pn.chat.ChatInterface that answers canned questions about the live data (critical-server count, average CPU, per-region counts).
Learn more
- Panel documentation and the component gallery
pn.chat,pn.indicators, andpn.custom.JSComponentreference pages- Related guides in this roster: bokeh, which renders through
jupyter_bokehtoo and has its own four accessors; holoviews, which also renders through Panel but has none (its interaction model is HoloViews’ own streams, notparamparameters on the rendered object); plotly, altair, and itables/ reactable for Shiny-native alternatives to Panel’s charting panes and Tabulator.