Any widget
Your widget isn’t on the list? Here’s how. Every other guide in this roster covers one library’s dedicated render_* decorator. This guide covers the decorator underneath all of them: render_widget, which renders any ipywidgets.Widget subclass, does no library-specific coercion, and has no accessors of its own. It’s the answer to three different questions: “the widget I want isn’t on the roster yet,” “I want to build my own interactive widget,” and “I just need a plain ipywidgets control.” All three go through the same decorator, because all three are, underneath, just an ipywidgets.Widget – a slider is one, anywidget’s AnyWidget base class is one, and ipyreact’s JSX components are one.
The decorator itself does very little: it coerces non-widget return values with the same as_widget() used everywhere else (so a plotly.graph_objects.Figure or an altair.Chart still renders, just without that library’s layout fixes or accessors), applies the same generic fill-sizing logic every renderer shares, and gives you .widget to mutate the live instance, plus .read("trait") to reactively read one of its traits (a documented shortcut for reactive_read(.widget, "trait")). Reach for a dedicated render_* instead whenever one exists for your library: it adds layout defaults tuned to that widget’s quirks, and usually a handful of accessors (clicked(), selected_rows(), …) that turn a raw trait into a documented, rate-limited, typed read. Reach for plain render_widget when there is no dedicated decorator (yet), or when you’re building a widget yourself and there’s nothing to be dedicated to.
Every example on this page is Shiny Express, where a render function displays itself wherever it’s defined. In Shiny Core, pair any renderer – render_widget or a dedicated one – with output_widget("id") in app_ui, the placeholder every renderer in this roster fills at render time; see Shiny Core & modules for a full app written both ways.
This guide is also the anywidget guide. If you’ve never built a custom ipywidget before, “What you can build” walks through a small, real one – a canvas sparkline – covering Python-to-JS trait sync, JS-to-Python trait sync, custom messages in both directions, a binary trait for bigger payloads, and the three ways to load a widget’s JavaScript. It also covers two third-party widgets that have no dedicated renderer yet (so render_widget is the only way to use them today), and ipyreact, a different way to write a custom widget entirely in JSX.
Installation
render_widget ships in base shinywidgets – no extra to install. The widgets used in this guide’s examples need their own packages: pip install anywidget ipyreact for the custom-widget and ipyreact sections (anywidget is already a shinywidgets dependency, so it’s normally already present), and, for the third-party examples, pip install mapwidget or pip install ipydeck.
Quick start
from ipywidgets import IntSlider
from shiny.express import render, ui
from shinywidgets import render_widget

ui.page_opts(title="render_widget quick start", fillable=True)

with ui.card():
    ui.card_header("Any ipywidgets.Widget subclass works, no coercion needed")

    @render_widget
    def slider():
        return IntSlider(value=7, min=0, max=10, description="Threshold:")

    @render.code
    def slider_val():
        return f"slider.read('value') = {slider.read('value')}"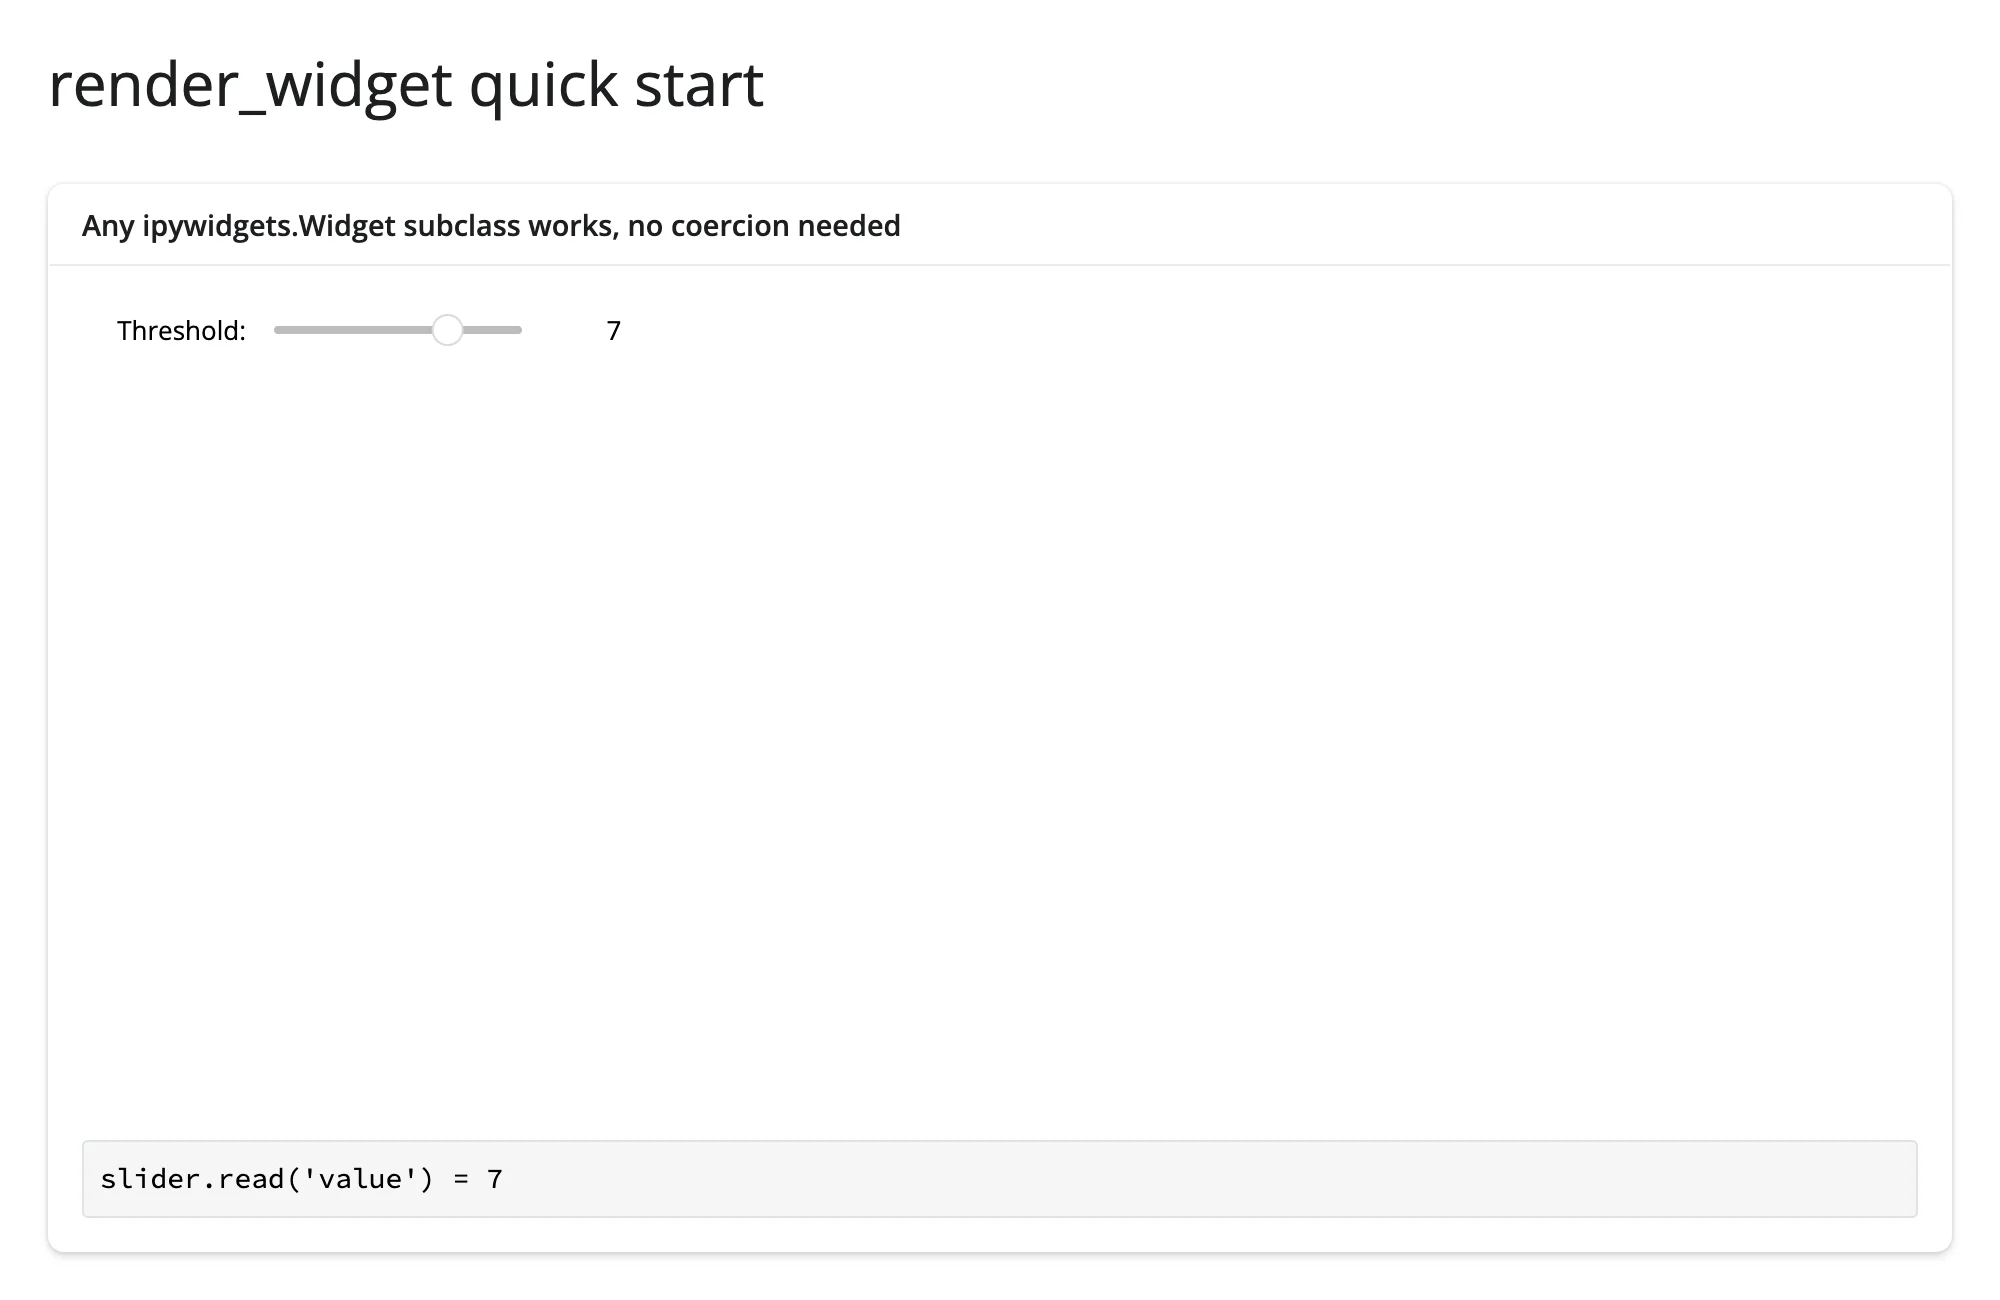
Any ipywidgets.Widget subclass – including every anywidget and ipyreact widget, since they’re built on the same base class – works with zero changes. slider.read('value') is a shortcut for reactive_read(slider.widget, 'value') – see Reacting to user interaction for when to reach for one over the other. The empty space below the slider is itself worth noticing: plain ipywidgets controls (sliders, dropdowns, checkboxes – anything shipped in @jupyter-widgets/controls) don’t get the fill-to-container treatment other renderers apply by default, so they render at their natural size instead of stretching. See Layout and sizing.
What you can build
Plain ipywidgets: composing controls without a Shiny input
Most of the time, reach for Shiny’s own ui.input_slider() instead of an ipywidgets.IntSlider – Shiny’s inputs are better integrated (styling, accessibility, validation) and don’t need .read()’s extra step. Plain ipywidgets controls earn their place in Shiny for a narrower case: porting an existing Jupyter interactive_output()-style dashboard, or composing several linked widgets into one self-contained unit where the wiring lives in widget-land, not in Shiny’s reactive graph.
import ipywidgets as widgets
from shiny.express import render, ui
from shinywidgets import reactive_read, render_widget

ui.page_opts(title="Composing plain ipywidgets", fillable=True)

with ui.card():
    ui.card_header("A self-contained ipywidgets dashboard (interactive_output)")

    @render_widget
    def panel():
        x = widgets.IntSlider(description="x", min=0, max=20, value=4)
        y = widgets.IntSlider(description="y", min=0, max=20, value=6)
        out = widgets.Label()

        def show_sum(*_):
            out.value = f"x + y = {x.value + y.value}"

        for w in (x, y):
            w.observe(show_sum, "value")
        show_sum()

        return widgets.VBox([x, y, out])

with ui.card():
    ui.card_header("Shiny still sees inside it: reactive_read() on a child widget")

    @render.code
    def x_value():
        x = panel.widget.children[0]
        return f"x.value = {reactive_read(x, 'value')}"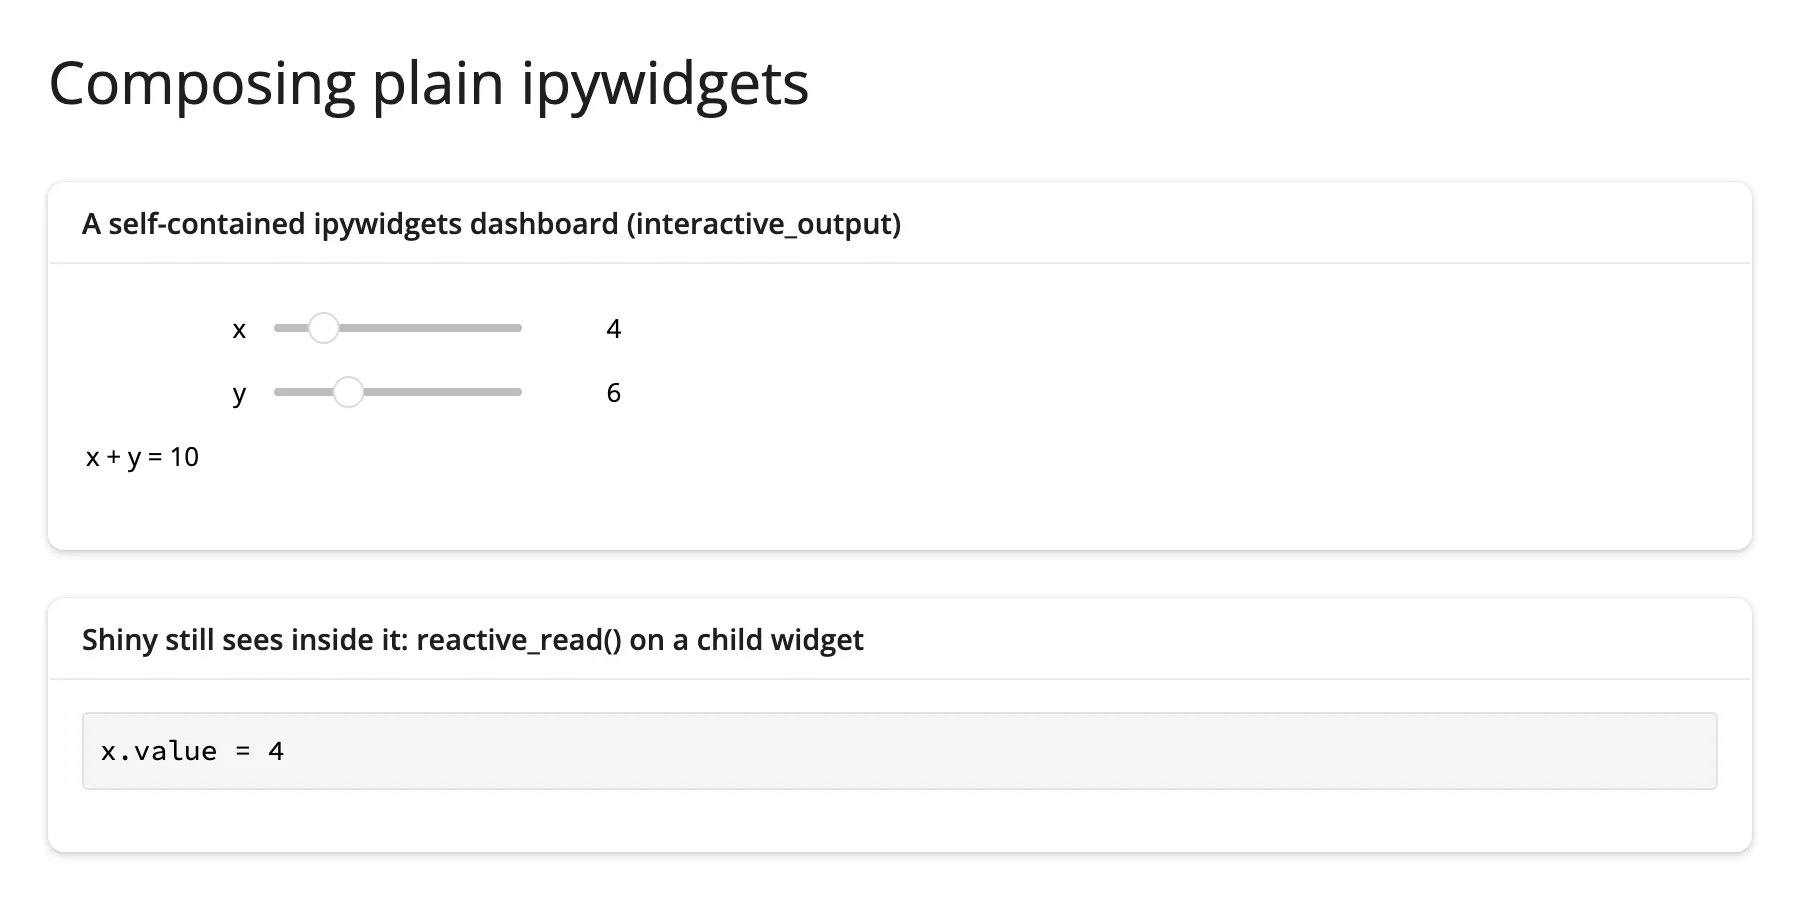
The two sliders stay in sync with the label entirely through their own .observe() callback – no Shiny reactivity involved – while reactive_read() on a child widget (panel.widget.children[0]) still lets Shiny watch one piece of it. (with out: print(...) inside an ipywidgets.Output() writes to the server’s own process stdout, not into the widget – there’s no live Jupyter kernel here for it to hook into. Use out.append_stdout(...)/out.append_display_data(...) instead, which write directly to the widget’s state the same way any other trait sync does; a plain Label with a .value assignment, as used here, is an even simpler option when you don’t need Output’s own API – see Gotchas.)
anywidget, the star
anywidget is the modern way to write a custom ipywidget: one Python class, a JS _esm string (or file, or CDN import) implementing a render({ model, el }) function, and optionally _css. No build step, no npm, no bundler. Every trait you declare with .tag(sync=True) is automatically kept in sync between Python and the browser in both directions.
The rest of this section builds one small widget – a canvas sparkline – and uses it to demonstrate every piece of the anywidget contract. The full widget (shown once, in full, below) is defined in a shared module, examples/sparkline_widget.py, so each example that follows can import it and stay short:
# A small, hand-written anywidget used by several examples in this guide
# (03_anywidget_trait_sync.py, 04_anywidget_messages.py, 07_accessor_helper.py,
# 11_coordinate_brush_to_table.py, 12_coordinate_table_to_widget.py). Defined
# once here so each example stays short; none of this file is Shiny-specific
# -- it is exactly what you'd write for plain Jupyter too.
from __future__ import annotations

import anywidget
import traitlets

_JS = r"""
function render({ model, el }) {
  const canvas = document.createElement("canvas");
  canvas.width = 320;
  canvas.height = 90;
  // shinywidgets gives a fill output's direct child `flex: 1 1 auto` so
  // generic (e.g. <div>-based) widgets stretch to fill their card. A
  // <canvas>'s width/height ATTRIBUTES (its drawing-buffer resolution)
  // don't count as a CSS size for that purpose, so without an explicit
  // style.width/height a canvas gets stretched to fill the card while its
  // pixel buffer stays at 320x90 -- a blurry, upscaled line. Pinning the
  // CSS size to match keeps it crisp (see "Layout and sizing" in the
  // guide for the fill-aware alternative: a ResizeObserver that redraws at
  // the new size).
  canvas.style.width = canvas.width + "px";
  canvas.style.height = canvas.height + "px";
  canvas.style.cursor = "pointer";
  el.appendChild(canvas);
  const ctx = canvas.getContext("2d");

  function draw() {
    const values = model.get("values");
    const highlight = model.get("highlight") || [];
    ctx.clearRect(0, 0, canvas.width, canvas.height);
    if (values.length < 2) return;
    const min = Math.min(...values);
    const max = Math.max(...values);
    const span = max - min || 1;
    const xy = (i) => [
      (i / (values.length - 1)) * canvas.width,
      canvas.height - ((values[i] - min) / span) * (canvas.height - 10) - 5,
    ];

    ctx.beginPath();
    values.forEach((_, i) => {
      const [x, y] = xy(i);
      i === 0 ? ctx.moveTo(x, y) : ctx.lineTo(x, y);
    });
    ctx.strokeStyle = "#2a6f97";
    ctx.lineWidth = 2;
    ctx.stroke();

    // Rows in `highlight` (e.g. a linked table's selection) get a dot.
    highlight.forEach((i) => {
      if (i < 0 || i >= values.length) return;
      const [x, y] = xy(i);
      ctx.beginPath();
      ctx.arc(x, y, 5, 0, 2 * Math.PI);
      ctx.fillStyle = "#e85d04";
      ctx.fill();
    });
  }

  // Python -> JS: redraw whenever `values` or `highlight` changes, in place
  // (no new widget, no re-sent JS bundle -- see "Updating the widget from
  // Python" in the guide).
  model.on("change:values", draw);
  model.on("change:highlight", draw);

  // JS -> Python: a click (or a drag -- see mousemove below) reports the
  // nearest point's index via a synced trait. `save_changes()` is what
  // actually flushes the `model.set()` call to Python;
  // `spark.read("clicked_index")` on the Python side picks it up (see
  // "Reacting to user interaction").
  // The canvas's CSS size (it stretches to fill its card) differs from its
  // drawing-buffer size (canvas.width/height, used by draw() above), so
  // input handlers must convert through the rendered bounding box, not the
  // intrinsic pixel size.
  function indexAt(e) {
    const values = model.get("values");
    const rect = canvas.getBoundingClientRect();
    const frac = (e.clientX - rect.left) / rect.width;
    const i = Math.round(frac * (values.length - 1));
    return Math.max(0, Math.min(values.length - 1, i));
  }
  function reportNearest(e) {
    model.set("clicked_index", indexAt(e));
    model.save_changes();
  }
  canvas.addEventListener("click", reportNearest);

  // A held-down drag reports a rapid stream of updates -- used by the rate
  // limiting example to compare an unthrottled vs. a debounced reader. It
  // also reports the drag's start..end index range as `brush` once released
  // -- used by the "coordinating multiple views" brush-to-table example.
  let dragStart = null;
  canvas.addEventListener("mousedown", (e) => (dragStart = indexAt(e)));
  window.addEventListener("mouseup", (e) => {
    if (dragStart === null) return;
    const end = indexAt(e);
    model.set("brush", [Math.min(dragStart, end), Math.max(dragStart, end)]);
    model.save_changes();
    dragStart = null;
  });
  canvas.addEventListener("mousemove", (e) => {
    if (dragStart !== null) reportNearest(e);
  });

  // Custom messages, JS -> Python: model.send() for a one-off event that
  // isn't really "state" (see "Custom messages" in the guide).
  canvas.addEventListener("dblclick", () => {
    model.send({ type: "reset-requested" });
  });

  // Custom messages, Python -> JS: widget.send() on the Python side arrives
  // here as a "msg:custom" model event.
  model.on("msg:custom", (msg) => {
    if (msg.type === "flash") {
      canvas.style.filter = "brightness(1.6)";
      setTimeout(() => {
        canvas.style.filter = "";
      }, 200);
    }
  });

  draw();
}
export default { render };
"""

_CSS = """
.sparkline-widget canvas { display: block; }
"""


class Sparkline(anywidget.AnyWidget):
    """A tiny canvas line chart. See sparkline_widget.py for the full source."""

    _esm = _JS
    _css = _CSS
    values = traitlets.List(traitlets.Float()).tag(sync=True)
    highlight = traitlets.List(traitlets.Int()).tag(sync=True)
    clicked_index = traitlets.Int(allow_none=True, default_value=None).tag(sync=True)
    brush = traitlets.List(traitlets.Int()).tag(sync=True)


class BinarySparkline(anywidget.AnyWidget):
    """
    Same chart, but `values` is a packed float32 buffer (`numpy.ndarray.tobytes()`)
    instead of a JSON list -- see 05_anywidget_binary_trait.py.
    """

    _esm = r"""
    function render({ model, el }) {
      const canvas = document.createElement("canvas");
      canvas.width = 320;
      canvas.height = 90;
      // See the matching comment in Sparkline's _esm above: pin the CSS size
      // to the drawing-buffer size so the fill layout can't stretch (and
      // blur) this canvas.
      canvas.style.width = canvas.width + "px";
      canvas.style.height = canvas.height + "px";
      el.appendChild(canvas);
      const ctx = canvas.getContext("2d");

      function draw() {
        // A `Bytes` trait arrives as a DataView; read it as float32.
        const buf = model.get("values");
        const values = new Float32Array(buf.buffer, buf.byteOffset, buf.byteLength / 4);
        ctx.clearRect(0, 0, canvas.width, canvas.height);
        if (values.length < 2) return;
        let min = Infinity, max = -Infinity;
        for (const v of values) { if (v < min) min = v; if (v > max) max = v; }
        const span = max - min || 1;
        ctx.beginPath();
        values.forEach((v, i) => {
          const x = (i / (values.length - 1)) * canvas.width;
          const y = canvas.height - ((v - min) / span) * (canvas.height - 10) - 5;
          i === 0 ? ctx.moveTo(x, y) : ctx.lineTo(x, y);
        });
        ctx.strokeStyle = "#9d4edd";
        ctx.lineWidth = 1.5;
        ctx.stroke();
      }
      model.on("change:values", draw);
      draw();
    }
    export default { render };
    """
    _css = _CSS
    values = traitlets.Bytes().tag(sync=True)
examples/sparkline_widget.py – the complete shared module, used by 03_anywidget_trait_sync.py, 04_anywidget_messages.py, 07_accessor_helper.py, 11_coordinate_brush_to_table.py, and 12_coordinate_table_to_widget.py (Sparkline), and 05_anywidget_binary_trait.py (BinarySparkline, below).
Python -> JS trait sync, in place
import numpy as np
from shiny import reactive
from shiny.express import input, render, ui
from shinywidgets import render_widget

from sparkline_widget import Sparkline

ui.page_opts(title="anywidget: trait sync both ways", fillable=True)
ui.input_action_button("new_data", "New random walk")

with ui.layout_columns(col_widths=[7, 5]):
    with ui.card():
        ui.card_header("Click the line -- JS reports the nearest point to Python")

        @render_widget
        def spark():
            rng = np.random.default_rng(1)
            return Sparkline(values=list(rng.normal(size=40).cumsum()))

        # Python -> JS: a NEW `values` list is pushed into the SAME widget
        # instance (spark.widget), so the canvas redraws in place -- no
        # re-render, no new comm, no re-sent JS bundle.
        @reactive.effect
        @reactive.event(input.new_data)
        def _new_walk():
            rng = np.random.default_rng()
            spark.widget.values = list(rng.normal(size=40).cumsum())

    with ui.card():
        ui.card_header('spark.read("clicked_index")')

        @render.code
        def clicked_out():
            idx = spark.read("clicked_index")
            return "click the sparkline" if idx is None else f"clicked index: {idx}"
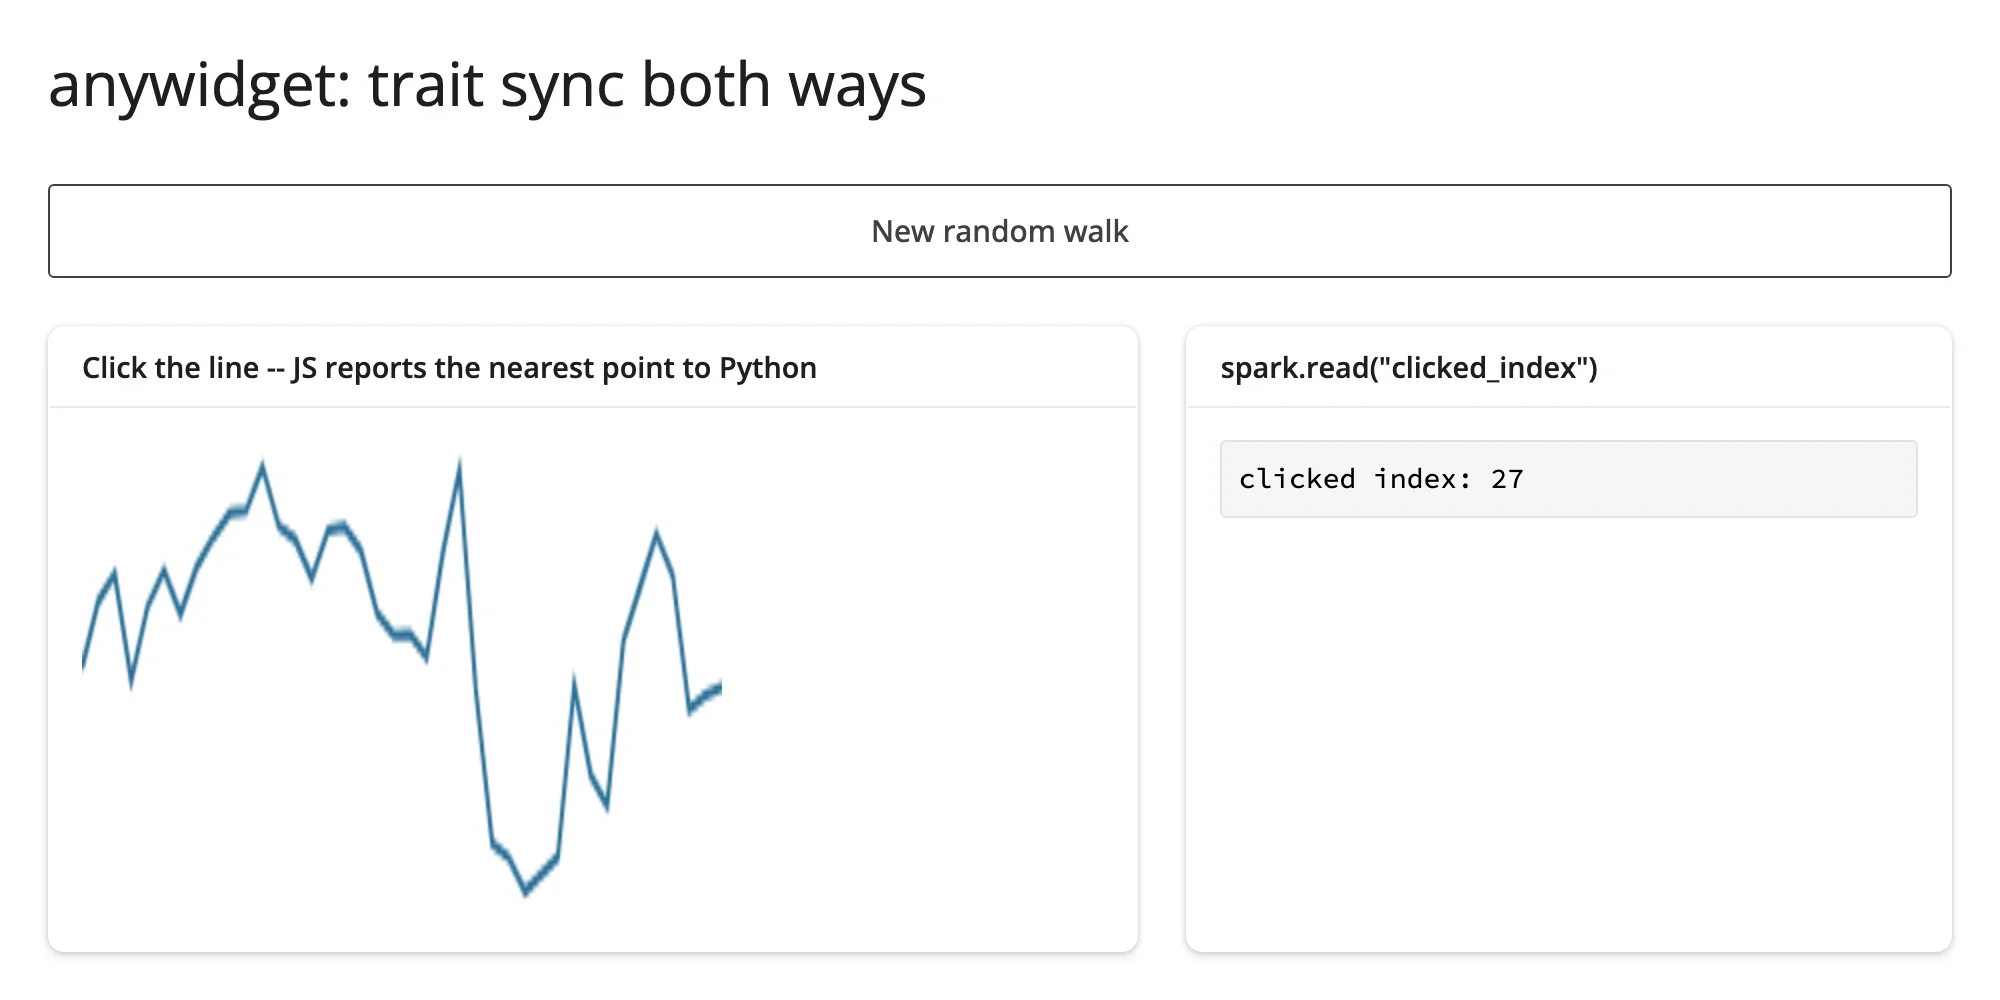
Clicking the line reports the nearest point’s index back to Python immediately:
Clicking “New random walk” pushes a fresh values list into the same widget instance – the line redraws with a different shape, with no re-render and no new JS bundle sent:
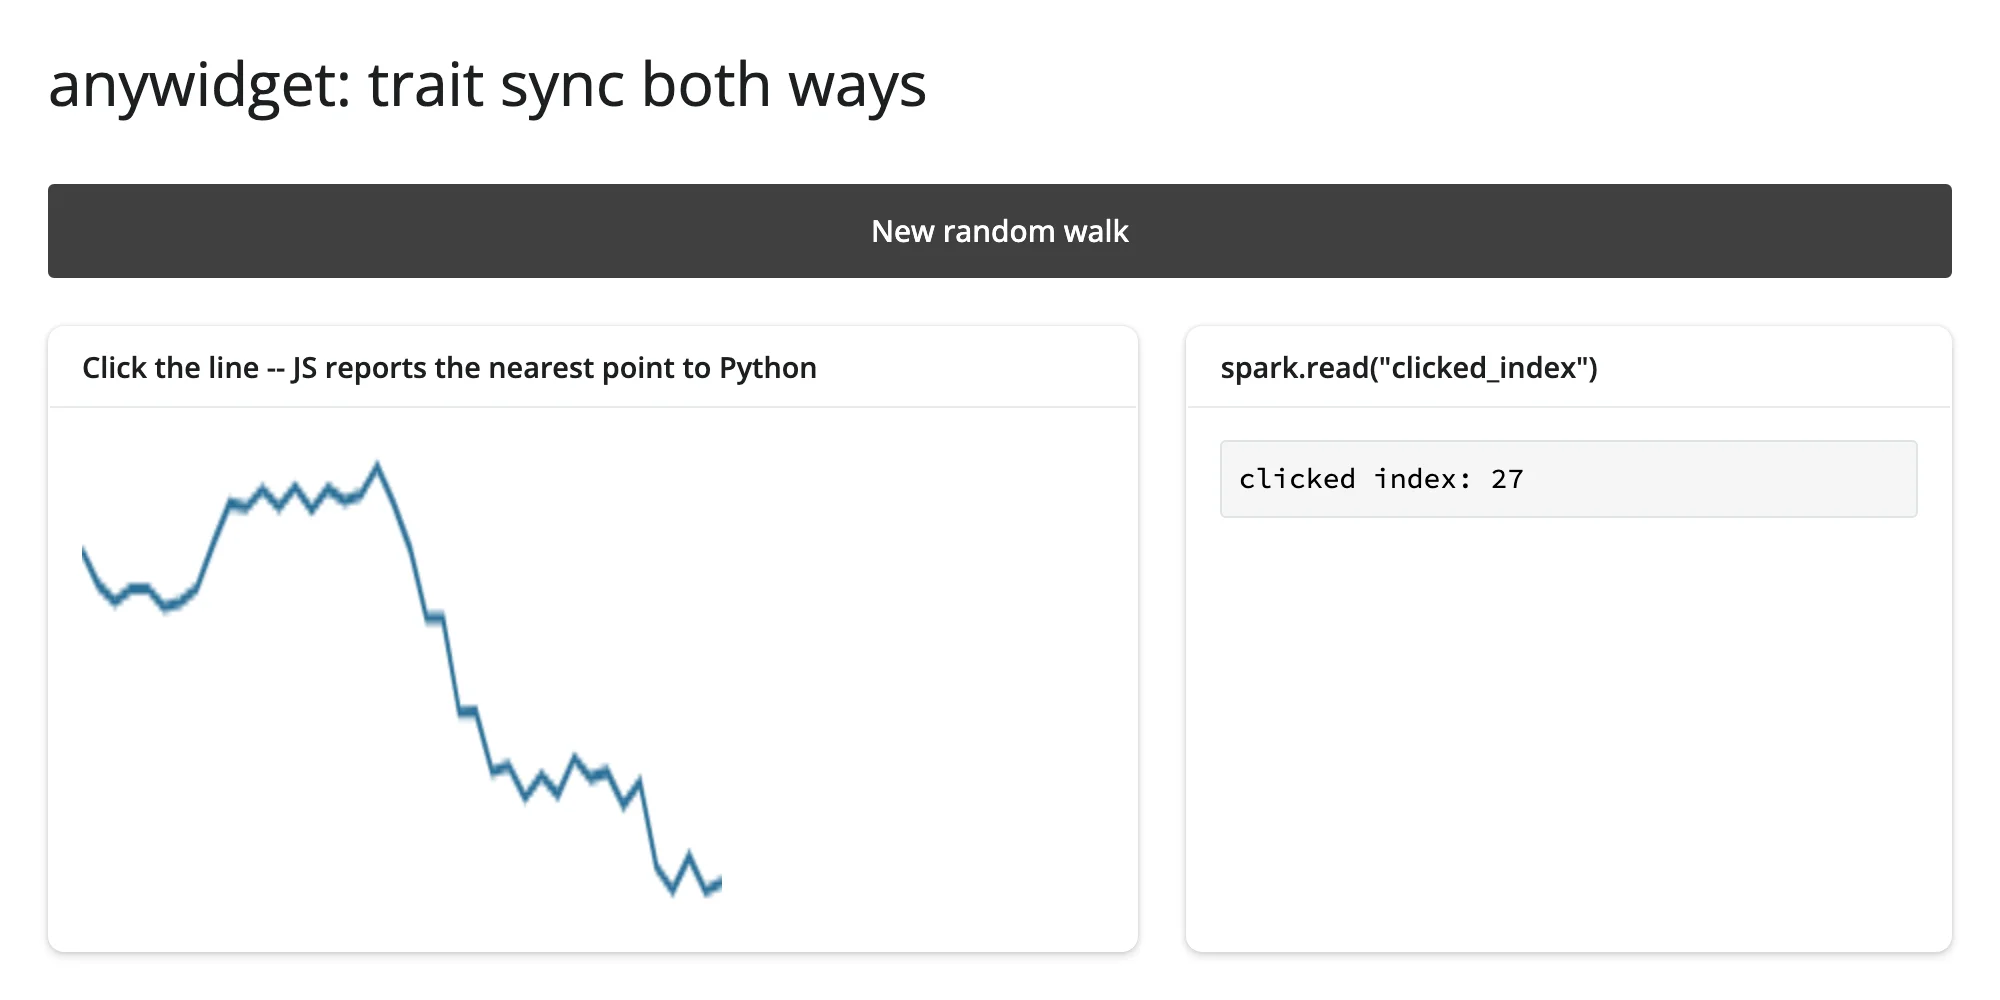
This is the whole anywidget trait-sync contract: model.get("values")/model.on("change:values", ...) on the JS side, and plain attribute assignment (spark.widget.values = ...) on the Python side – the same mechanism every built-in widget in the roster uses internally.
JS -> Python: model.set() + save_changes()
The click handler above already showed this: model.set("clicked_index", i) followed by model.save_changes() is what actually flushes a browser-side change back to Python. save_changes() is easy to forget – without it, model.set() only updates the browser’s local copy of the trait, and Python never sees it. Once it’s called, spark.read("clicked_index") on the Python side behaves exactly like reading any other synced trait of the rendered widget.
Custom messages, both directions
Not everything worth sending is a trait. A one-off instruction (“flash the line”) or event (“the user asked to reset”) doesn’t need to be remembered as state – model.send() (JS -> Python) and widget.send() (Python -> JS) are the message-passing escape hatch, paired with widget.on_msg() (Python) and model.on("msg:custom", ...) (JS).
import numpy as np
from shiny import reactive
from shiny.express import input, render, ui
from shinywidgets import render_widget

from sparkline_widget import Sparkline

ui.page_opts(title="anywidget: custom messages both ways", fillable=True)
ui.input_action_button("flash", "Flash the line (Python -> JS message)")
ui.markdown("Double-click the line to send a message the other way (JS -> Python).")

with ui.layout_columns(col_widths=[7, 5]):
    with ui.card():

        @render_widget
        def spark():
            rng = np.random.default_rng(2)
            return Sparkline(values=list(rng.normal(size=40).cumsum()))

        # Python -> JS, a custom message: `widget.send(...)` arrives in JS as
        # a "msg:custom" event (see sparkline_widget.py). A widget gets a
        # placeholder comm until the first post-render flush opens the real
        # one; a send made before then -- even from inside the render
        # function itself -- queues on that placeholder and is delivered, in
        # order, once the real comm opens, so it's never lost (see "Reacting
        # to user interaction" in the guide). The button click here is just
        # this toy app's trigger for "flash on demand," not a workaround.
        @reactive.effect
        @reactive.event(input.flash)
        def _flash():
            spark.widget.send({"type": "flash"})

    with ui.card():
        ui.card_header("Messages received from the widget")

        reset_count = reactive.value(0)

        @reactive.effect
        def _wire_on_msg():
            def _on_msg(widget, content, buffers):
                if content.get("type") == "reset-requested":
                    reset_count.set(reset_count() + 1)

            spark.widget.on_msg(_on_msg)

        @render.code
        def resets_out():
            idx = spark.read("clicked_index")
            return (
                f"clicks so far (via trait): {idx}\n"
                f"double-click messages received: {reset_count()}"
            )
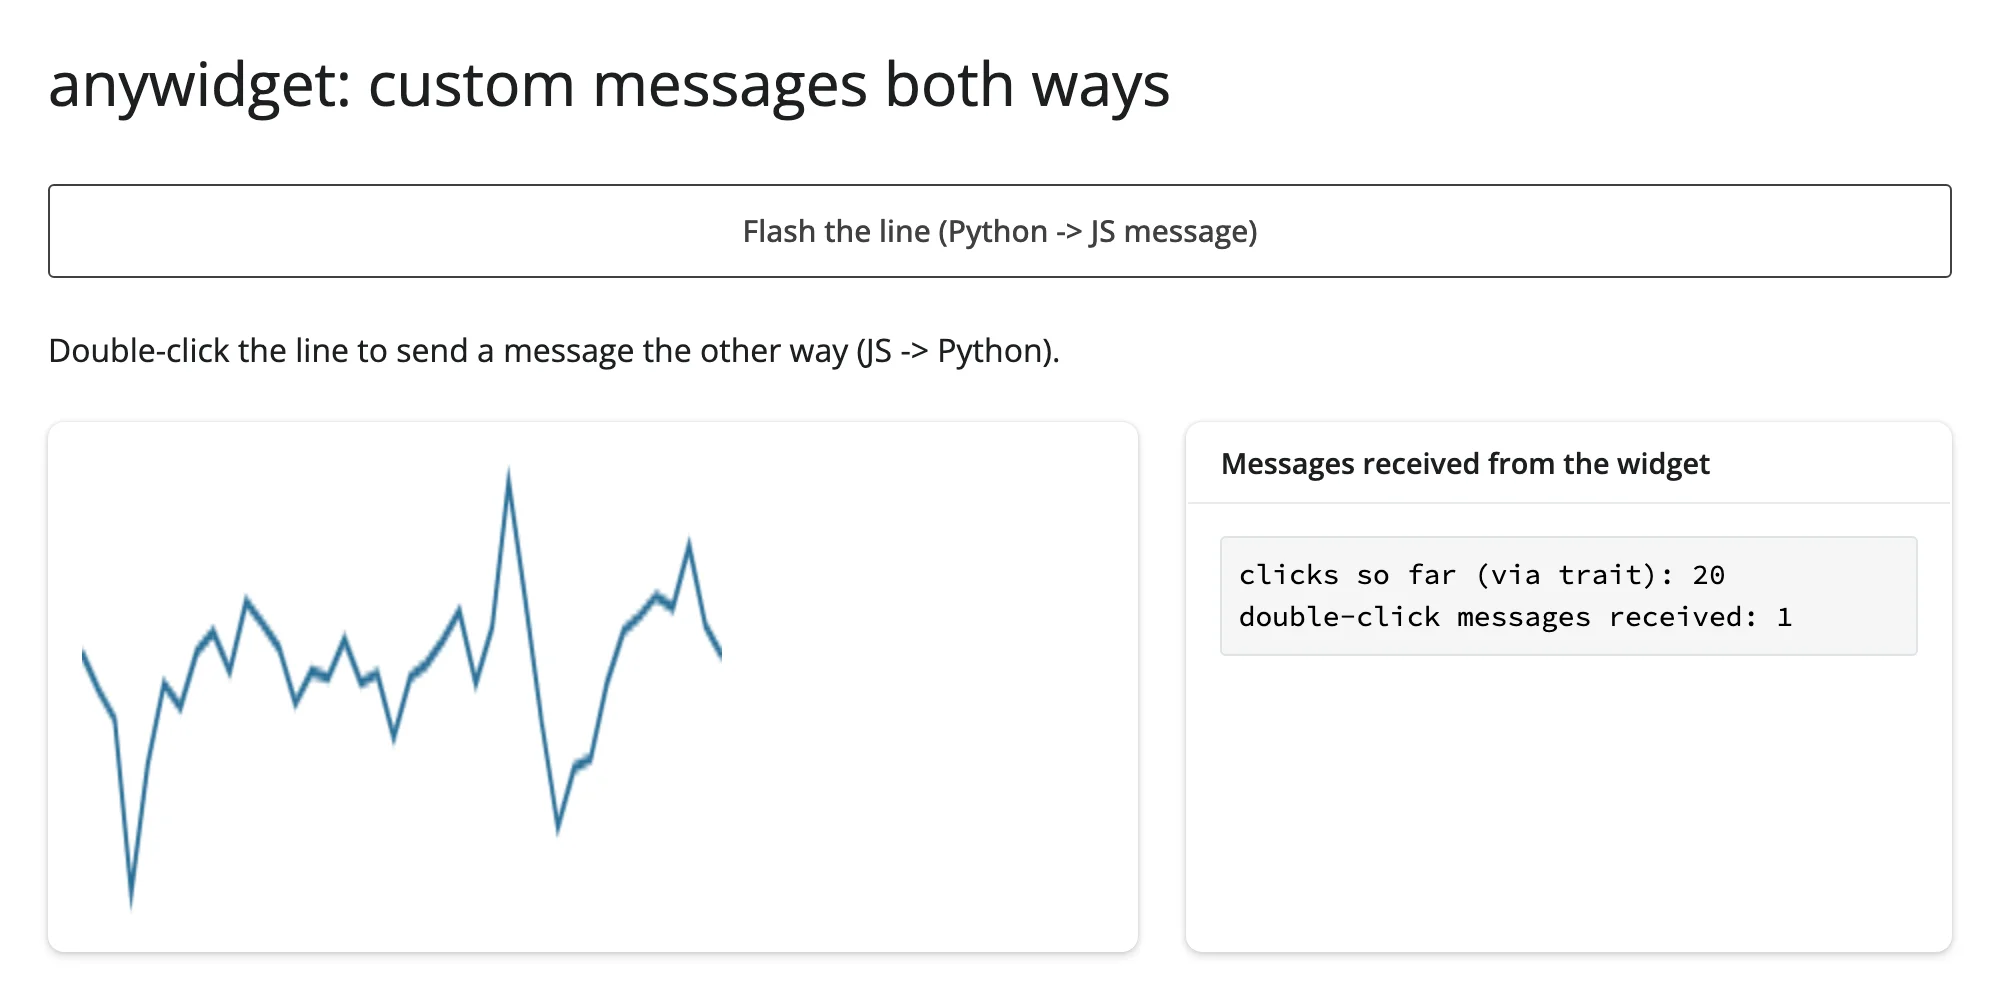
Double-clicking the line sends a message to Python, counted on the right:
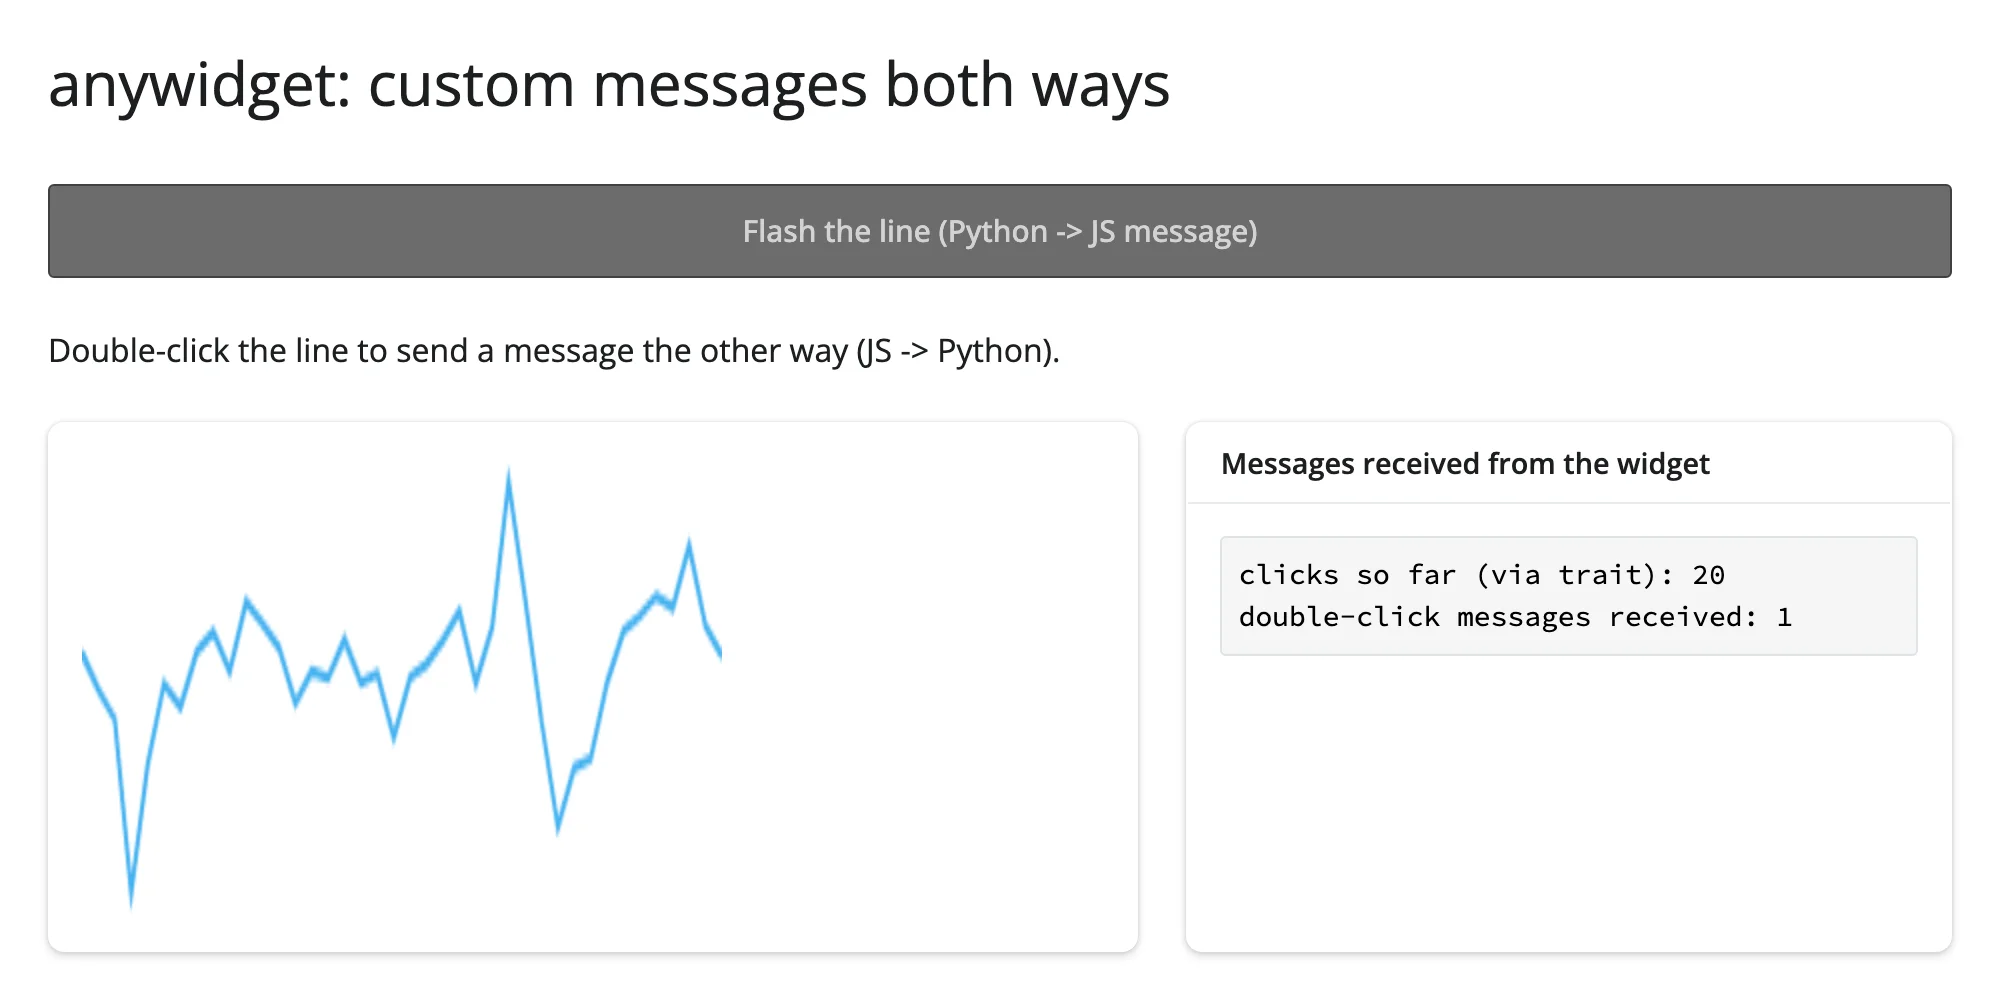
Clicking “Flash the line” sends a message the other way; the screenshot below was taken mid-flash (the line genuinely brightens for 200ms, driven entirely by the browser-side setTimeout):
A widget’s comm starts as a placeholder and is swapped for the real one on a later reactive flush. A widget.send(...) issued before that swap – including from inside the render function that builds the widget, or from a bare @reactive.effect with no dependency – used to be silently dropped. It no longer is: the placeholder now queues every send and replays it, in order, once the real comm opens, so a message is never lost regardless of when it’s sent. Verified directly: a widget.send(...) call placed literally inside the render function above, and a bare effect with no @reactive.event gate, both reached the browser in this pass’s testing. This guide’s own mapwidget example hits the same mechanism through add_call() (mapwidget’s own custom-call queue, a trait write rather than a literal widget.send()); the showcase gallery app’s engine-swap scenario is verified to deliver correctly too, even across a re-render.
Binary traits for bigger data
A traitlets.Bytes() trait is transmitted as a raw binary buffer (base64-encoded for the trip over Shiny’s text-only websocket, decoded back into a JS DataView on arrival) instead of a JSON array – worth it once a plain List(Float()) trait starts measuring in the hundreds of kilobytes.
import base64
import json

import numpy as np
from shiny.express import render, ui
from shinywidgets import render_widget

from sparkline_widget import BinarySparkline

N = 20_000
rng = np.random.default_rng(3)
DATA = rng.normal(size=N).cumsum().astype("float32")

ui.page_opts(title="anywidget: a binary trait for bigger data", fillable=True)

with ui.card():
    ui.card_header(f"{N:,} points as a packed float32 buffer, not a JSON list")

    @render_widget
    def spark():
        return BinarySparkline(values=DATA.tobytes())

with ui.card():
    ui.card_header(f"Measured payload for this array (same {N:,} floats either way)")

    @render.code
    def sizes():
        as_json = json.dumps(DATA.tolist()).encode()
        as_binary_b64 = base64.b64encode(DATA.tobytes())
        return (
            f"JSON list trait:      {len(as_json):>8,} bytes\n"
            f"Bytes trait (base64): {len(as_binary_b64):>8,} bytes "
            f"(raw buffer: {DATA.nbytes:,} bytes)"
        )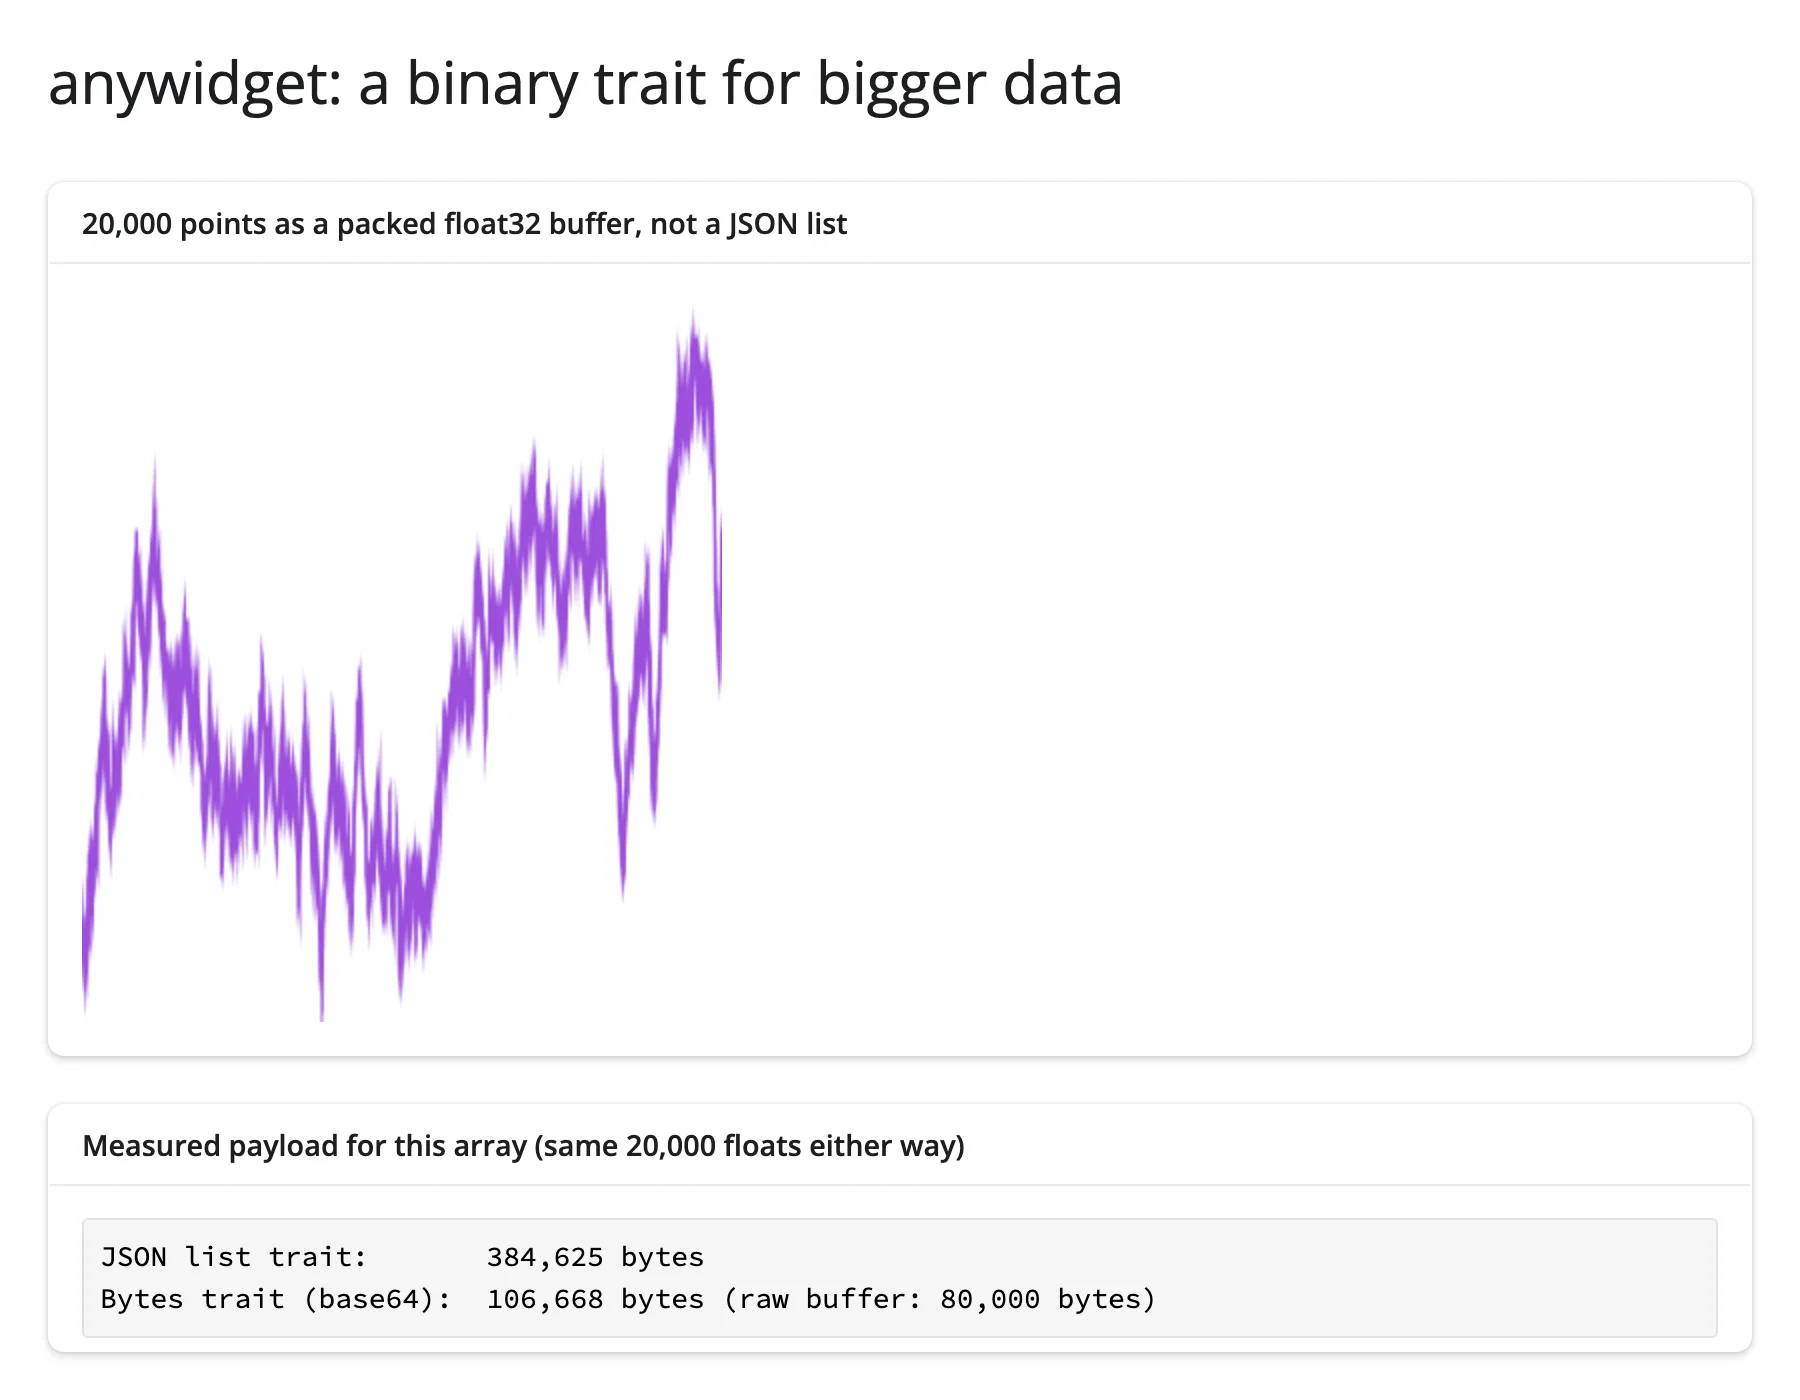
For this 20,000-point array: a JSON list trait measures 384,625 bytes; the identical data as a Bytes trait (base64-encoded for transport) measures 106,668 bytes – about 3.6x smaller, and the gap widens with array size (JSON’s per-number overhead is fixed; the binary encoding’s 33% base64 inflation is constant). The JS side reads it back with new Float32Array(buf.buffer, buf.byteOffset, buf.byteLength / 4) – see sparkline_widget.py’s BinarySparkline class for the complete widget.
Three ways to load _esm
from pathlib import Path

import anywidget
import traitlets
from shiny.express import ui
from shinywidgets import render_widget

ui.page_opts(title="Three ways to load an anywidget's JS", fillable=True)


class InlineBox(anywidget.AnyWidget):
    # `_esm` as a plain string: the simplest option, and what every other
    # example in this guide uses. The whole string is sent to the browser as
    # part of the widget's synced state.
    _esm = """
    function render({ model, el }) {
      const box = document.createElement("div");
      box.textContent = "click me";
      box.style.cssText =
        "display:flex;align-items:center;justify-content:center;" +
        "width:160px;height:90px;border-radius:8px;cursor:pointer;" +
        "background:#2a6f97;color:white;font:14px sans-serif;";
      let n = 0;
      box.addEventListener("click", () => {
        n += 1;
        box.textContent = `clicked ${n}x`;
        model.set("clicks", n);
        model.save_changes();
      });
      el.appendChild(box);
    }
    export default { render };
    """
    clicks = traitlets.Int(0).tag(sync=True)


class FileBox(anywidget.AnyWidget):
    # `_esm` as a Path: anywidget reads the file at render time, and
    # (outside headless testing) watches it for hot reload -- edit
    # box_widget.js and re-render to see the change without restarting
    # Python. Byte-for-byte the same widget as InlineBox above.
    _esm = Path(__file__).parent / "box_widget.js"
    clicks = traitlets.Int(0).tag(sync=True)


class CdnBarChart(anywidget.AnyWidget):
    # `_esm` can import straight from a CDN. No local JS dependency, no
    # bundler -- but the browser needs network access to esm.sh (or
    # whichever CDN), and that import is on the critical path of every
    # render.
    _esm = """
    import * as d3 from "https://esm.sh/d3@7";

    function render({ model, el }) {
      const data = model.get("data");
      const width = 220, height = 90;
      const svg = d3.create("svg").attr("width", width).attr("height", height);
      const x = d3.scaleBand().domain(data.map((_, i) => i)).range([0, width]).padding(0.2);
      const y = d3.scaleLinear().domain([0, d3.max(data)]).range([height, 0]);
      svg.selectAll("rect").data(data).join("rect")
        .attr("x", (_, i) => x(i))
        .attr("y", (d) => y(d))
        .attr("width", x.bandwidth())
        .attr("height", (d) => height - y(d))
        .attr("fill", "#9d4edd");
      el.appendChild(svg.node());
    }
    export default { render };
    """
    data = traitlets.List(traitlets.Float()).tag(sync=True)


with ui.layout_columns():
    with ui.card():
        ui.card_header("Inline string")

        @render_widget
        def inline_box():
            return InlineBox()

    with ui.card():
        ui.card_header("Sibling file (box_widget.js)")

        @render_widget
        def file_box():
            return FileBox()

    with ui.card():
        ui.card_header("CDN import (d3, via esm.sh)")

        @render_widget
        def bars():
            return CdnBarChart(data=[4, 8, 15, 16, 23, 42])
examples/06_esm_sources.py (FileBox’s sibling file: examples/box_widget.js)
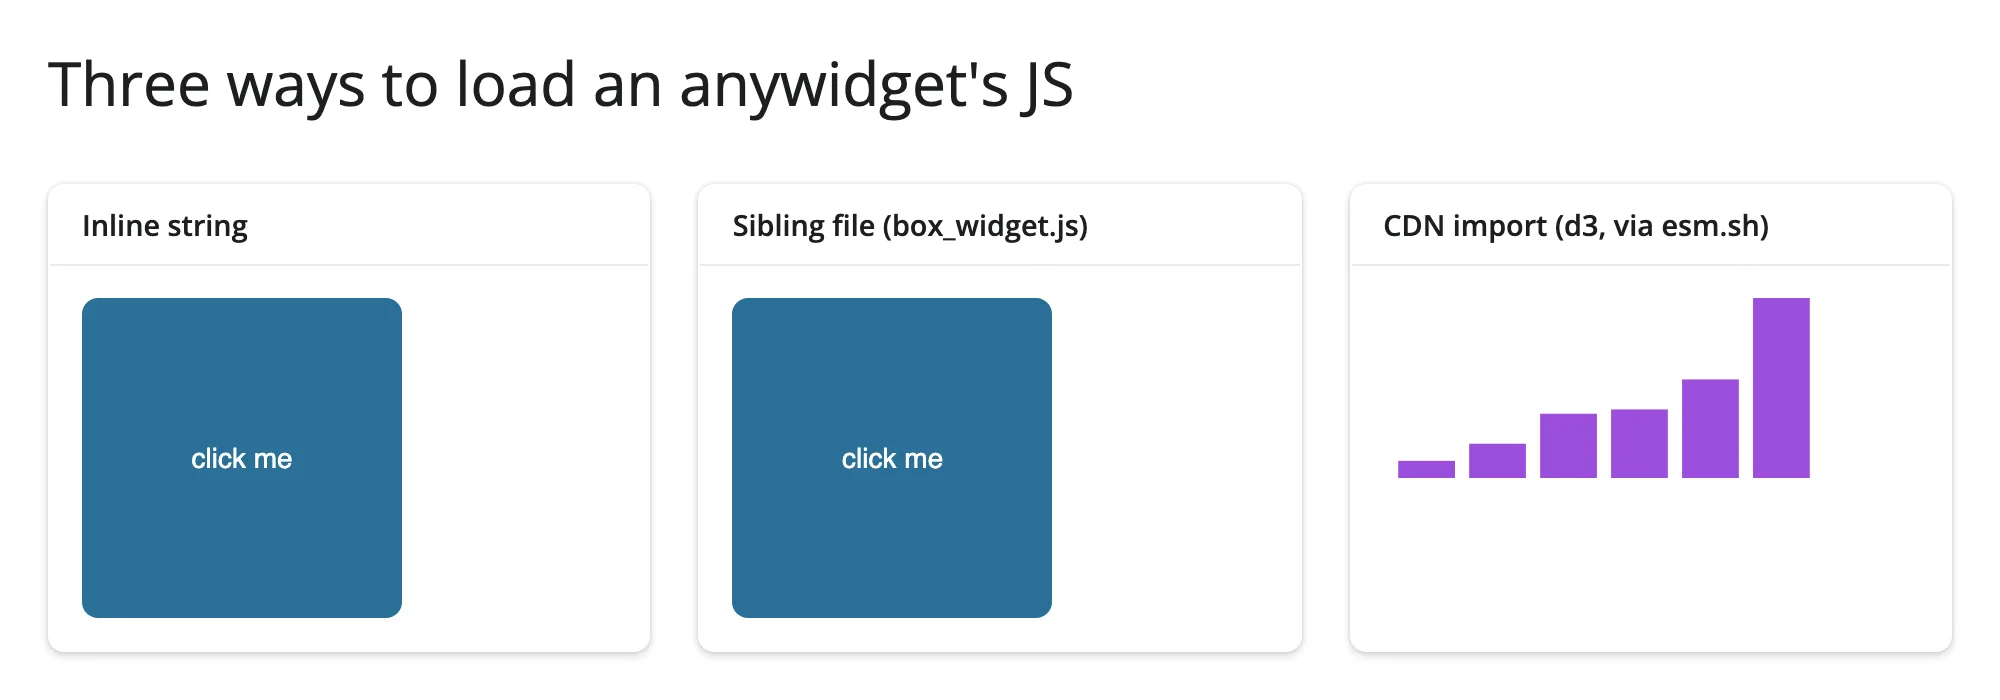
The inline box is interactive like the others; clicking it updates its own synced trait:
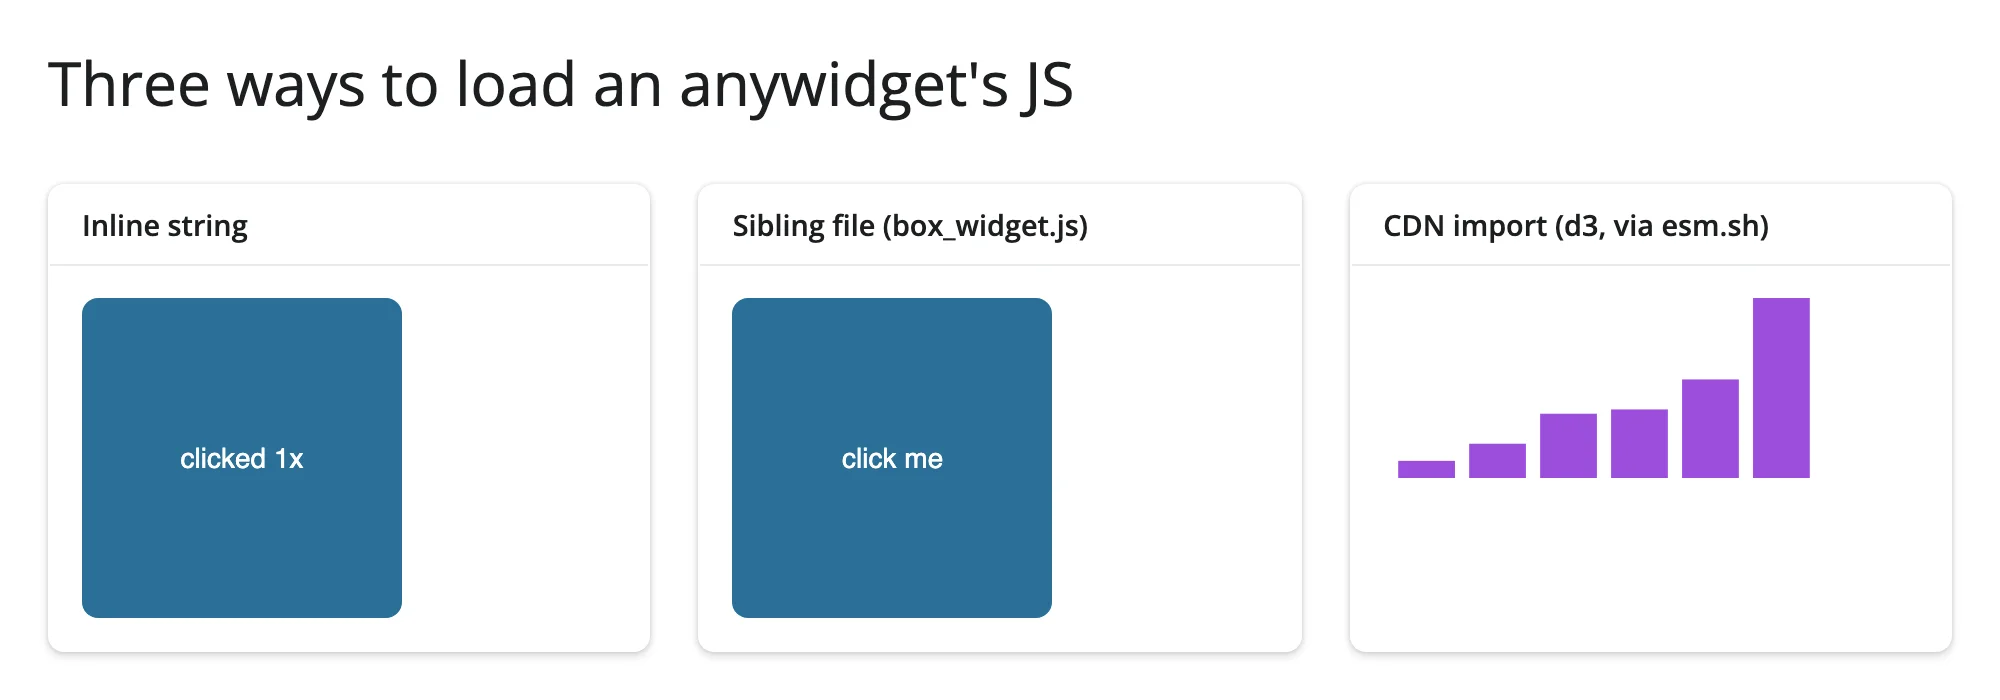
All three render identically – InlineBox and FileBox are byte-for-byte the same widget. Prefer the file form while actively developing a widget (faster edit loop via hot reload, outside headless test environments); prefer inline for a widget that’s done, so the whole class is self-contained in one file. A CDN import needs nothing installed locally, at the cost of a network dependency on every render (and, for widgets that aren’t trivial like this one, real bytes downloaded by the browser each time).
Third-party widgets with no dedicated renderer
If a package’s own pip install gives you a class that’s already an ipywidgets.Widget (every anywidget-based package qualifies automatically), plain render_widget just works – no coercion needed, no renderer PR required. Two real packages without a roster entry demonstrate this.
mapwidget wraps MapLibre GL, Leaflet, and OpenLayers behind one small anywidget API (center, zoom, clicked_latlng, plus add_call()/add_basemap() for driving the map from Python).
# Needs: uv run --no-sync --with mapwidget python -m shiny run 08_third_party_mapwidget.py
#
# mapwidget (https://github.com/opengeos/mapwidget) has no dedicated
# shinywidgets renderer -- plain `render_widget` is enough, because
# mapwidget.maplibre.Map is already an ipywidgets.Widget subclass; there is
# nothing to coerce. This is the common case for "my widget isn't on the
# roster": if `pip install <library>` gives you an anywidget/ipywidgets class
# directly, `@render_widget` just works.
import mapwidget.maplibre as maplibregl
from shiny import reactive
from shiny.express import input, render, ui
from shinywidgets import render_widget

ui.page_opts(title="A third-party widget with no dedicated renderer", fillable=True)

with ui.layout_columns(col_widths=[8, 4]):
    with ui.card(full_screen=True):
        ui.card_header("mapwidget.maplibre.Map (click the map)")
        ui.input_action_button("dark", "Switch to dark style")

        @render_widget
        def map():
            return maplibregl.Map(center=[40.7128, -74.0060], zoom=10)

        # Python -> JS state changes on this widget are forwarded with
        # `add_call(method, args)`, not by assigning a trait (assigning
        # `map.widget.center = ...` changes the Python-side trait but never
        # moves the rendered map -- documented, verified upstream behavior).
        # A call made before the widget's real comm opens -- even from
        # inside the render function above -- is no longer dropped (see
        # "Reacting to user interaction"); the button here is just this toy
        # app's trigger for "restyle on demand," not a workaround.
        @reactive.effect
        @reactive.event(input.dark)
        def _dark_style():
            map.widget.add_call(
                "setStyle", ["https://tiles.openfreemap.org/styles/fiord"]
            )

    with ui.card():
        ui.card_header('map.read("clicked_latlng") / map.read("zoom")')

        @render.code
        def state_out():
            lat, lng = map.read("clicked_latlng")
            zoom = map.read("zoom")
            clicked = "nowhere yet" if lat is None else f"({lat:.3f}, {lng:.3f})"
            return f"zoom: {zoom:.1f}\nlast click: {clicked}"
Default style, after a click (nearby lat/lng reported):
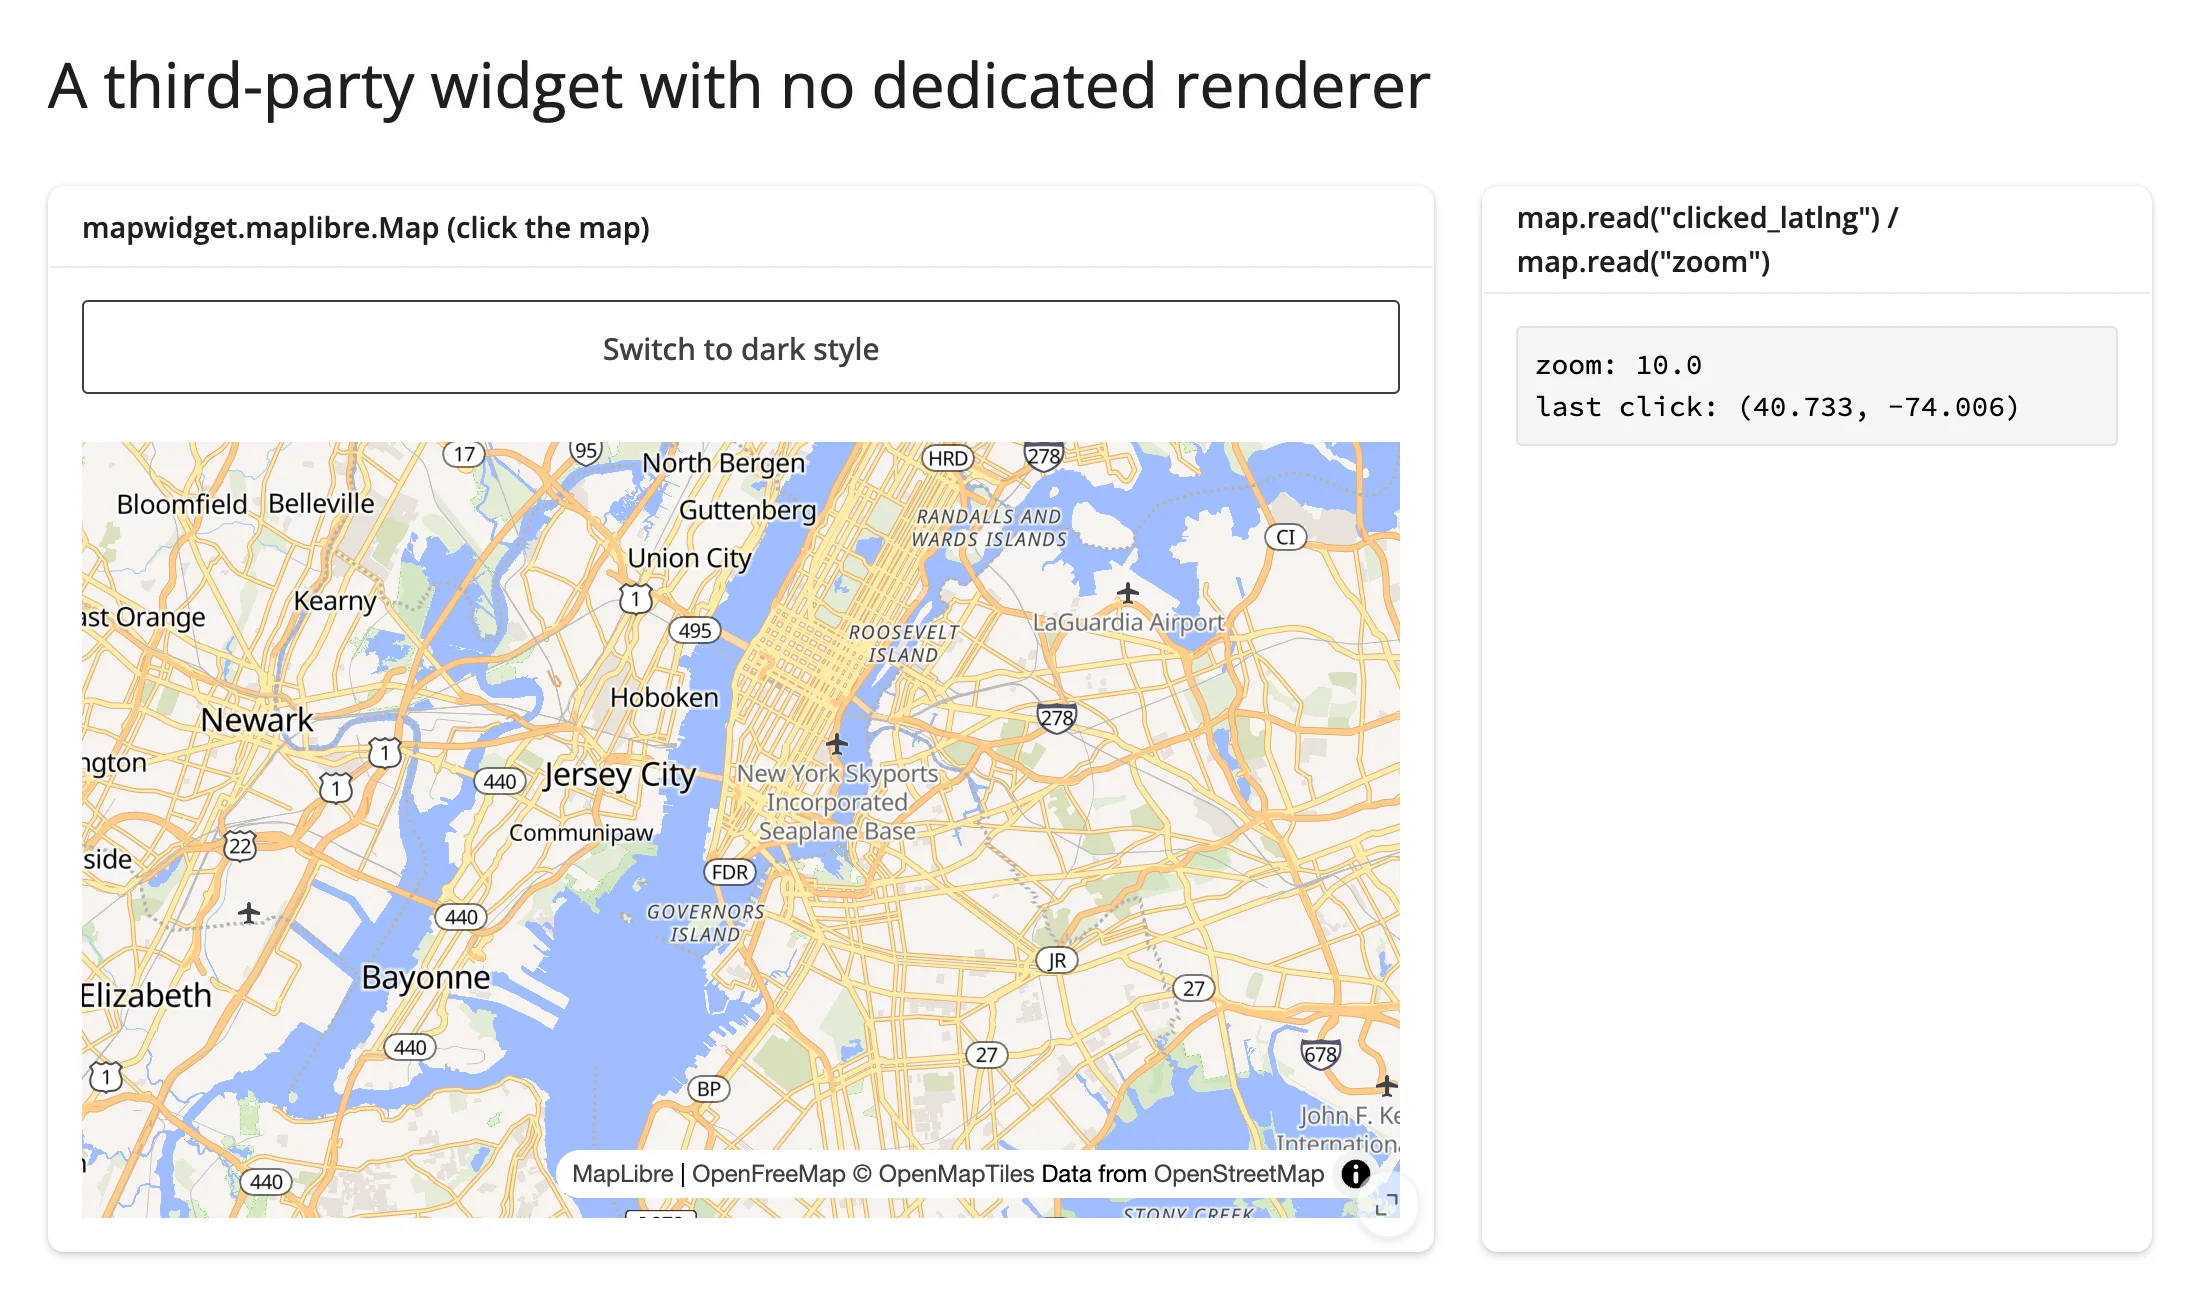
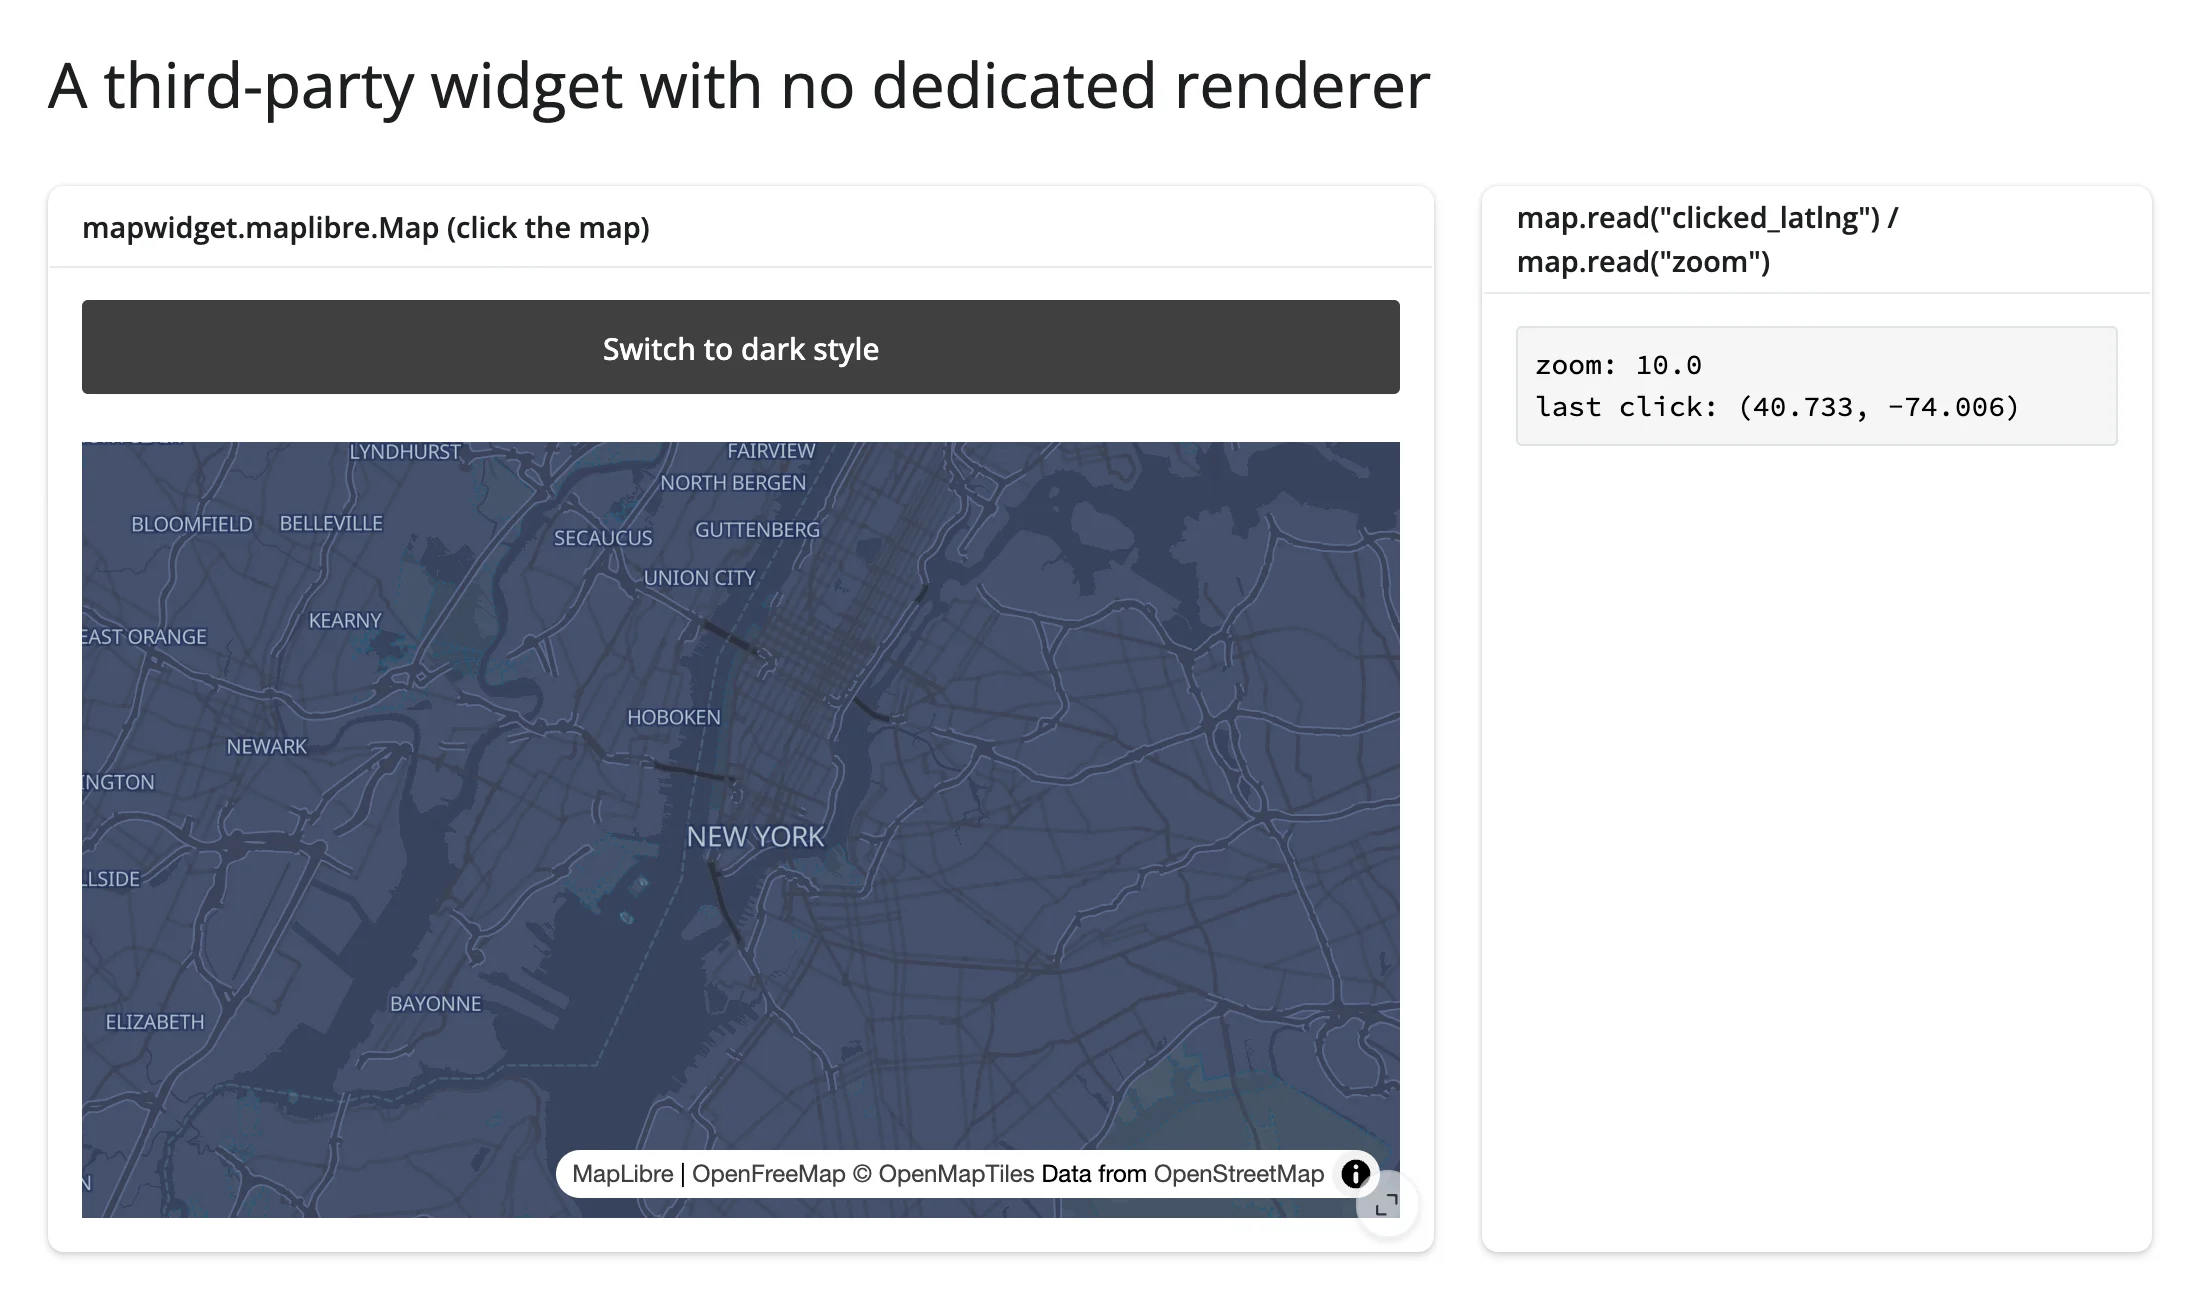
Clicking “Switch to dark style” applies it correctly:
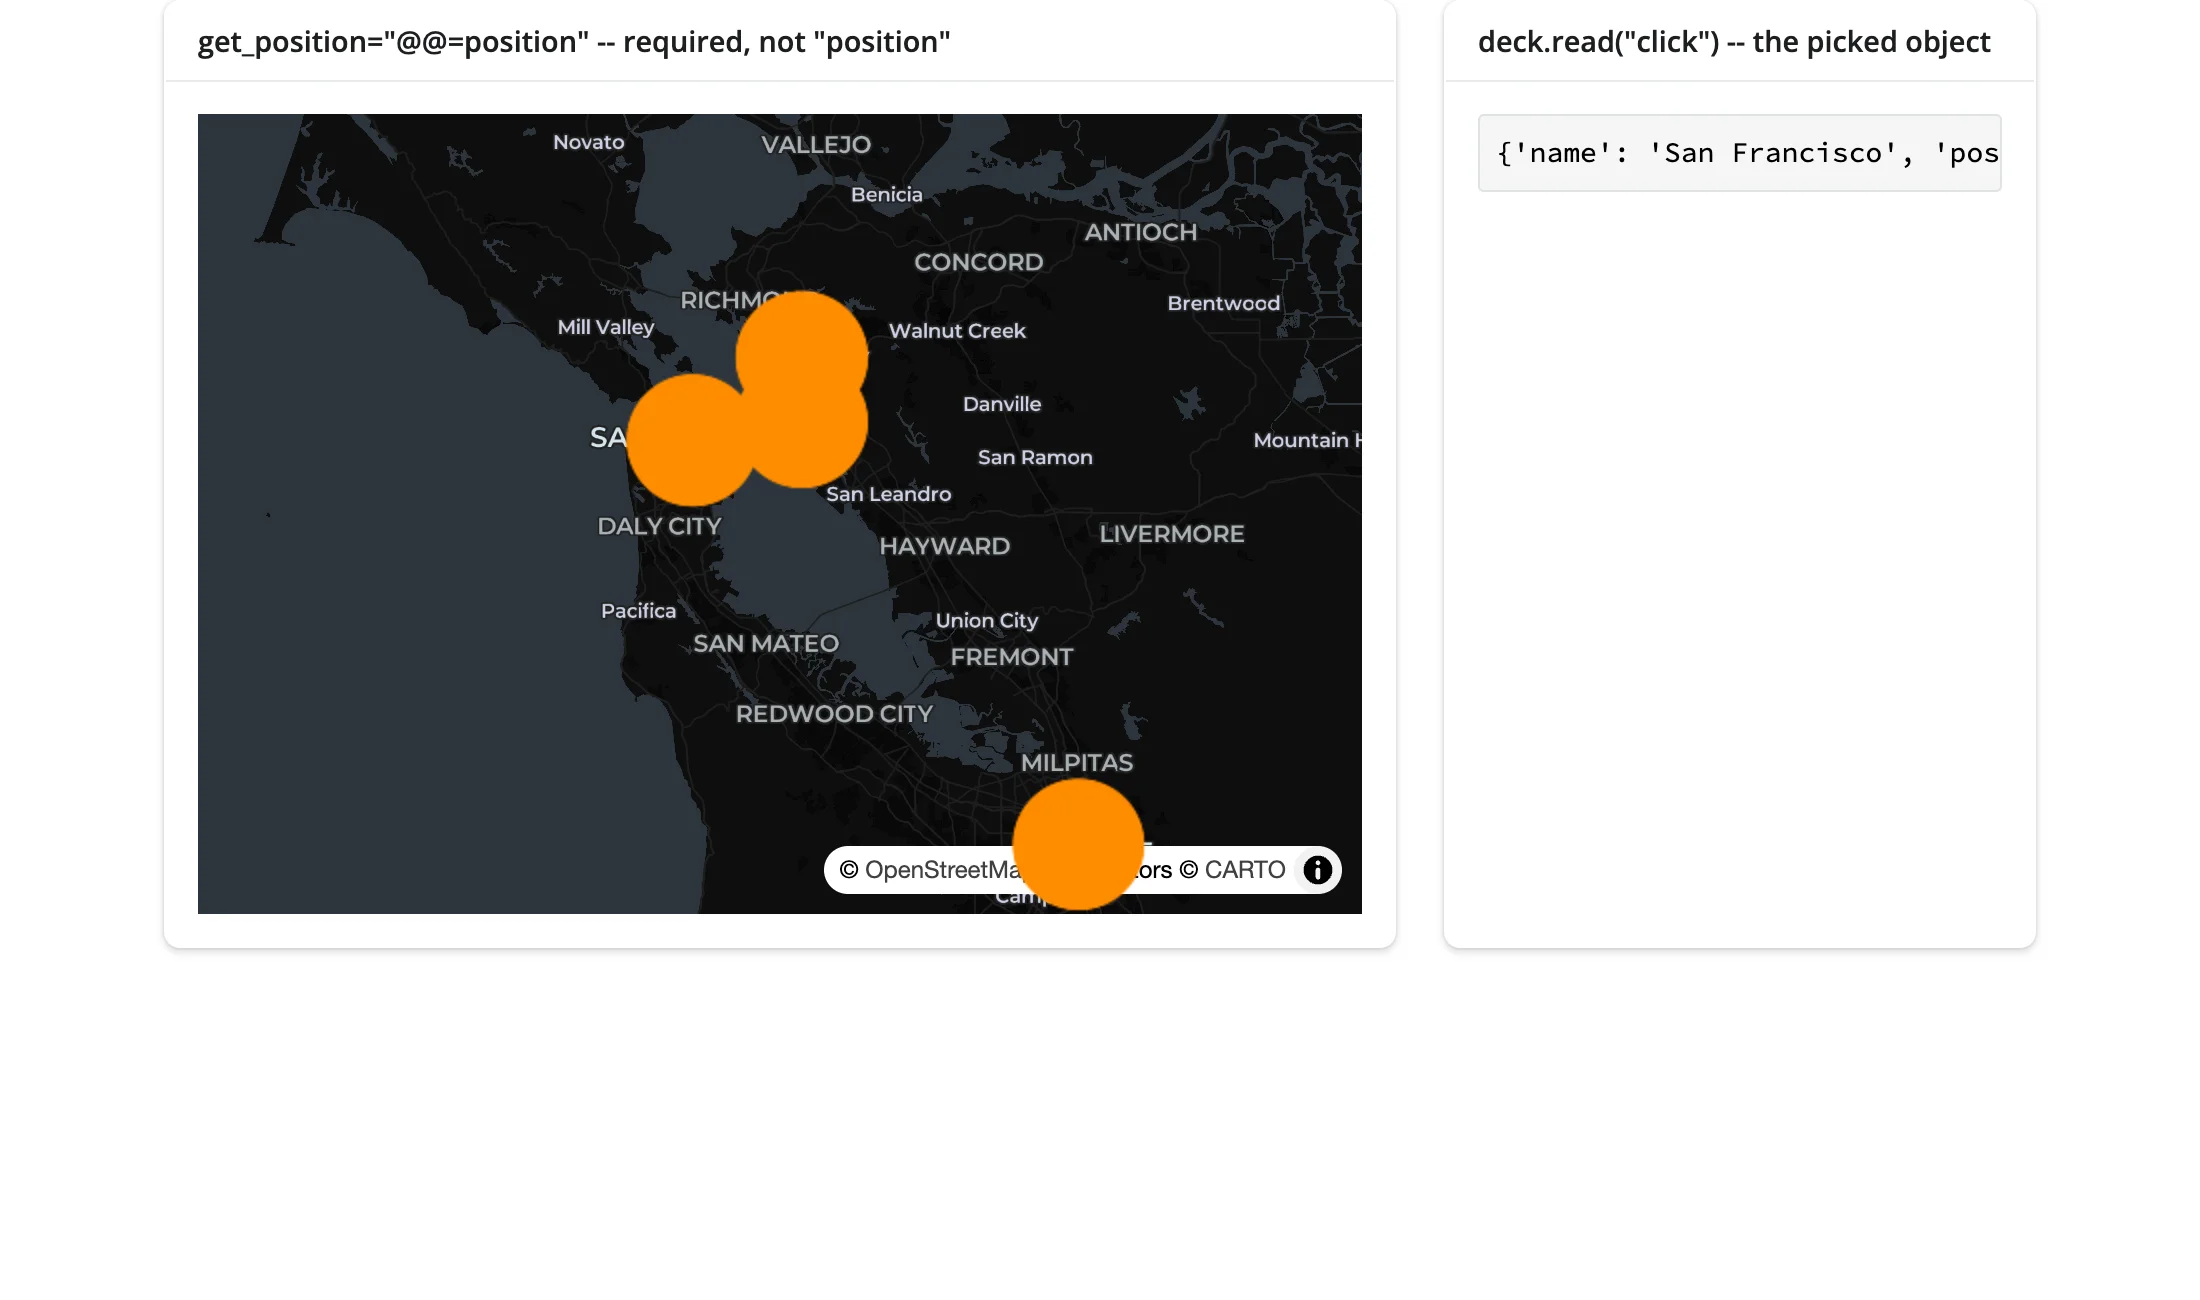
ipydeck wraps deck.gl layers directly. It’s a good second example precisely because it has a sharp, verified upstream edge: deck.gl’s own “accessor” properties (get_position, get_fill_color, …) only become functions when the Python value is a string prefixed @@= – a plain column name (the way pydeck itself accepts it) silently renders nothing, with no error anywhere.
# Needs: uv run --no-sync --with ipydeck python -m shiny run 09_third_party_ipydeck.py
#
# A second no-dedicated-renderer example: ipydeck (deck.gl layers as an
# anywidget). Same `render_widget` recipe as mapwidget, but ipydeck has a
# sharp upstream edge worth knowing before you try it: deck.gl's own
# "accessor" properties (`get_position`, `get_fill_color`, ...) only become
# functions when the Python value is a string prefixed `@@=`. A plain column
# name -- which is exactly how pydeck accepts it -- renders nothing, with no
# error anywhere.
from ipydeck import Deck, Layer, ViewState
from shiny.express import render, ui
from shinywidgets import render_widget

CITIES = [
    {"name": "San Francisco", "position": [-122.42, 37.78]},
    {"name": "Oakland", "position": [-122.27, 37.80]},
    {"name": "Berkeley", "position": [-122.27, 37.87]},
    {"name": "San Jose", "position": [-121.89, 37.34]},
]

with ui.layout_columns(col_widths=[8, 4]):
    with ui.card(full_screen=True):
        ui.card_header('get_position="@@=position" -- required, not "position"')

        @render_widget
        def deck():
            return Deck(
                layers=[
                    Layer(
                        "ScatterplotLayer",
                        data=CITIES,
                        id="cities",
                        pickable=True,
                        on_click=True,
                        get_position="@@=position",  # plain "position" silently draws nothing
                        get_radius=8000,
                        get_fill_color=[255, 140, 0],
                    )
                ],
                initial_view_state=ViewState(longitude=-122.3, latitude=37.7, zoom=8),
                map_style="dark",
                tooltip={"html": "<b>{name}</b>"},
            )

    with ui.card():
        ui.card_header('deck.read("click") -- the picked object')

        @render.code
        def click_out():
            picked = deck.read("click")
            return "click a city" if not picked else str(picked.get("object"))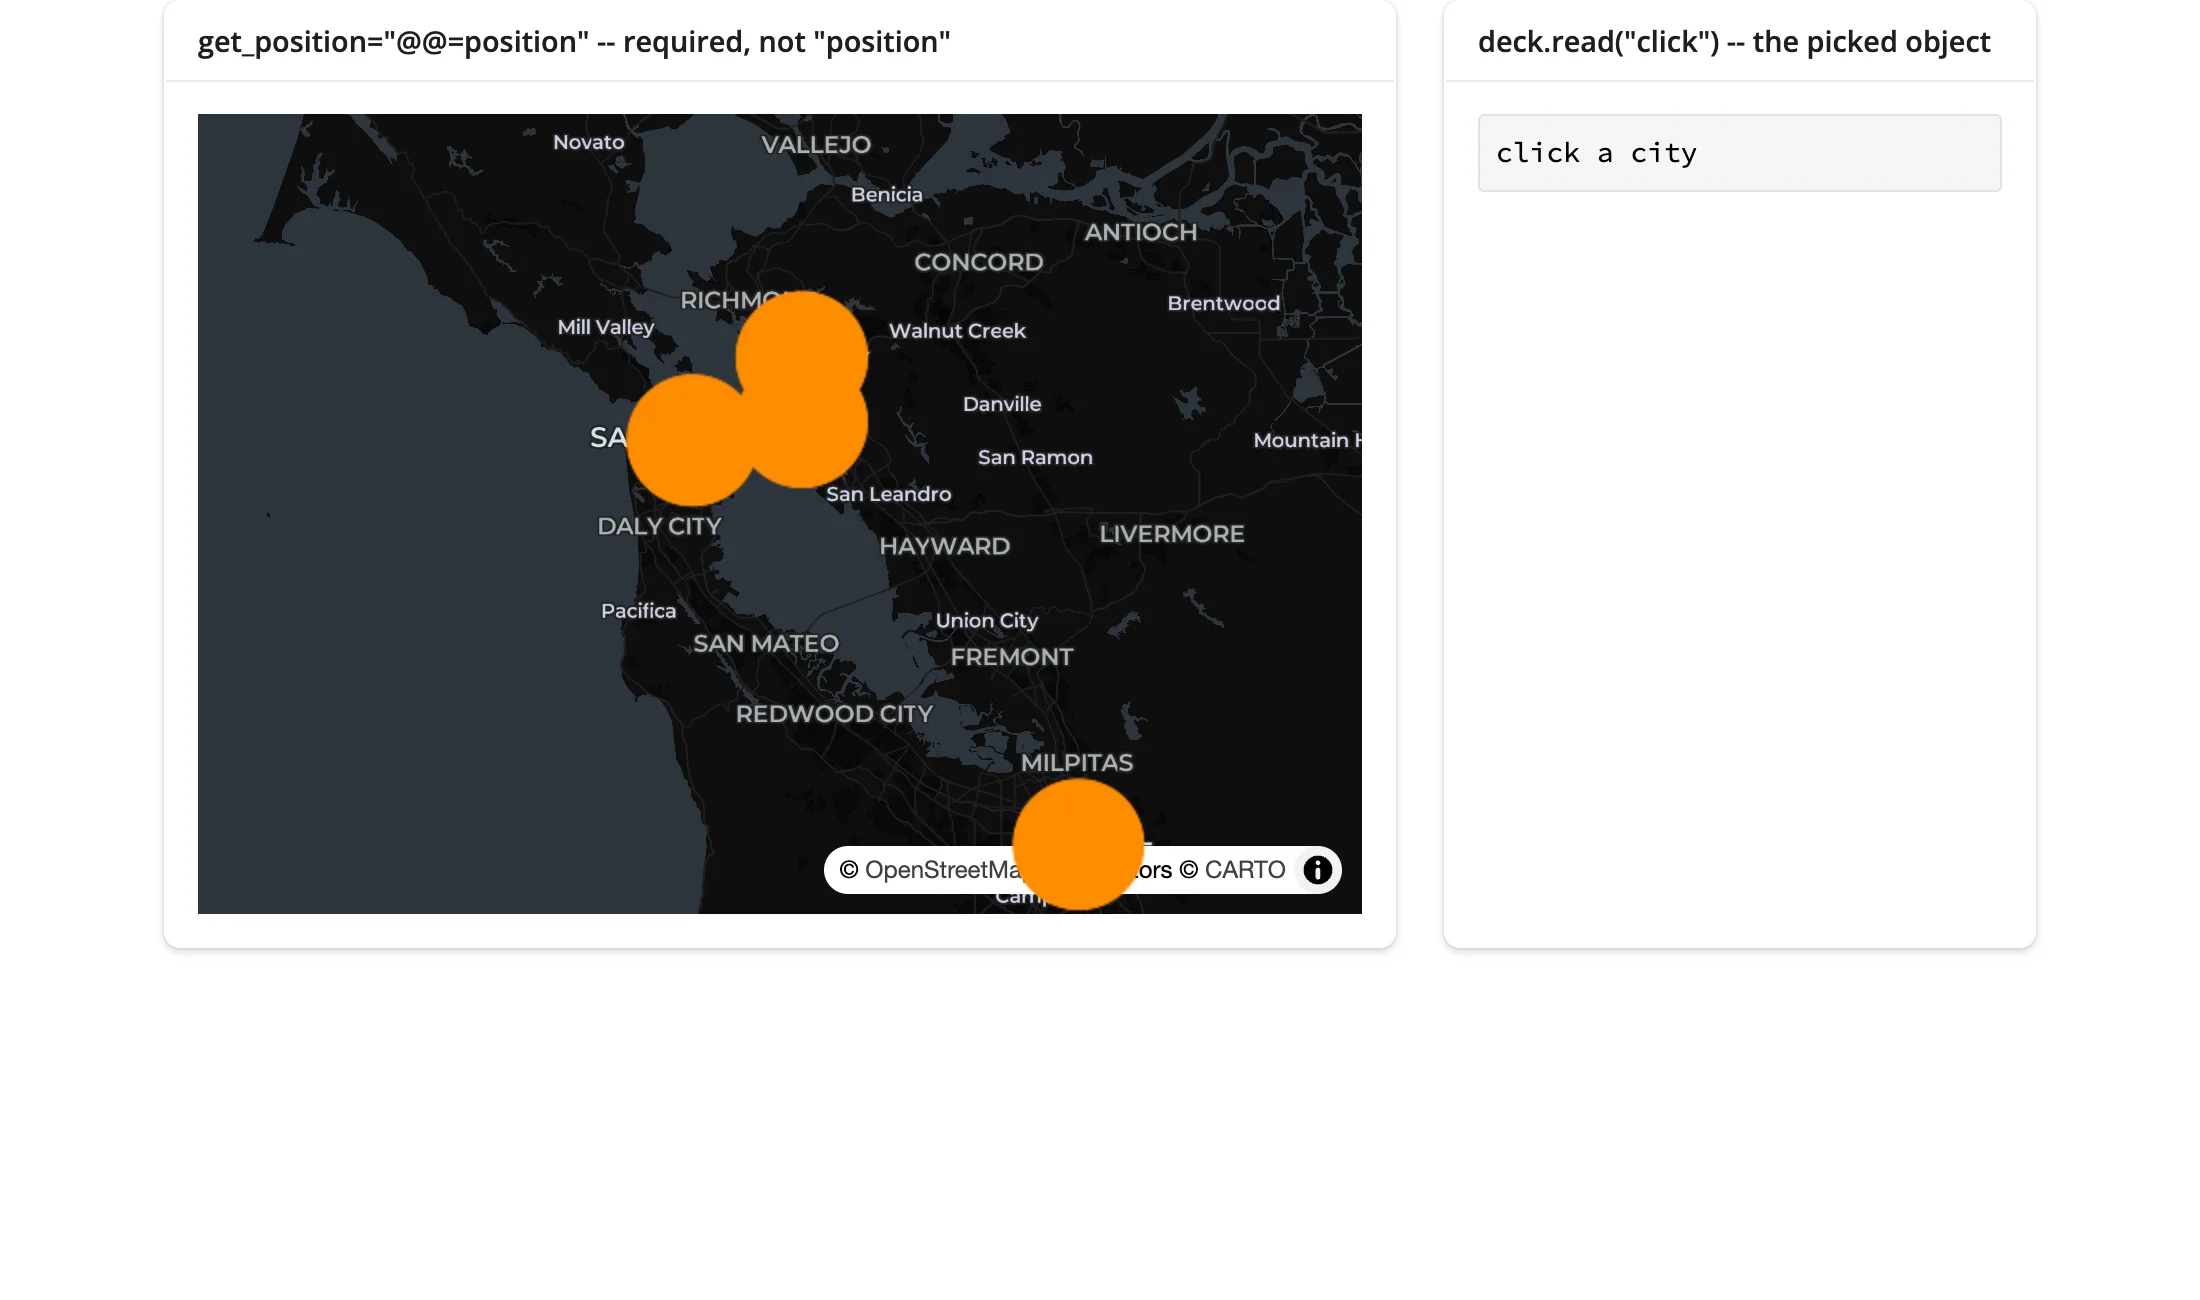
A pick reports the full data row back to Python (verified via a model-level set(), since real clicks under headless Chromium + swiftshader landed between deck.gl’s picking buffer and the visible marker radius more often than not – see Gotchas):
A third option worth knowing about (not demonstrated here): carbonplan-maps, an experimental anywidget that renders cloud-native Zarr pyramids as GPU map tiles – the browser streams chunks straight from S3, with no tile server and no Python in the render loop. It works in Shiny with one required CSS fix (its raster layer paints at z-index: -1, which an opaque bslib::card background hides without an override rule) – not re-verified in this pass.
ipyreact: JSX widgets, no build step
ipyreact is a different way to build a custom widget: instead of anywidget’s imperative render({ model, el }) function, you write a real React component in JSX, and setValue (handed to your component as a prop) writes straight back to the widget’s value trait.
import ipyreact
from shiny.express import render, ui
from shinywidgets import render_widget

# ipyreact's own idiom: write real JSX in `_esm`, and `setValue` is handed to
# the component as a prop that writes straight back to the widget's `value`
# trait (ValueWidget's one synced trait). No separate click handler plumbing
# -- this is the whole widget.
CONFETTI_ESM = """
import confetti from "https://esm.sh/canvas-confetti@1";
import * as React from "react";

export default function ({ value, setValue }) {
  return React.createElement(
    "button",
    { onClick: () => { confetti(); setValue((value || 0) + 1); } },
    `${value || 0} times confetti`
  );
}
"""


class ConfettiButton(ipyreact.ValueWidget):
    _esm = CONFETTI_ESM


ui.page_opts(title="ipyreact: JSX widgets with no JS build step", fillable=True)

with ui.card():
    ui.card_header("ipyreact.ValueWidget subclass")

    @render_widget
    def button():
        return ConfettiButton()

    @render.code
    def count_out():
        n = button.read("value")
        return f"confetti fired {n or 0} time(s)"
Before and after one click:
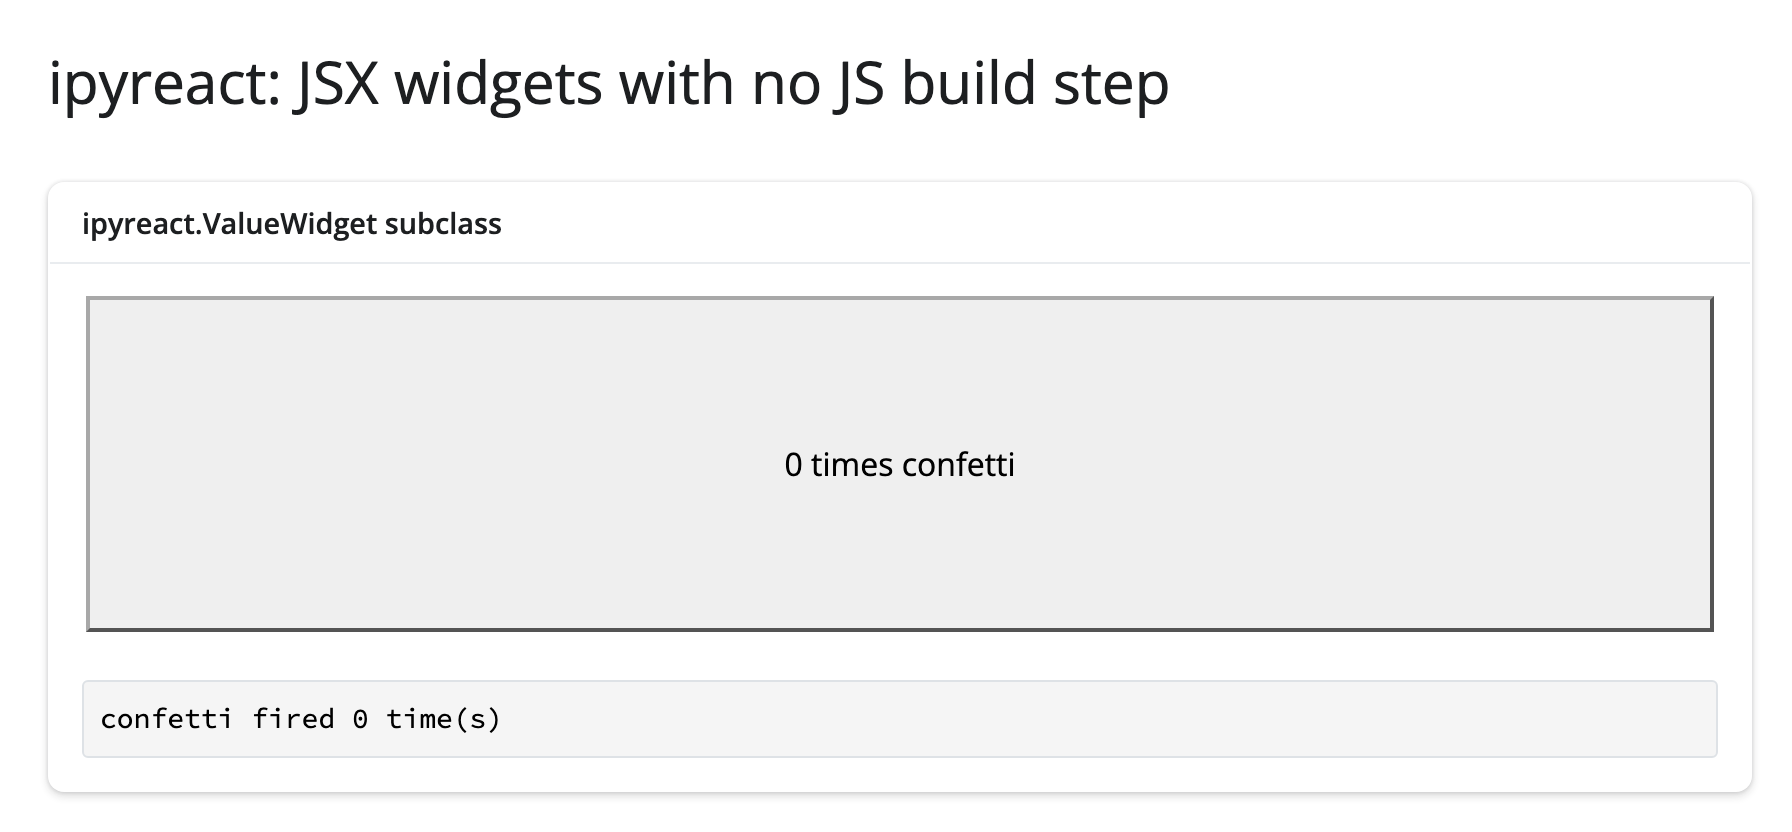
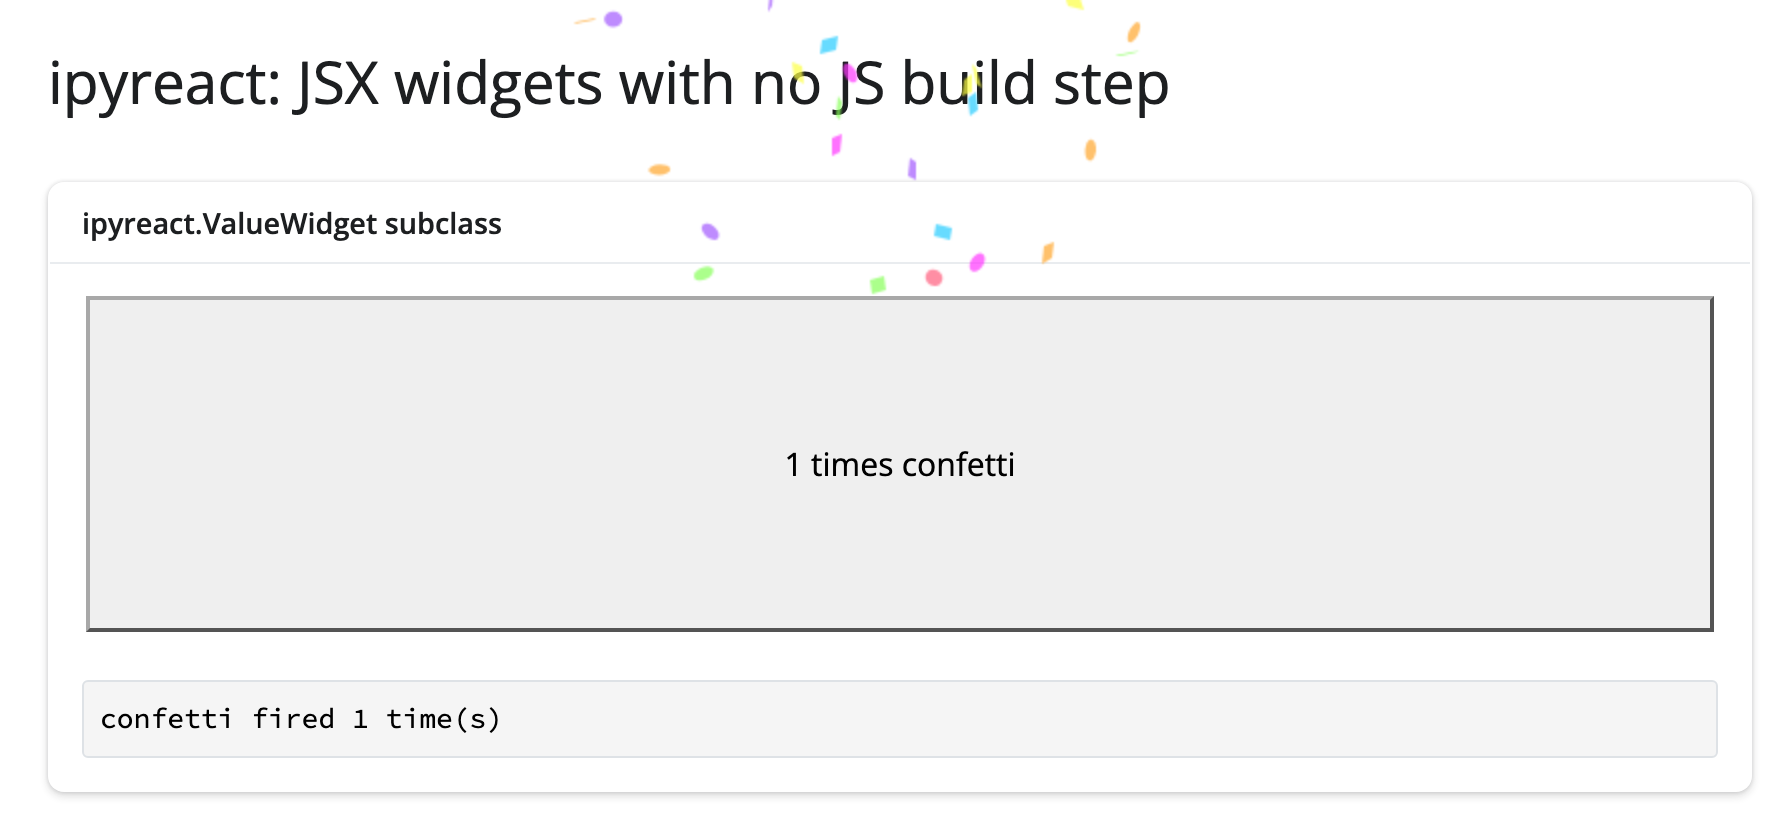
ipyreact.ValueWidget is a real ipywidgets.ValueWidget subclass, so button.read("value") works exactly like any other synced trait – composition (JSX, useState, React’s own rendering) is entirely ipyreact’s concern; shinywidgets just sees another widget. Subclassing a third-party widget directly in your own app module – as ConfettiButton does here – works the same way it does in Jupyter, with no special handling needed on your part.
ipyreact’s process-global registry, handled for you. ipyreact.define_module()/define_import_map() (used internally by reactable-py, and available for your own reusable JS modules) register process-wide dependency widgets that every ipyreact consumer waits on by name. shinywidgets detects these and mirrors them into every session automatically, the same way it handles shared_lifetime() widgets – you don’t need to do anything differently to use them in Shiny. The one thing to know: a Module’s code/url are Python-authored and guarded against being overwritten by a browser-sent message (only its status field, which the frontend uses to report load progress, can come from the client) – see shinywidgets/_ipyreact.py if you’re curious about the mechanism.
Reacting to user interaction
render_widget has no accessors (it’s the one renderer in the roster that doesn’t – see the cheat sheet’s “Renderers with no accessors” list in ../articles/reacting-to-widgets/cheatsheet.md), because there’s no single library’s semantics to build one against. That leaves the other two tiers described in Reacting to widgets:
output.read("trait")for a trait of the output’s own rendered widget – every example above uses this (spark.read("clicked_index"),map.read("zoom"),button.read("value"), …). It’s a documented shortcut forreactive_read(output.widget, "trait")with one practical edge: an unknown name raises with a “did you mean?” hint instead of silently returningNone, which catches a typo’d trait name immediately instead of showing an empty-looking UI.reactive_read(widget, "trait")for a widget that isn’t the output itself – a child widget a parent owns, likepanel.widget.children[0]in Plain ipywidgets above. There’s no.read()for these, because there’s no renderer output wrapping them.
Beyond the accessors: which traits are worth reading
For the widgets in this guide:
| Widget | Trait | Meaning |
|---|---|---|
Sparkline (custom) |
clicked_index |
Index of the most recently clicked/dragged-over point. None until first interaction; does not reset on re-render (no re-render happens in these examples). |
Sparkline (custom) |
brush |
[start_index, end_index] of the last completed drag; [] before the first drag. |
BinarySparkline (custom) |
values |
The raw buffer itself – not usually read back, but demonstrates the binary wire format. |
mapwidget (maplibre/leaflet/openlayers) |
center, zoom, clicked_latlng |
All three backends share these; clicked_latlng defaults to [None, None] – guard for it. |
ipydeck Deck |
click |
The picked object ({"object": {...}, "index": N} or {}); requires pickable=True, on_click=True on the layer. |
ipyreact ValueWidget |
value |
Whatever your component passes to setValue(). |
For a widget you didn’t write, the method is the same one used to find these: skim widget.trait_names() for anything that looks user-facing, then .read() it (or reactive_read(), for a child widget) and confirm with a real gesture that it actually updates (some traits – especially ones an upstream library treats as internal – don’t sync reliably; this guide’s own mapwidget example has one: assigning .center/.zoom from Python changes the trait but never moves the rendered map, because none of mapwidget’s three backends register a change:center/change:zoom JS-side handler – state flows browser-to-Python only there).
Rate limiting, and a reusable accessor-like helper
The renderer’s rate_policy/rate_delay kwargs rate-limit .read()/reactive_read() on that output’s widget (this is the one case where they matter for render_widget, since there are no accessors for them to govern). The contrast below drives a slow drag across two separate Sparkline instances – one plain, one rendered with @render_widget(rate_policy="debounce", rate_delay=0.5) – and counts how many times each reader actually fires.
Custom widgets also don’t come with built-in accessors the way render_plotly’s clicked() does – but nothing stops you from writing the equivalent yourself: a small function that wraps .read() in a @reactive.calc, giving every call site the same typed, documented value instead of repeating a raw index-to-row lookup.
import numpy as np
from shiny import reactive
from shiny.express import render, ui
from shinywidgets import render_widget

from sparkline_widget import Sparkline

rng = np.random.default_rng(4)
DATA = list(rng.normal(size=40).cumsum())


def nearest_point(output, data):
    """
    Accessor-like helper: turns a raw `clicked_index` trait into the actual
    data point. Custom widgets don't come with built-in accessors like
    `render_plotly`'s `clicked()` -- this is the pattern for writing your
    own: wrap `.read()` in a function returning a `@reactive.calc`, so every
    call site gets the same typed value instead of repeating the
    index-to-row lookup.
    """

    @reactive.calc
    def _():
        idx = output.read("clicked_index")
        return None if idx is None else data[idx]

    return _


ui.page_opts(title="A reusable accessor-like helper, and rate limiting", fillable=True)
ui.markdown("Drag across each sparkline (slowly, over ~1 second) and compare the counts.")

with ui.layout_columns():
    with ui.card():
        ui.card_header("default: .read() fires on every drag update")

        @render_widget
        def spark():
            return Sparkline(values=DATA)

        n_default = reactive.value(0)

        @reactive.effect
        def _count_default():
            spark.read("clicked_index")
            with reactive.isolate():
                n_default.set(n_default() + 1)

        @render.code
        def out_default():
            return f"fired {n_default()} times"

    with ui.card():
        ui.card_header("render_widget(rate_policy='debounce', rate_delay=0.5)")

        @render_widget(rate_policy="debounce", rate_delay=0.5)
        def spark_slow():
            return Sparkline(values=DATA)

        n_slow = reactive.value(0)

        @reactive.effect
        def _count_slow():
            spark_slow.read("clicked_index")
            with reactive.isolate():
                n_slow.set(n_slow() + 1)

        @render.code
        def out_slow():
            return f"fired {n_slow()} times"

with ui.card():
    ui.card_header("nearest_point(spark, DATA)() -- the helper in use")

    point = nearest_point(spark, DATA)

    @render.code
    def point_out():
        p = point()
        return "drag the left sparkline" if p is None else f"value at that index: {p:.3f}"
One slow drag across each sparkline, plus a click on the left one:
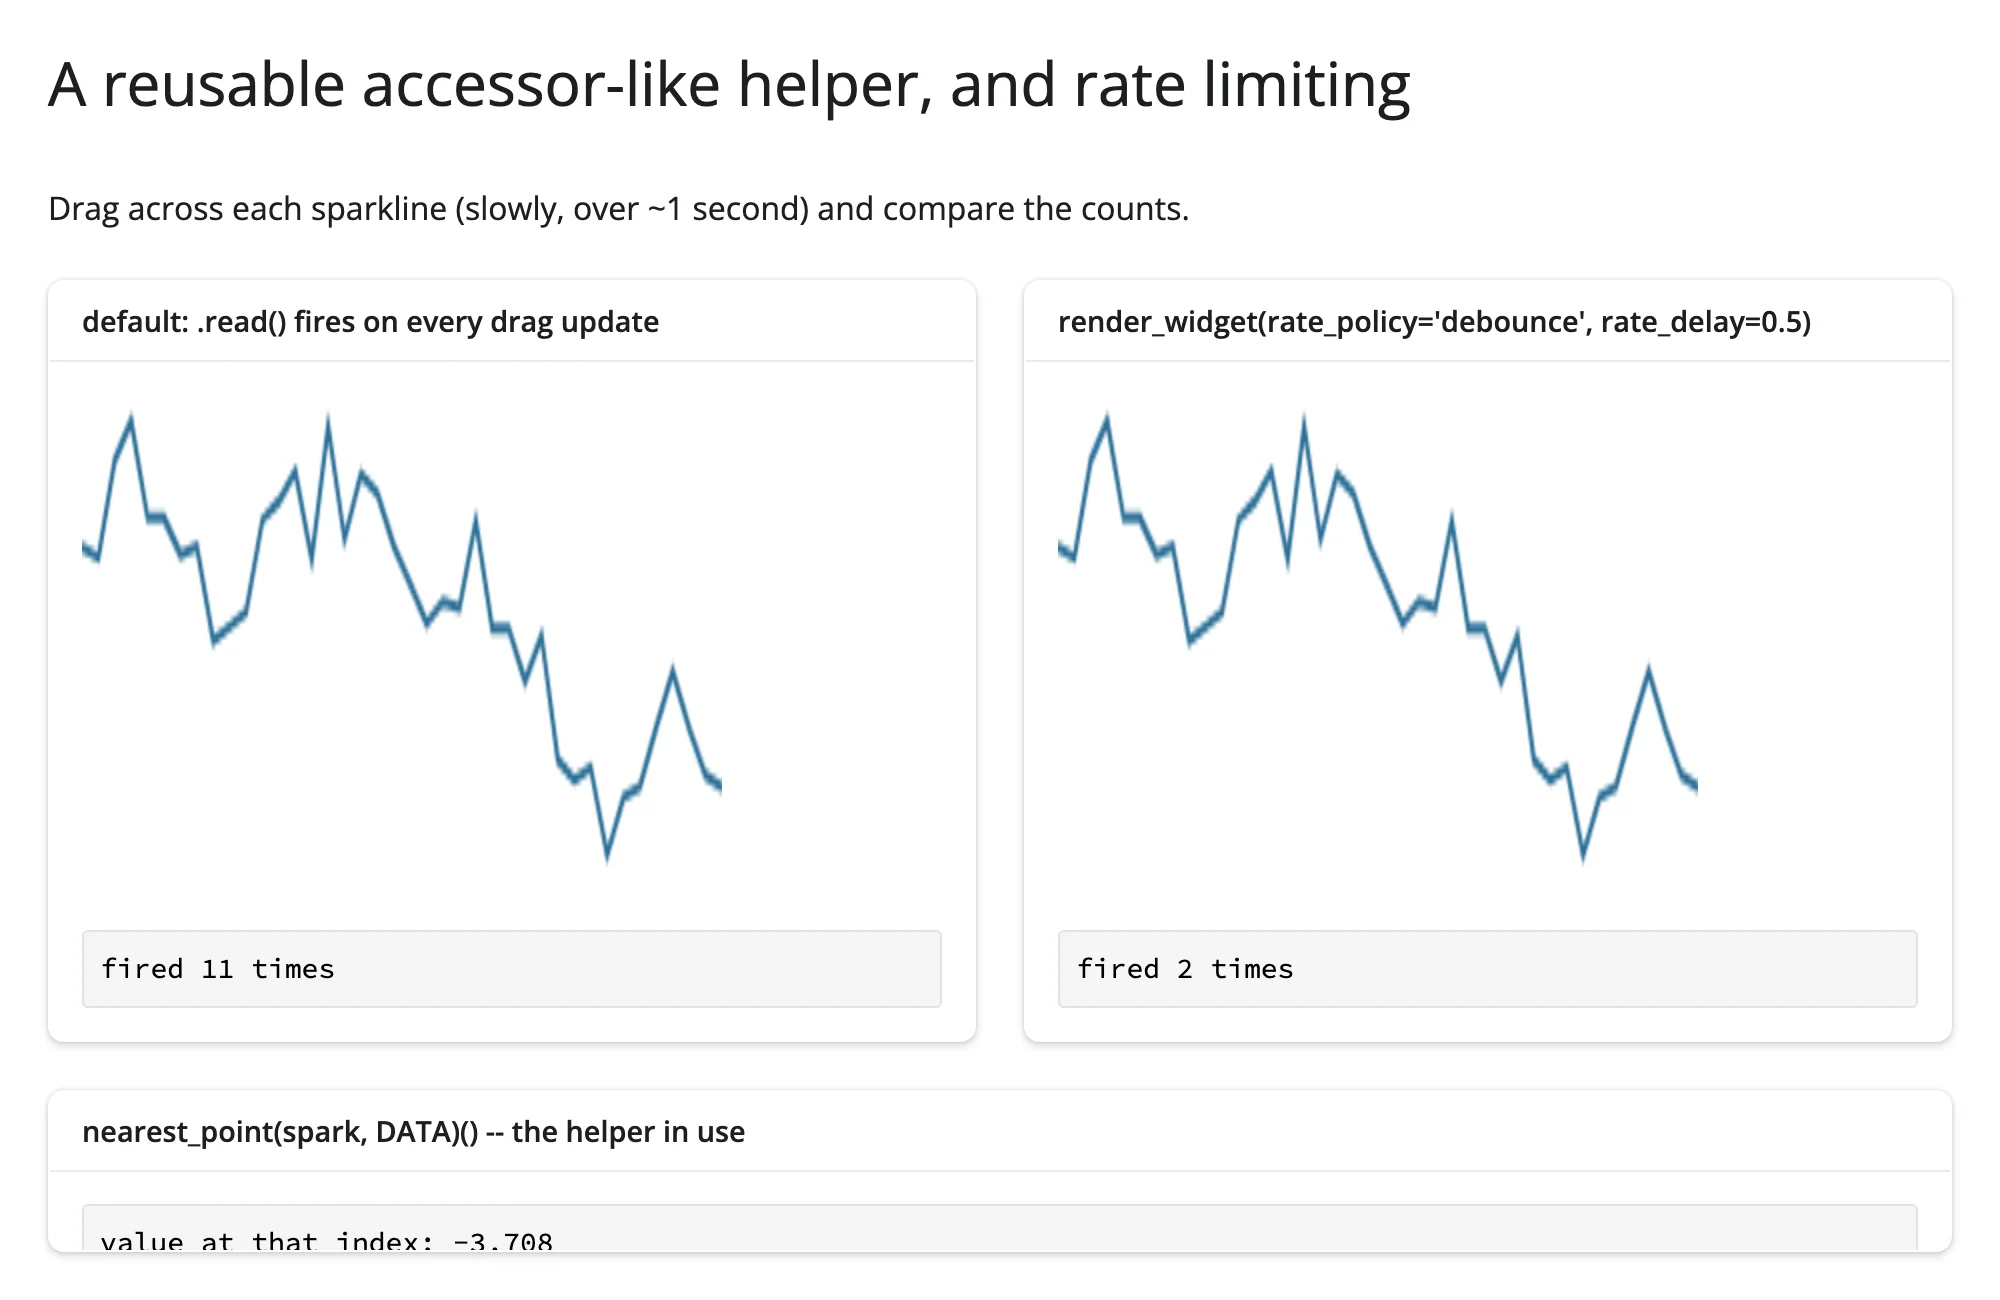
The same drag produces 11 raw updates against the debounced reader’s 2 – rate_delay only governs .read()/reactive_read() calls on that specific widget instance (keyed by id(widget)), so two outputs built from two separate instances can have independently tuned rates. The nearest_point() helper at the bottom shows the payoff: callers get a typed data value, not an index they have to look up themselves every time.
Updating the widget from Python
Every in-place example above follows the same shape: read or mutate .widget from a @reactive.effect, rather than making the render function depend on the same state (which would rebuild the widget from scratch). This is covered in full, with the reactive.isolate() caveat for self-referential counters, in the Updating in place article’s “Writing back” section – everything there applies unchanged to a hand-built anywidget; there’s nothing render_widget-specific about it beyond what each example above already demonstrates (spark.widget.values = ..., heatmap.widget.counts = ..., map.widget.add_call(...)).
Coordinating multiple views
Custom widget brush -> filtered table
import numpy as np
import pandas as pd
from shiny import reactive
from shiny.express import render, ui
from shinywidgets import render_widget

from sparkline_widget import Sparkline

rng = np.random.default_rng(5)
values = rng.normal(size=60).cumsum()
df = pd.DataFrame({"day": range(len(values)), "value": values})

ui.page_opts(title="Custom widget brush -> filtered table", fillable=True)
ui.markdown("Drag across the sparkline to select a range of days.")

with ui.layout_columns(col_widths=[7, 5]):
    with ui.card():
        ui.card_header("Sparkline -- drag to brush a range")

        @render_widget
        def spark():
            return Sparkline(values=list(values))

        # The widget's own `brush` reports [start_index, end_index]; feed it
        # right back in as `highlight` so the brushed range stays visibly
        # marked on the SAME widget (in place -- see "Updating the widget
        # from Python"), not just reflected in the table on the right.
        @reactive.effect
        def _mark_brush():
            lo, hi = spark.read("brush") or (0, -1)
            spark.widget.highlight = list(range(lo, hi + 1))

    with ui.card(full_screen=True):
        ui.card_header("Rows inside the brushed range")

        @render.data_frame
        def filtered():
            brush = spark.read("brush")
            if not brush:
                return render.DataGrid(df.iloc[0:0])
            lo, hi = brush
            return render.DataGrid(df.iloc[lo : hi + 1])
Before any interaction, and after dragging across a falling section of the line:
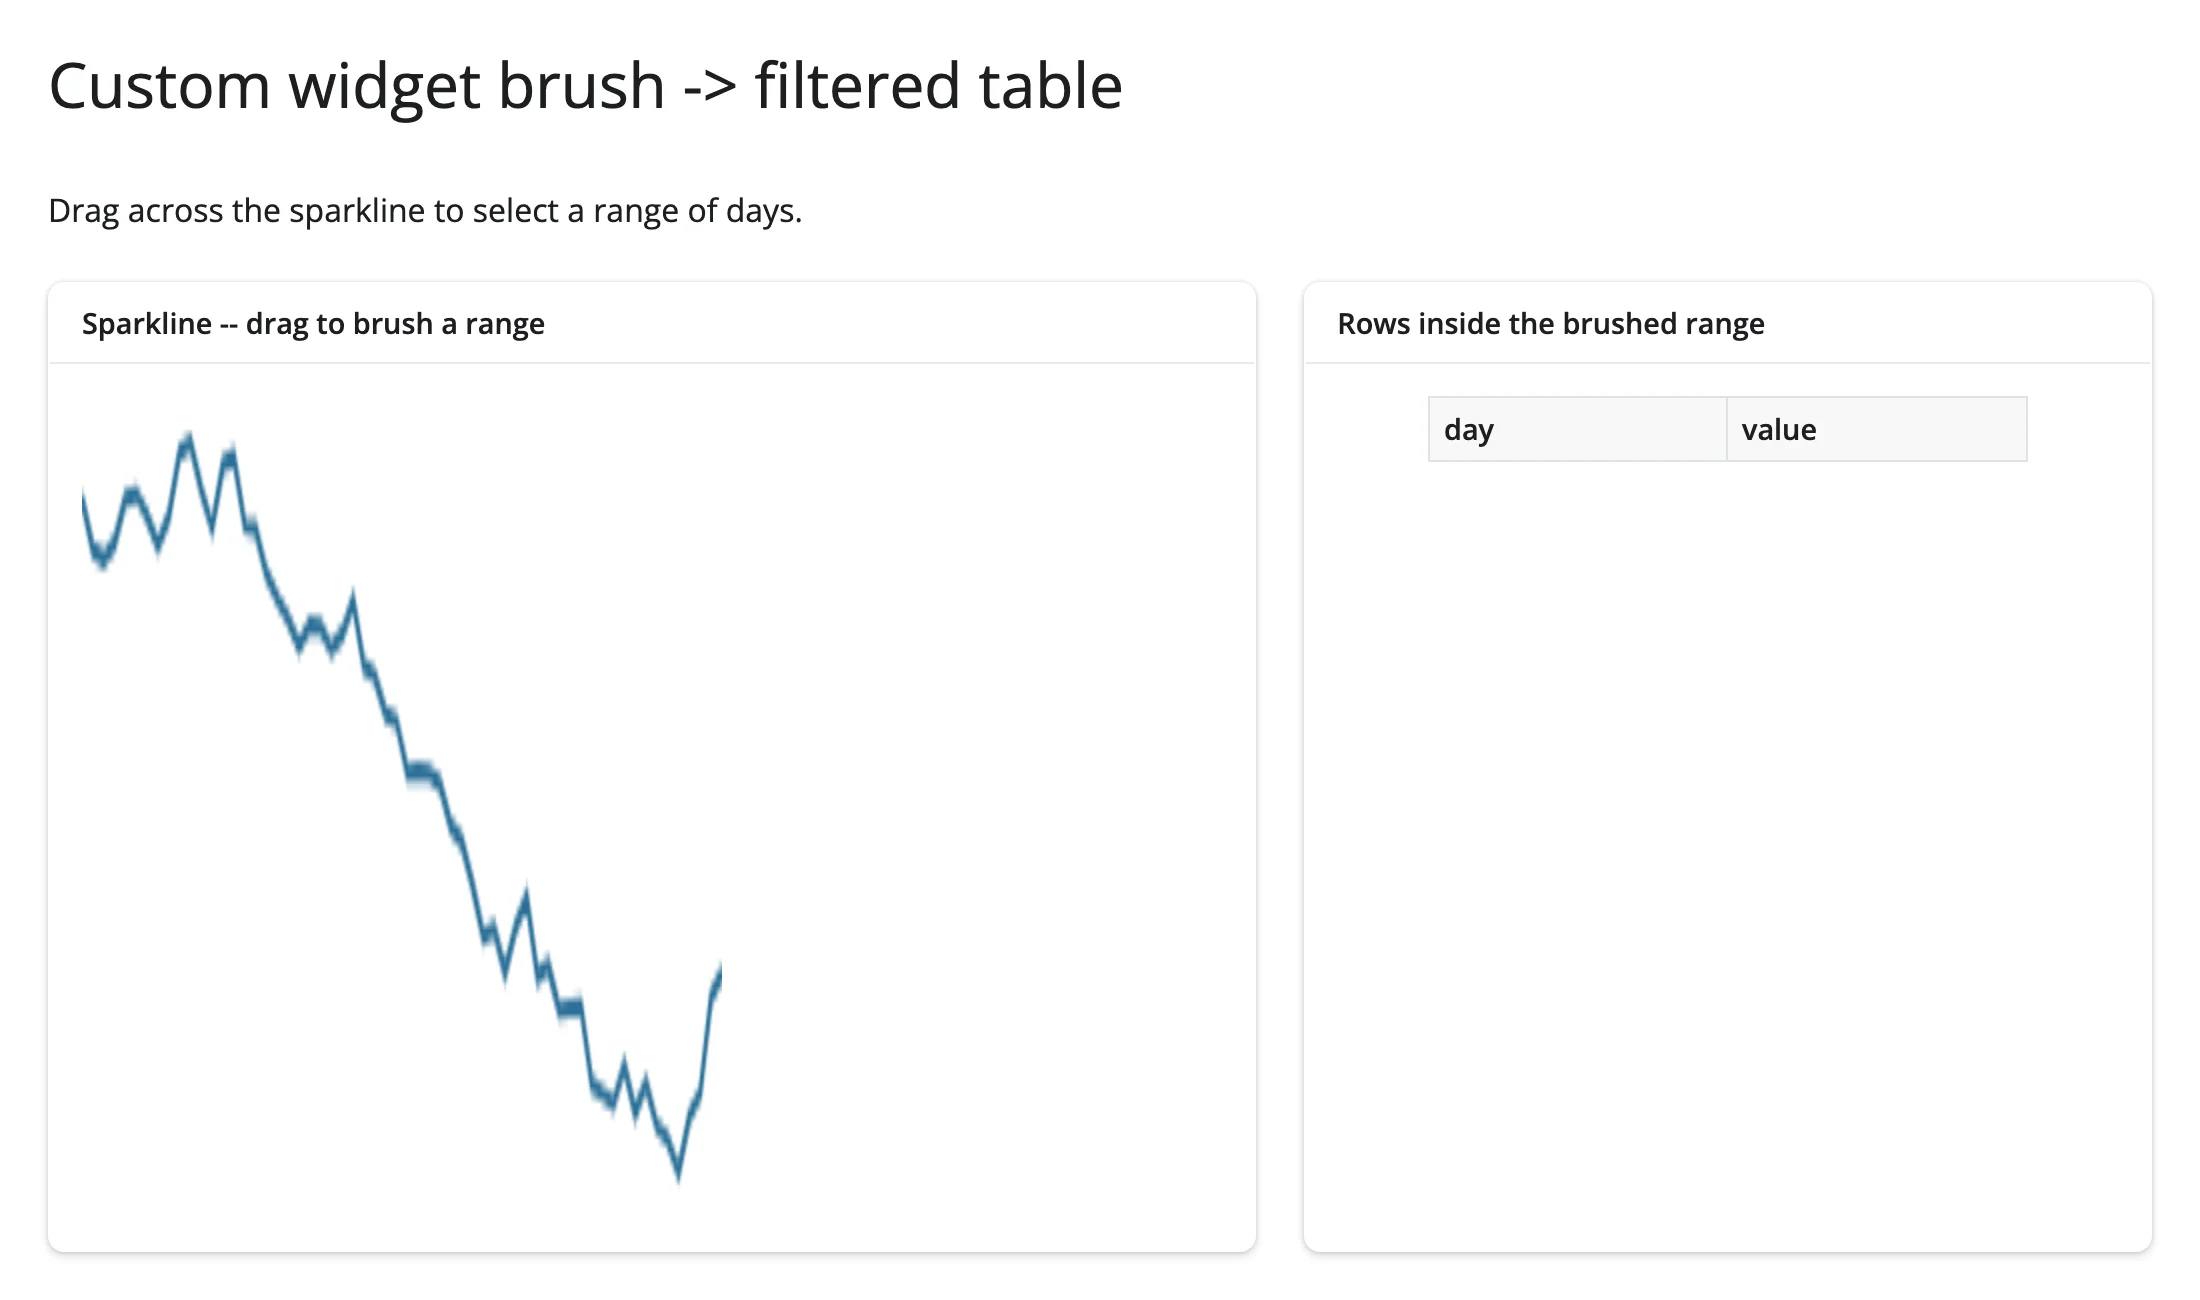
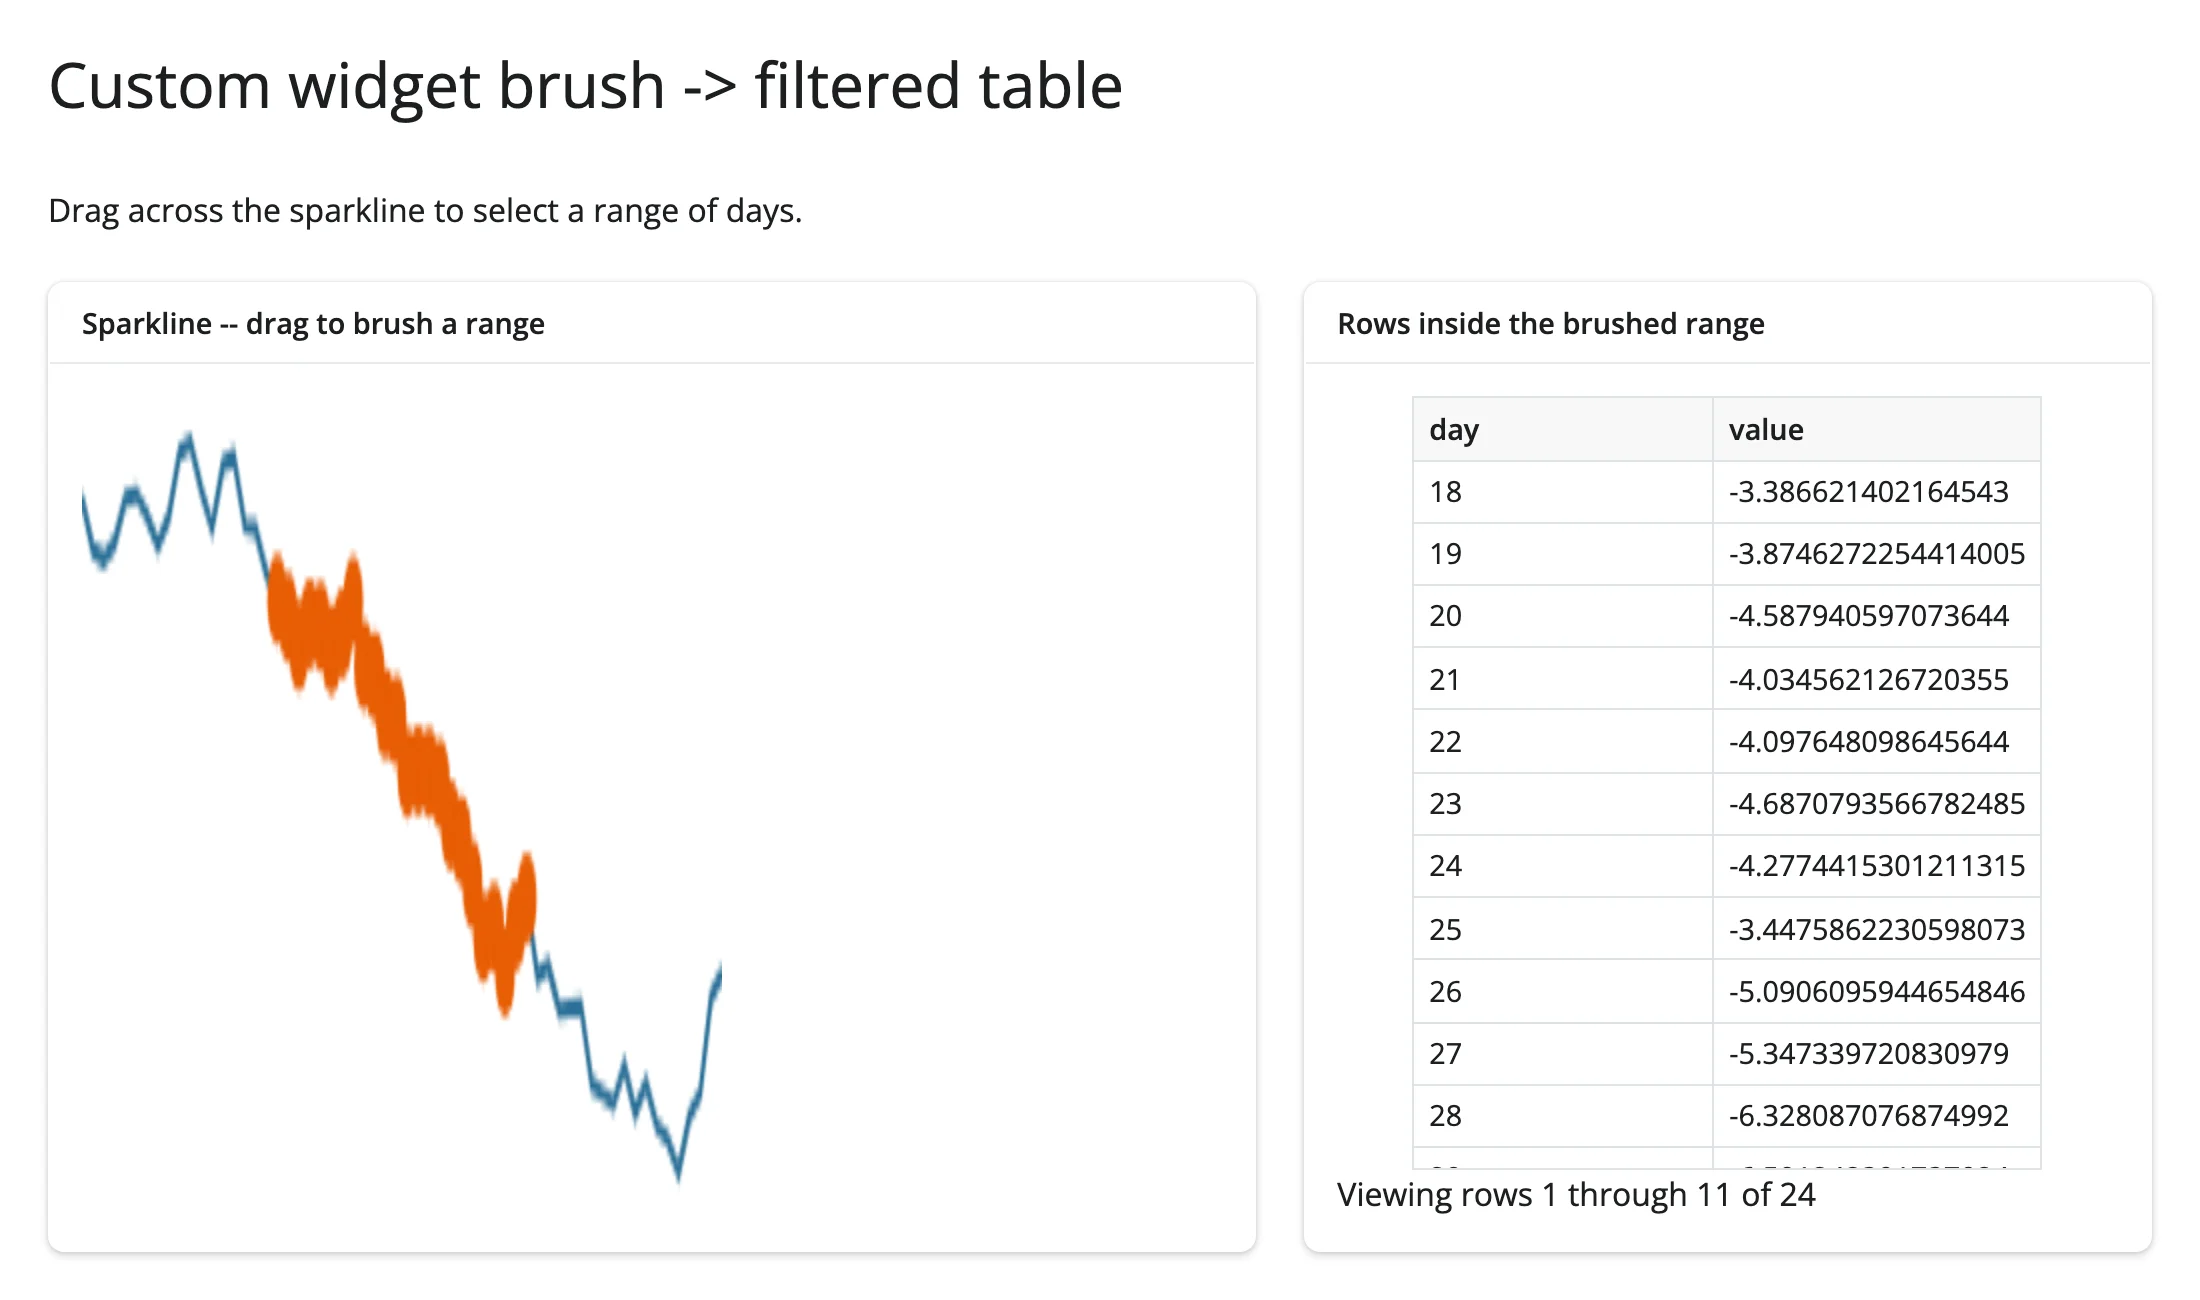
The brushed range drives two things at once: the table on the right (a derived view), and the same widget’s own highlight trait (an in-place update, so the selection stays visibly marked without a re-render).
Table row selection -> custom widget highlight
import numpy as np
import pandas as pd
from shiny import reactive
from shiny.express import render, ui
from shinywidgets import render_widget

from sparkline_widget import Sparkline

rng = np.random.default_rng(6)
values = rng.normal(size=30).cumsum()
df = pd.DataFrame({"day": range(len(values)), "value": values.round(3)})

ui.page_opts(title="Table row selection -> custom widget highlight", fillable=True)

with ui.layout_columns(col_widths=[5, 7]):
    with ui.card(full_screen=True):
        ui.card_header("Select a row")

        @render.data_frame
        def table():
            return render.DataGrid(df, selection_mode="row")

    with ui.card():
        ui.card_header("The same row, highlighted in place on the sparkline")

        @render_widget
        def spark():
            return Sparkline(values=list(values))

        # Shiny's own render.data_frame accessor (.cell_selection()) drives a
        # widget that has nothing to do with tables: no re-render, just an
        # in-place trait write on the existing Sparkline instance.
        @reactive.effect
        def _sync_highlight():
            rows = table.cell_selection()["rows"]
            spark.widget.highlight = list(rows)
Before selecting a row, and after selecting row 10 (a local peak in the series):
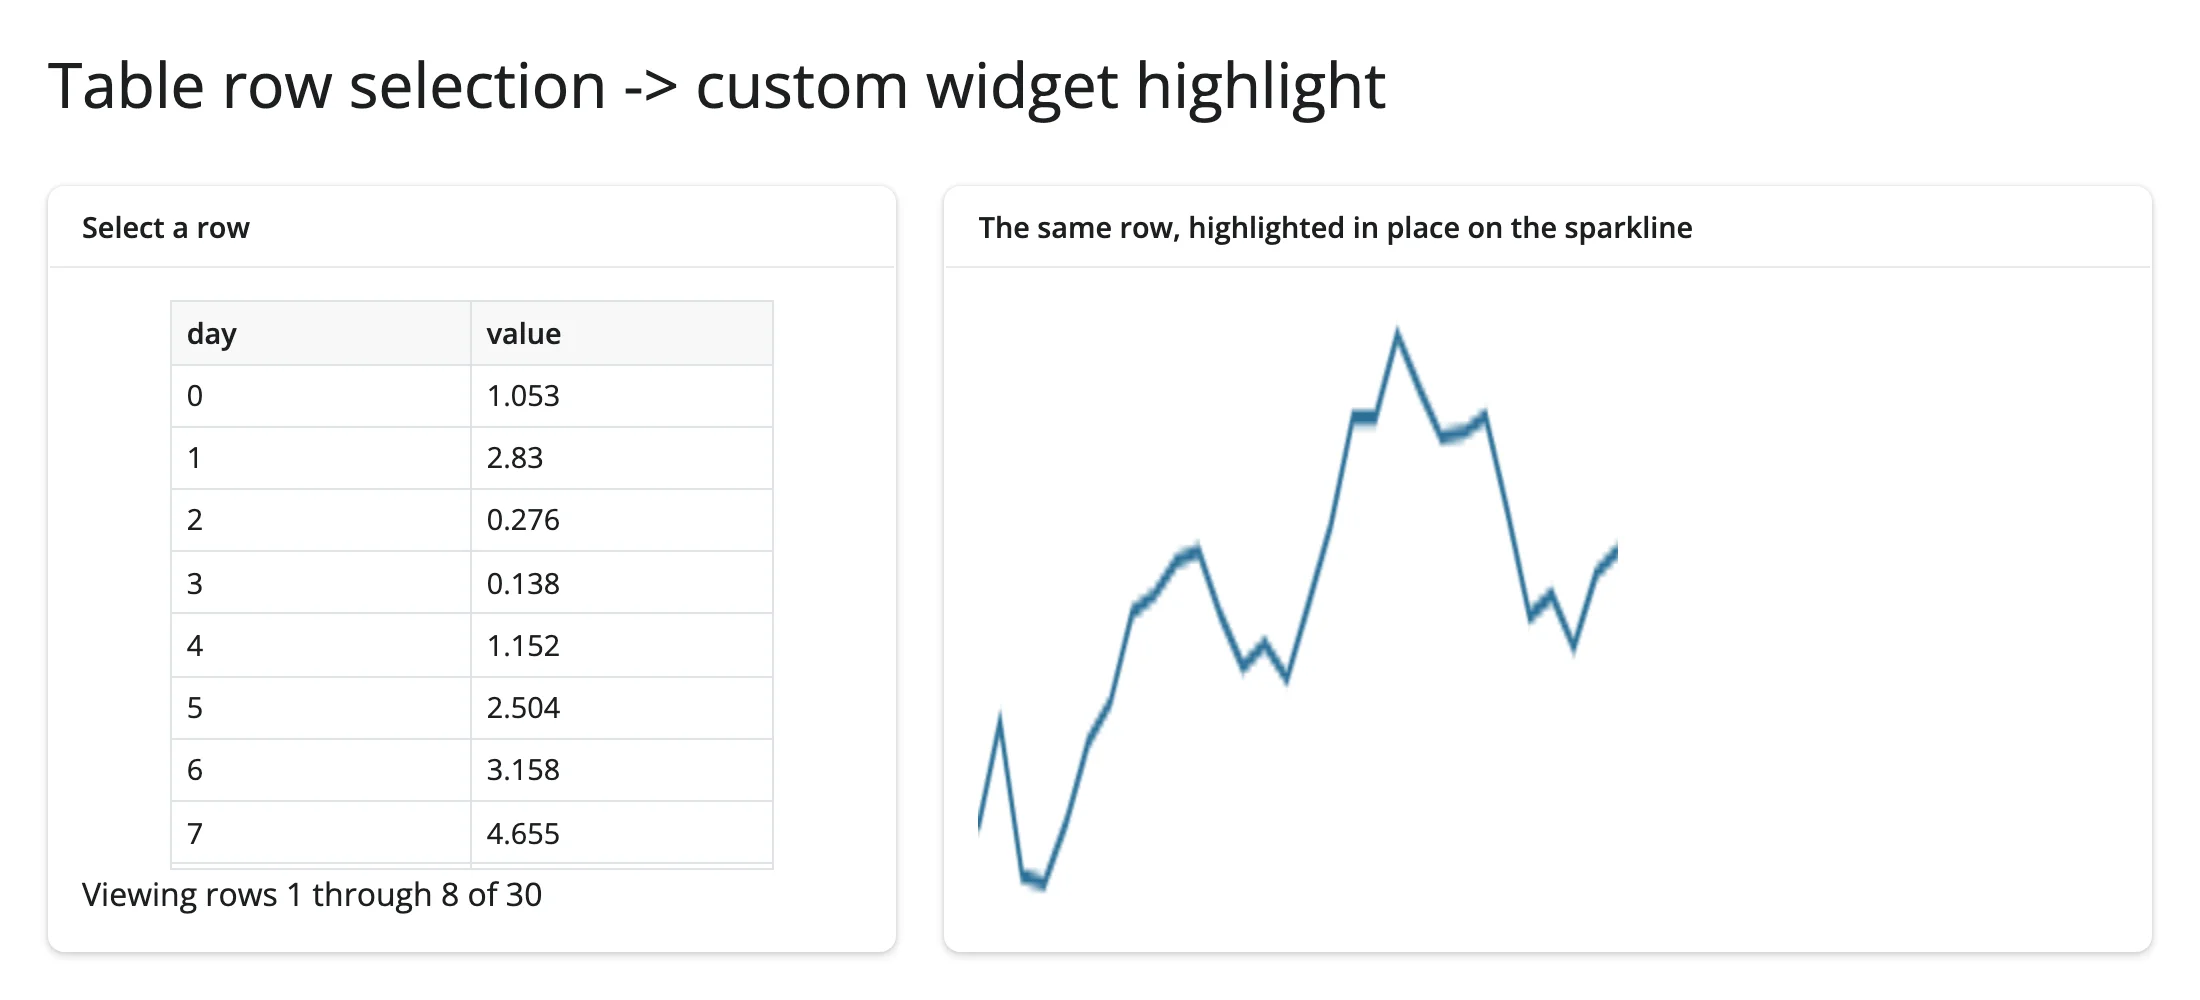
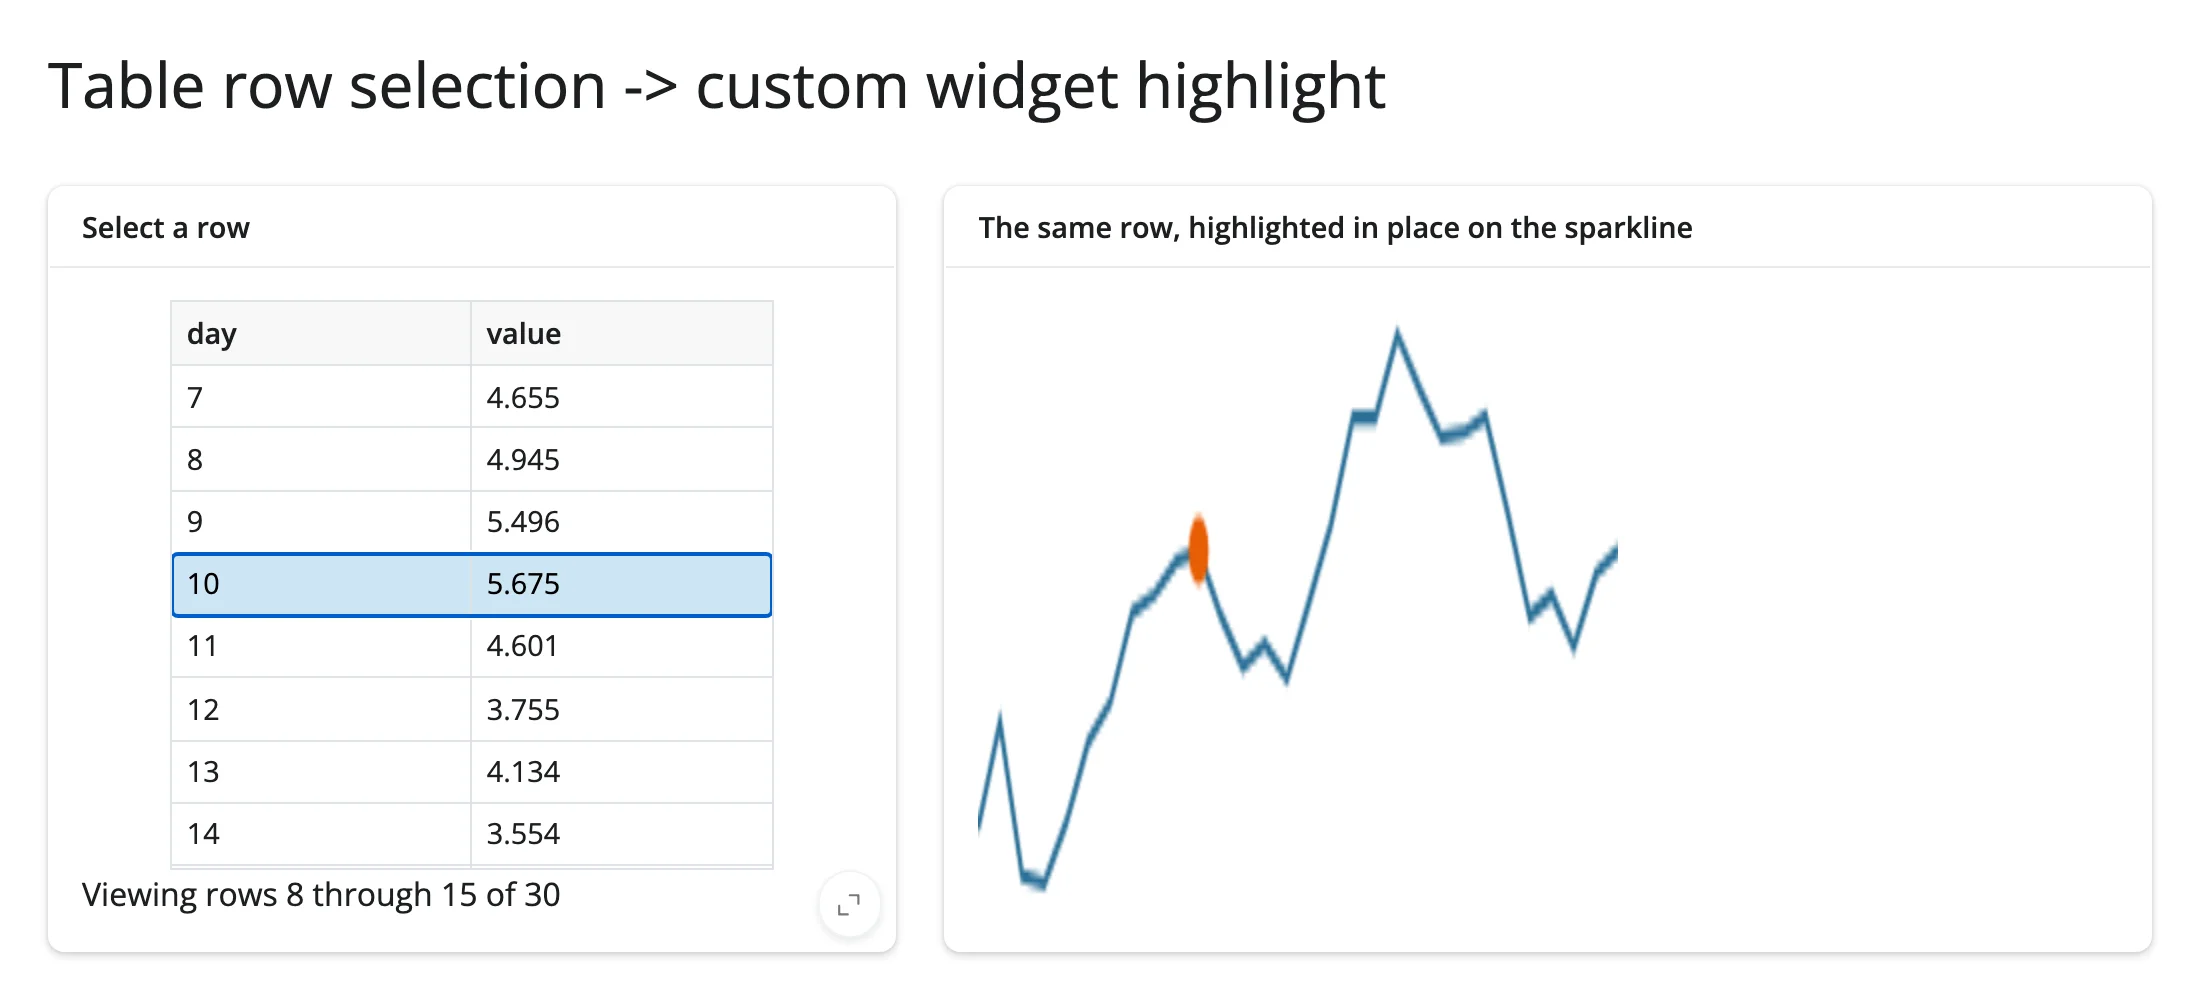
This is the reverse pairing: a built-in Shiny output (render.data_frame’s own cell_selection()) drives a custom widget. Nothing about the custom widget needs to know it’s being driven by a table – it just has a highlight trait, and anything that can compute a list of indices can set it.
(These two patterns generalize directly to the roster’s own widgets: swap render.data_frame for render_plotly/render_itables/render_reactable and their own selected_rows() accessors are drop-in replacements for table.cell_selection()["rows"]; swap the custom Sparkline for any roster widget’s .widget and the same “read one side, write the other’s trait in place” shape applies.)
Layout and sizing
render_widget applies the same generic fill logic every renderer shares (set_layout_defaults() in _render_widget_base.py): a DOMWidget fills its container by default, unless it has an explicit Layout(height=...) (other than "auto"), in which case it renders at its natural size instead. One case is specific to the generic path, and worth knowing before you build your own widget:
- Plain ipywidgets controls never fill, regardless of layout. Any widget whose
_model_moduleis@jupyter-widgets/controls(every slider, dropdown, checkbox, …) opts out of fill sizing entirely – see the empty space below the slider in Quick start. This only applies to the base controls package; a few specific libraries (plotly, altair, bokeh, …) get their own fill handling layered on top, which is why a plotly figure fills its card but anIntSliderdoesn’t. - A
<canvas>-based widget needs to handle its own sizing, or it will be stretched – and blurred – to fill its container. The fill behavior is implemented asflex: 1 1 autoon the widget’s direct child in the DOM; a<canvas>element’swidth/heightattributes (its drawing-buffer resolution) don’t count as a CSS size for that rule’s purposes, only an explicitstyle.width/style.heightdoes. This guide’sSparklinewidget pins its CSS size to its buffer size (see the comment insparkline_widget.py) to stay crisp at a fixed size; a widget that should genuinely scale with its container instead needs aResizeObserverthat resizes the canvas’s drawing buffer (ideally bywindow.devicePixelRatio) and redraws whenever the container’s size changes – not built in this guide’s examples, but worth knowing if your widget needs to fill a resizable card.
Gotchas and limitations
Verified on current main (commit d882da46):
ipydeck’s deck.gl-style accessor properties require a literal@@=string prefix (get_position="@@=position", notget_position="position"); the plain form silently renders nothing, with no console error. This is the opposite ofpydeck’s own convention, so pydeck snippets don’t port verbatim.- mapwidget’s three backends are browser-to-Python only for
center/zoom: assigningmap.widget.center = [...]from Python changes the Python-side trait, but none of the three backends register a JS-sidechange:centerhandler, so the rendered map never moves. Useadd_call("flyTo", ...)(maplibre) or re-render instead. with out: print(...)inside anipywidgets.Output()renders nothing – not a shinywidgets limitation, but expected:Output.__enter__/__exit__work by recording the current Jupyter kernel’s message id so the frontend can later match incoming IOPub stream messages to that output, the same mechanism any notebook cell uses for its stdout. shinywidgets has no real IPython kernel, so that id is never set, andprint()just writes to the server process’s literal stdout (verified: the printed text shows up in the server log, not the browser). Useout.append_stdout(...)/out.append_display_data(...)/out.clear_output()instead – these mutate the widget’soutputstrait directly, which is the normal state-sync path shinywidgets already handles correctly, and render exactly as expected (verified). A plainipywidgets.Labelwith direct.valueassignment, as used in Plain ipywidgets, is a simpler substitute for the common “compute and show a short message” case when you don’t needOutput’s own API.- Pick your output function’s name carefully. It becomes a plain module-level name like any other; naming a
@render_widgetoutputmap,list,type,input,filter, or similar shadows the Python builtin (or a Shiny import) of the same name for the rest of that module. Caught during this guide’s own verification: a showcase app named its map outputmap, which broke an unrelated helper function’s use of the builtinmap().
Gallery candidates
gallery/template_anywidget_starter.py – build your own anywidget, wired to Shiny (~80 lines)
A minimal, from-scratch starting point: a click-counter heatmap (an 8x8 grid of divs, redrawn by intensity), wired to a reset button (Python -> JS, in place) and a heatmap.read(...) readout (JS -> Python). Meant to be copied and adapted for a new custom widget.
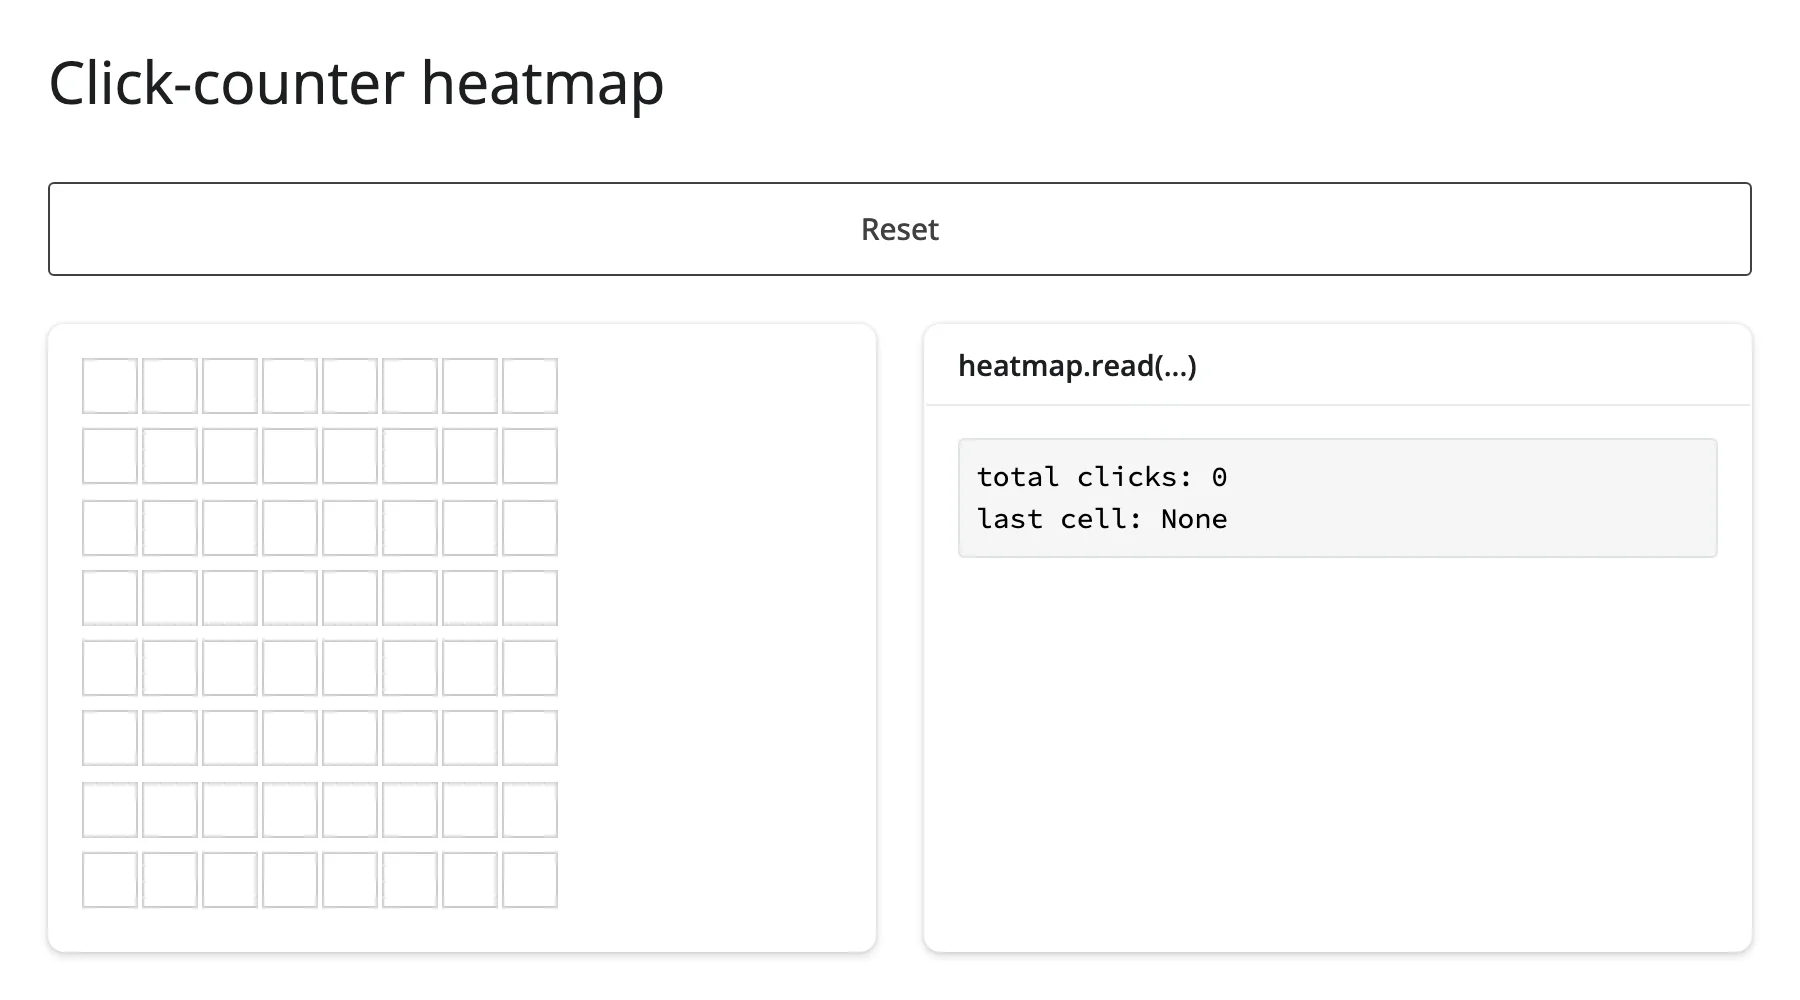
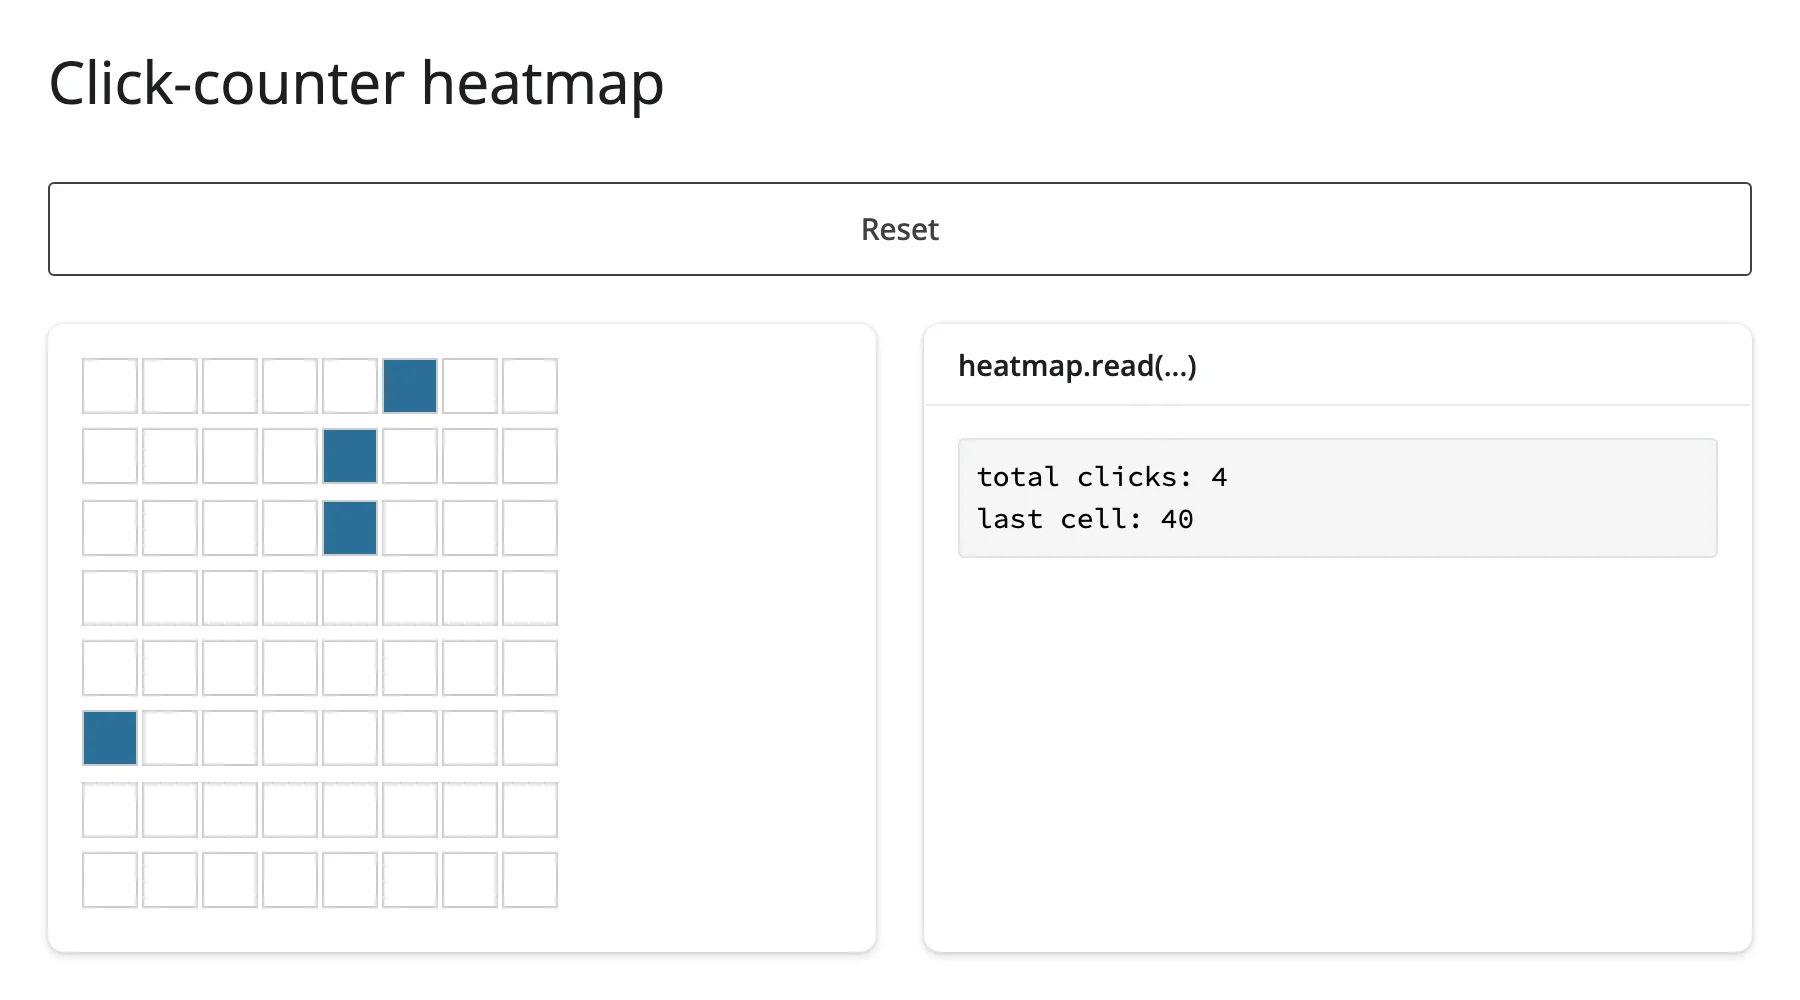
gallery/showcase_mapwidget_engines.py – three map engines, one widget (~110 lines)
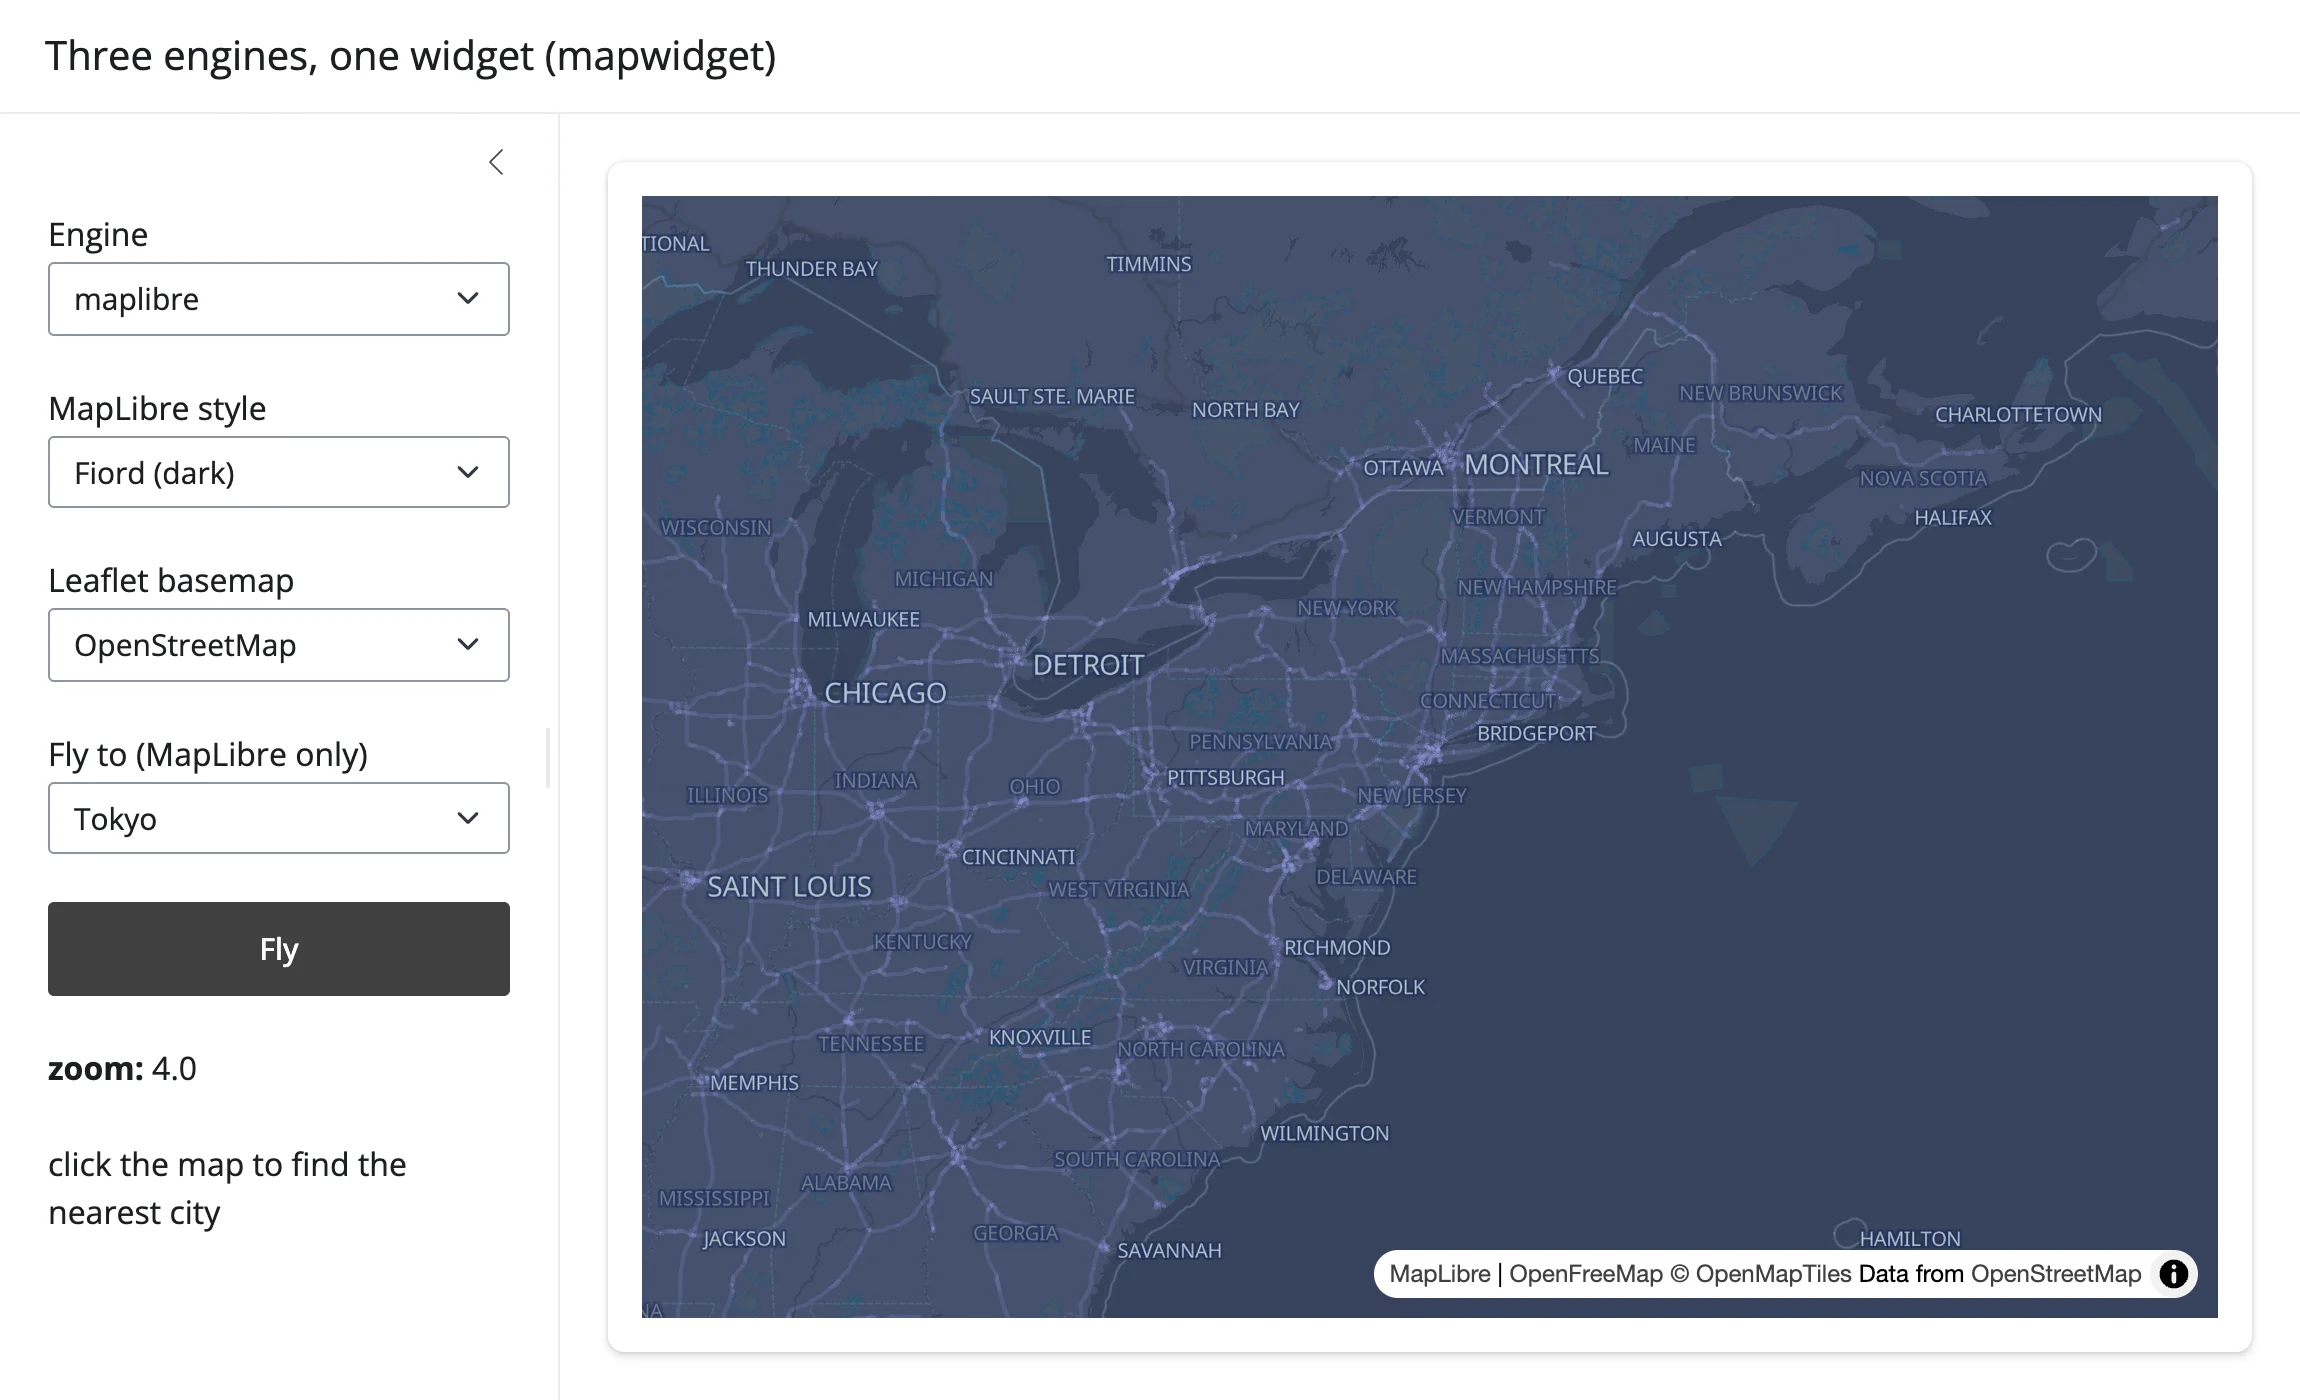
A more developed demo built on mapwidget (the third-party, no-dedicated-renderer widget from “What you can build”): swap between MapLibre GL, Leaflet, and OpenLayers from a dropdown; click the map to look up the nearest of five world cities via mw.read(...); restyle MapLibre or swap the Leaflet basemap in place; fly to a city with an animated add_call("flyTo", ...).
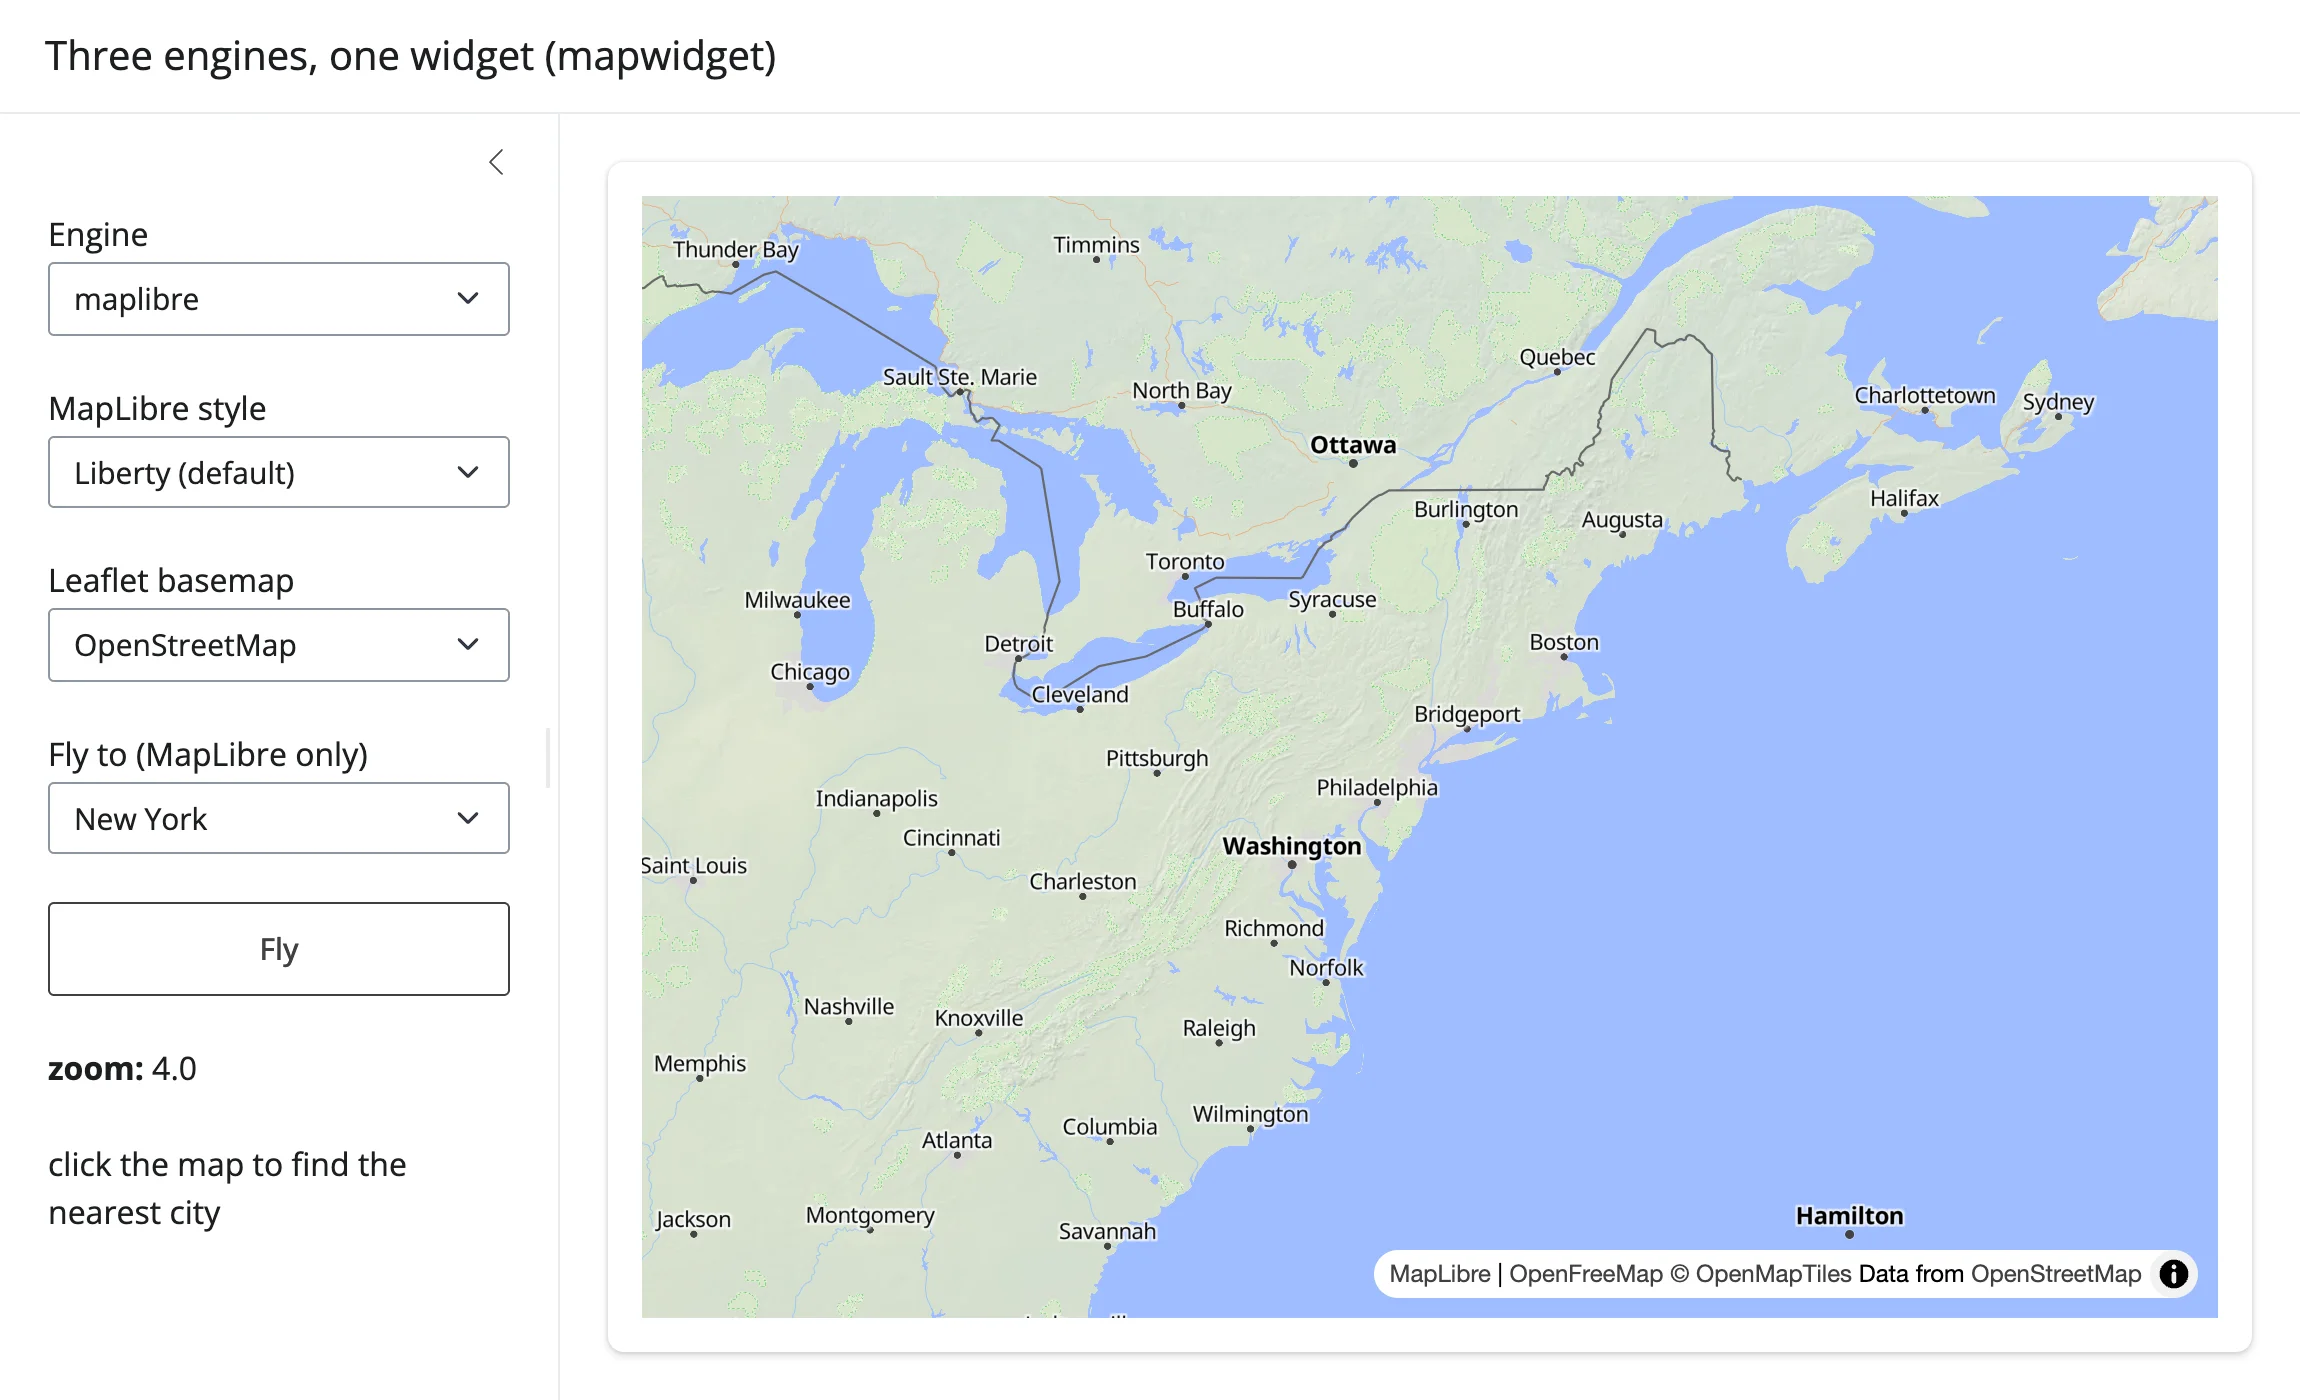
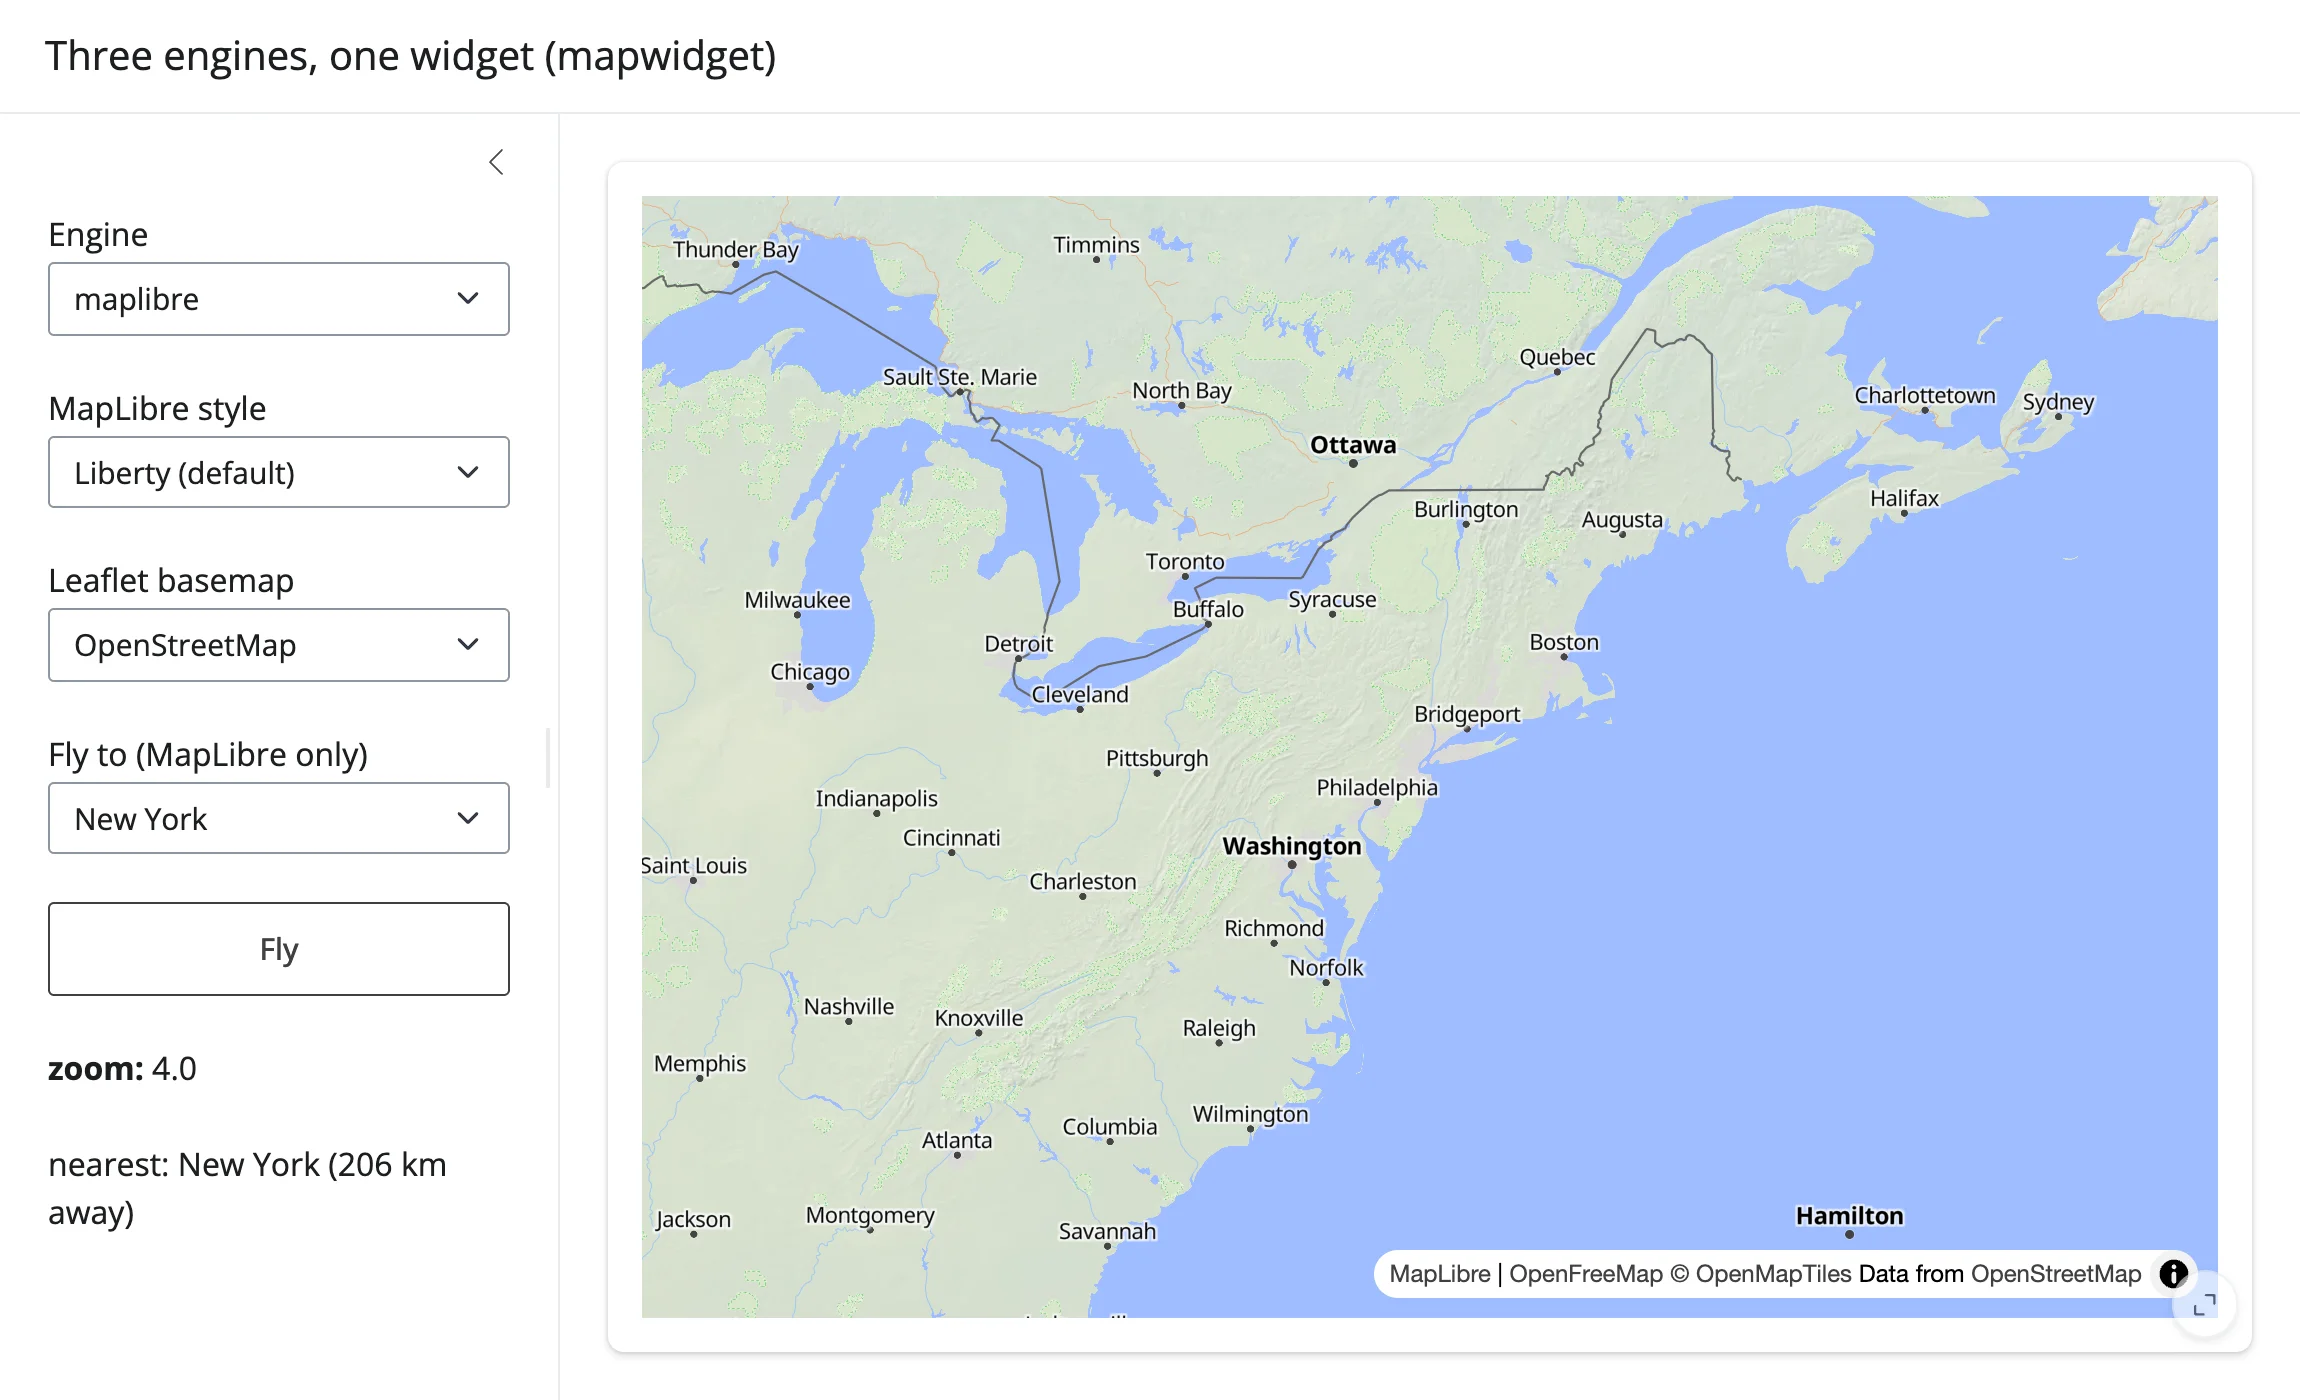
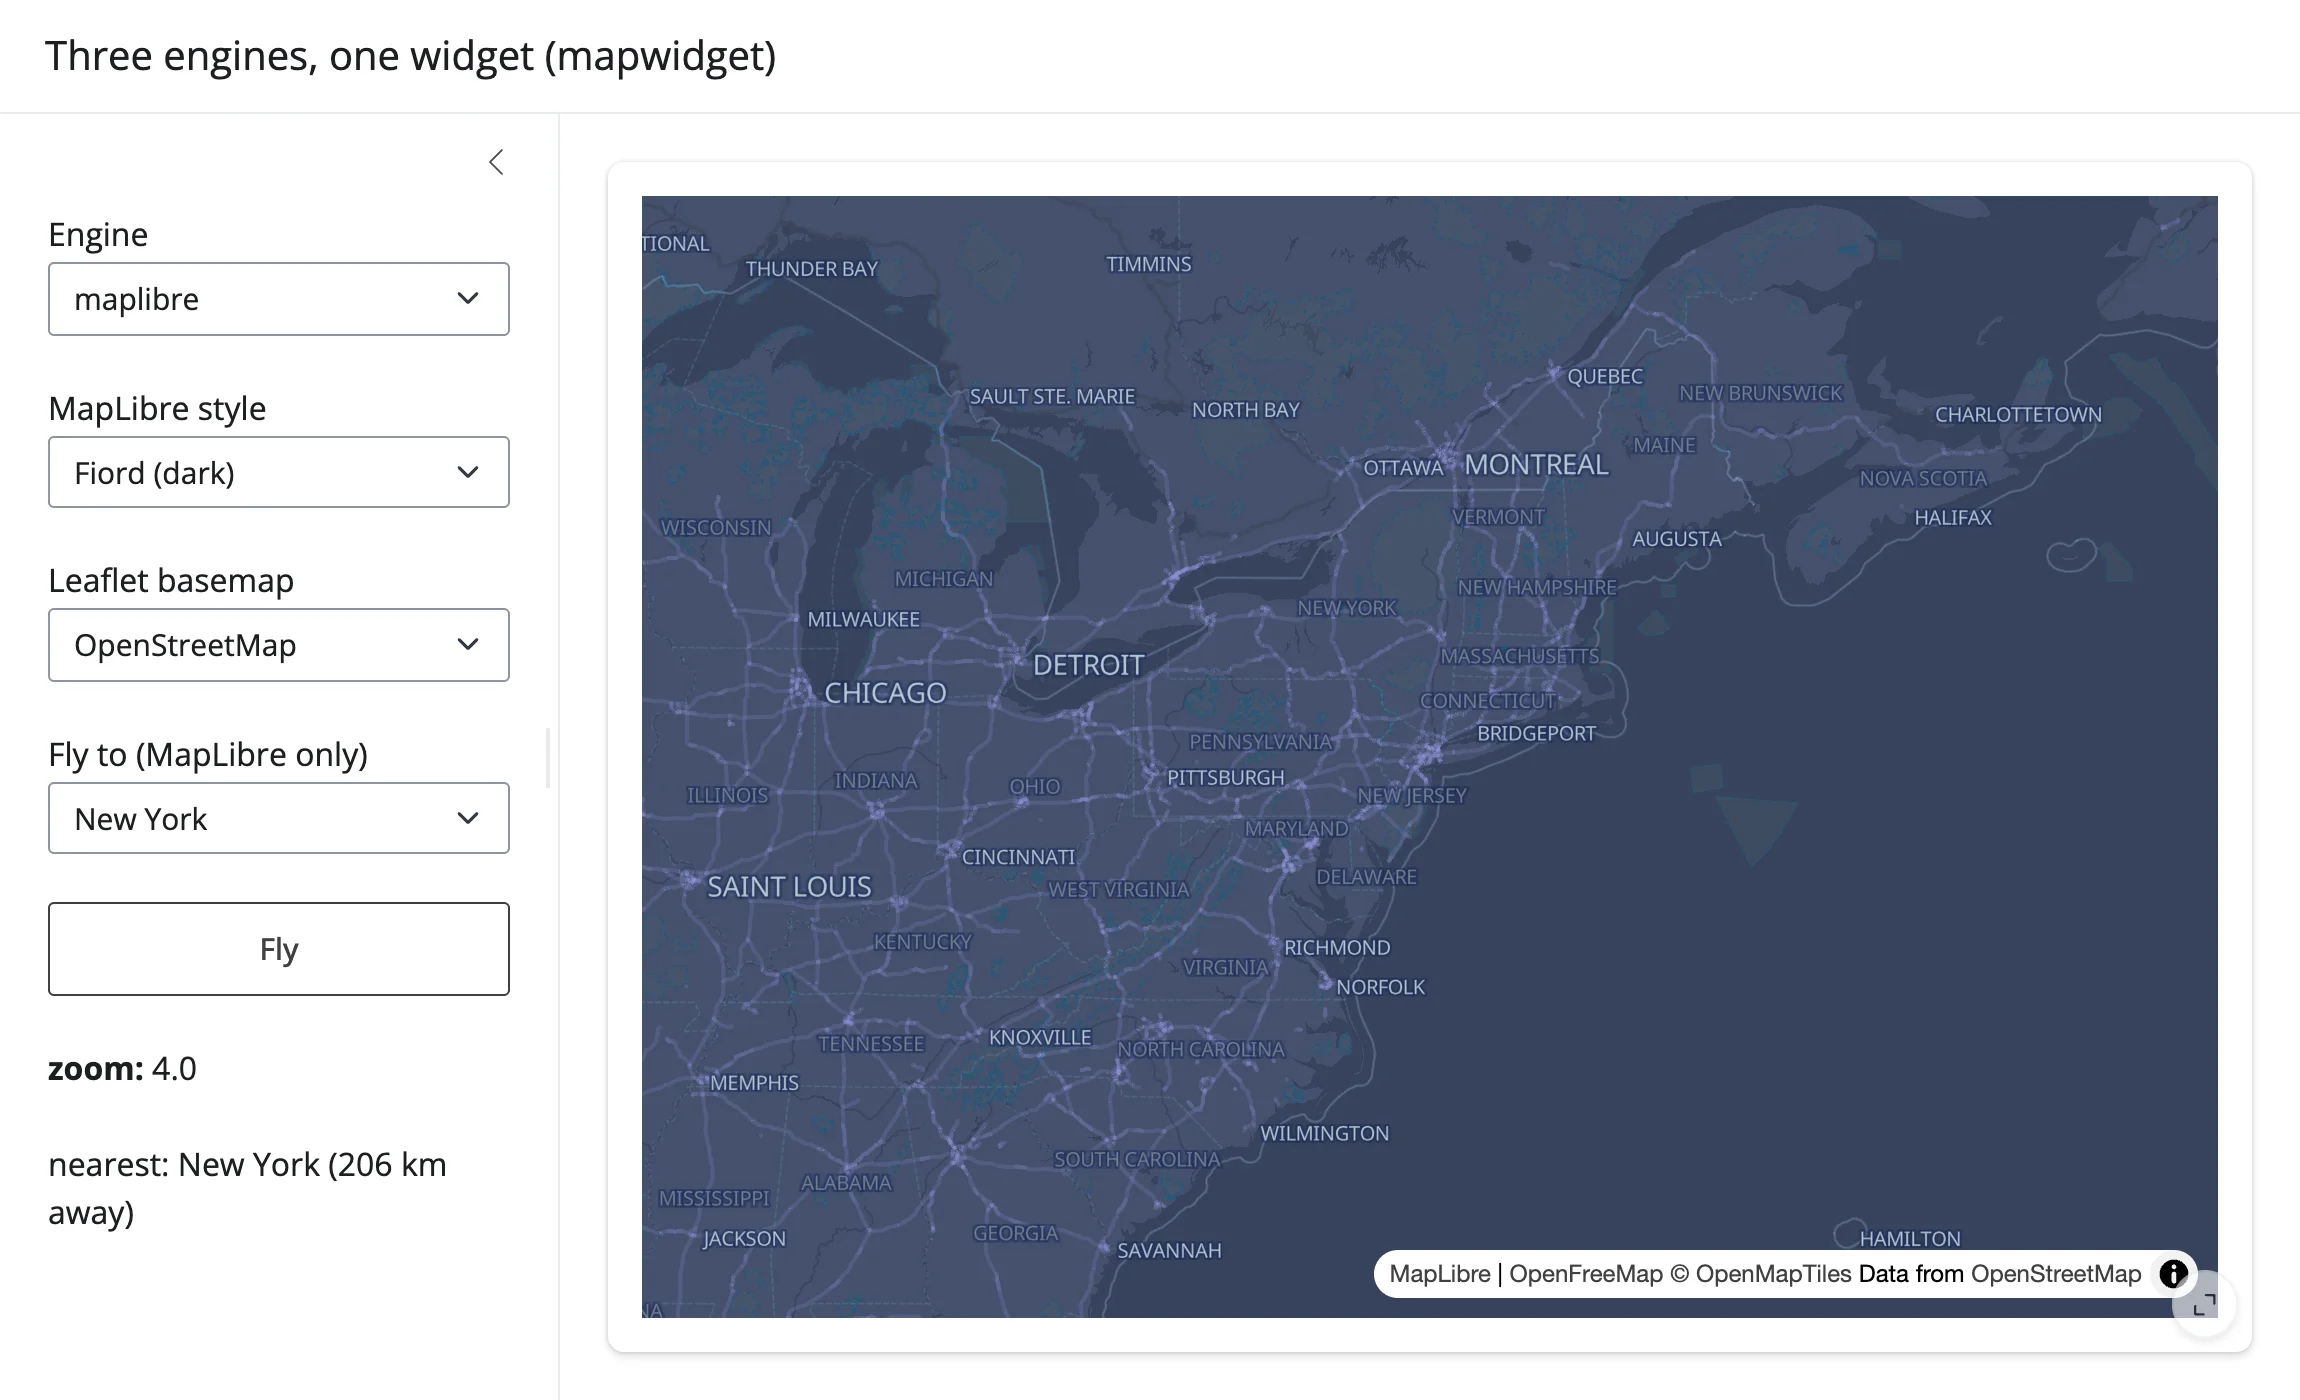
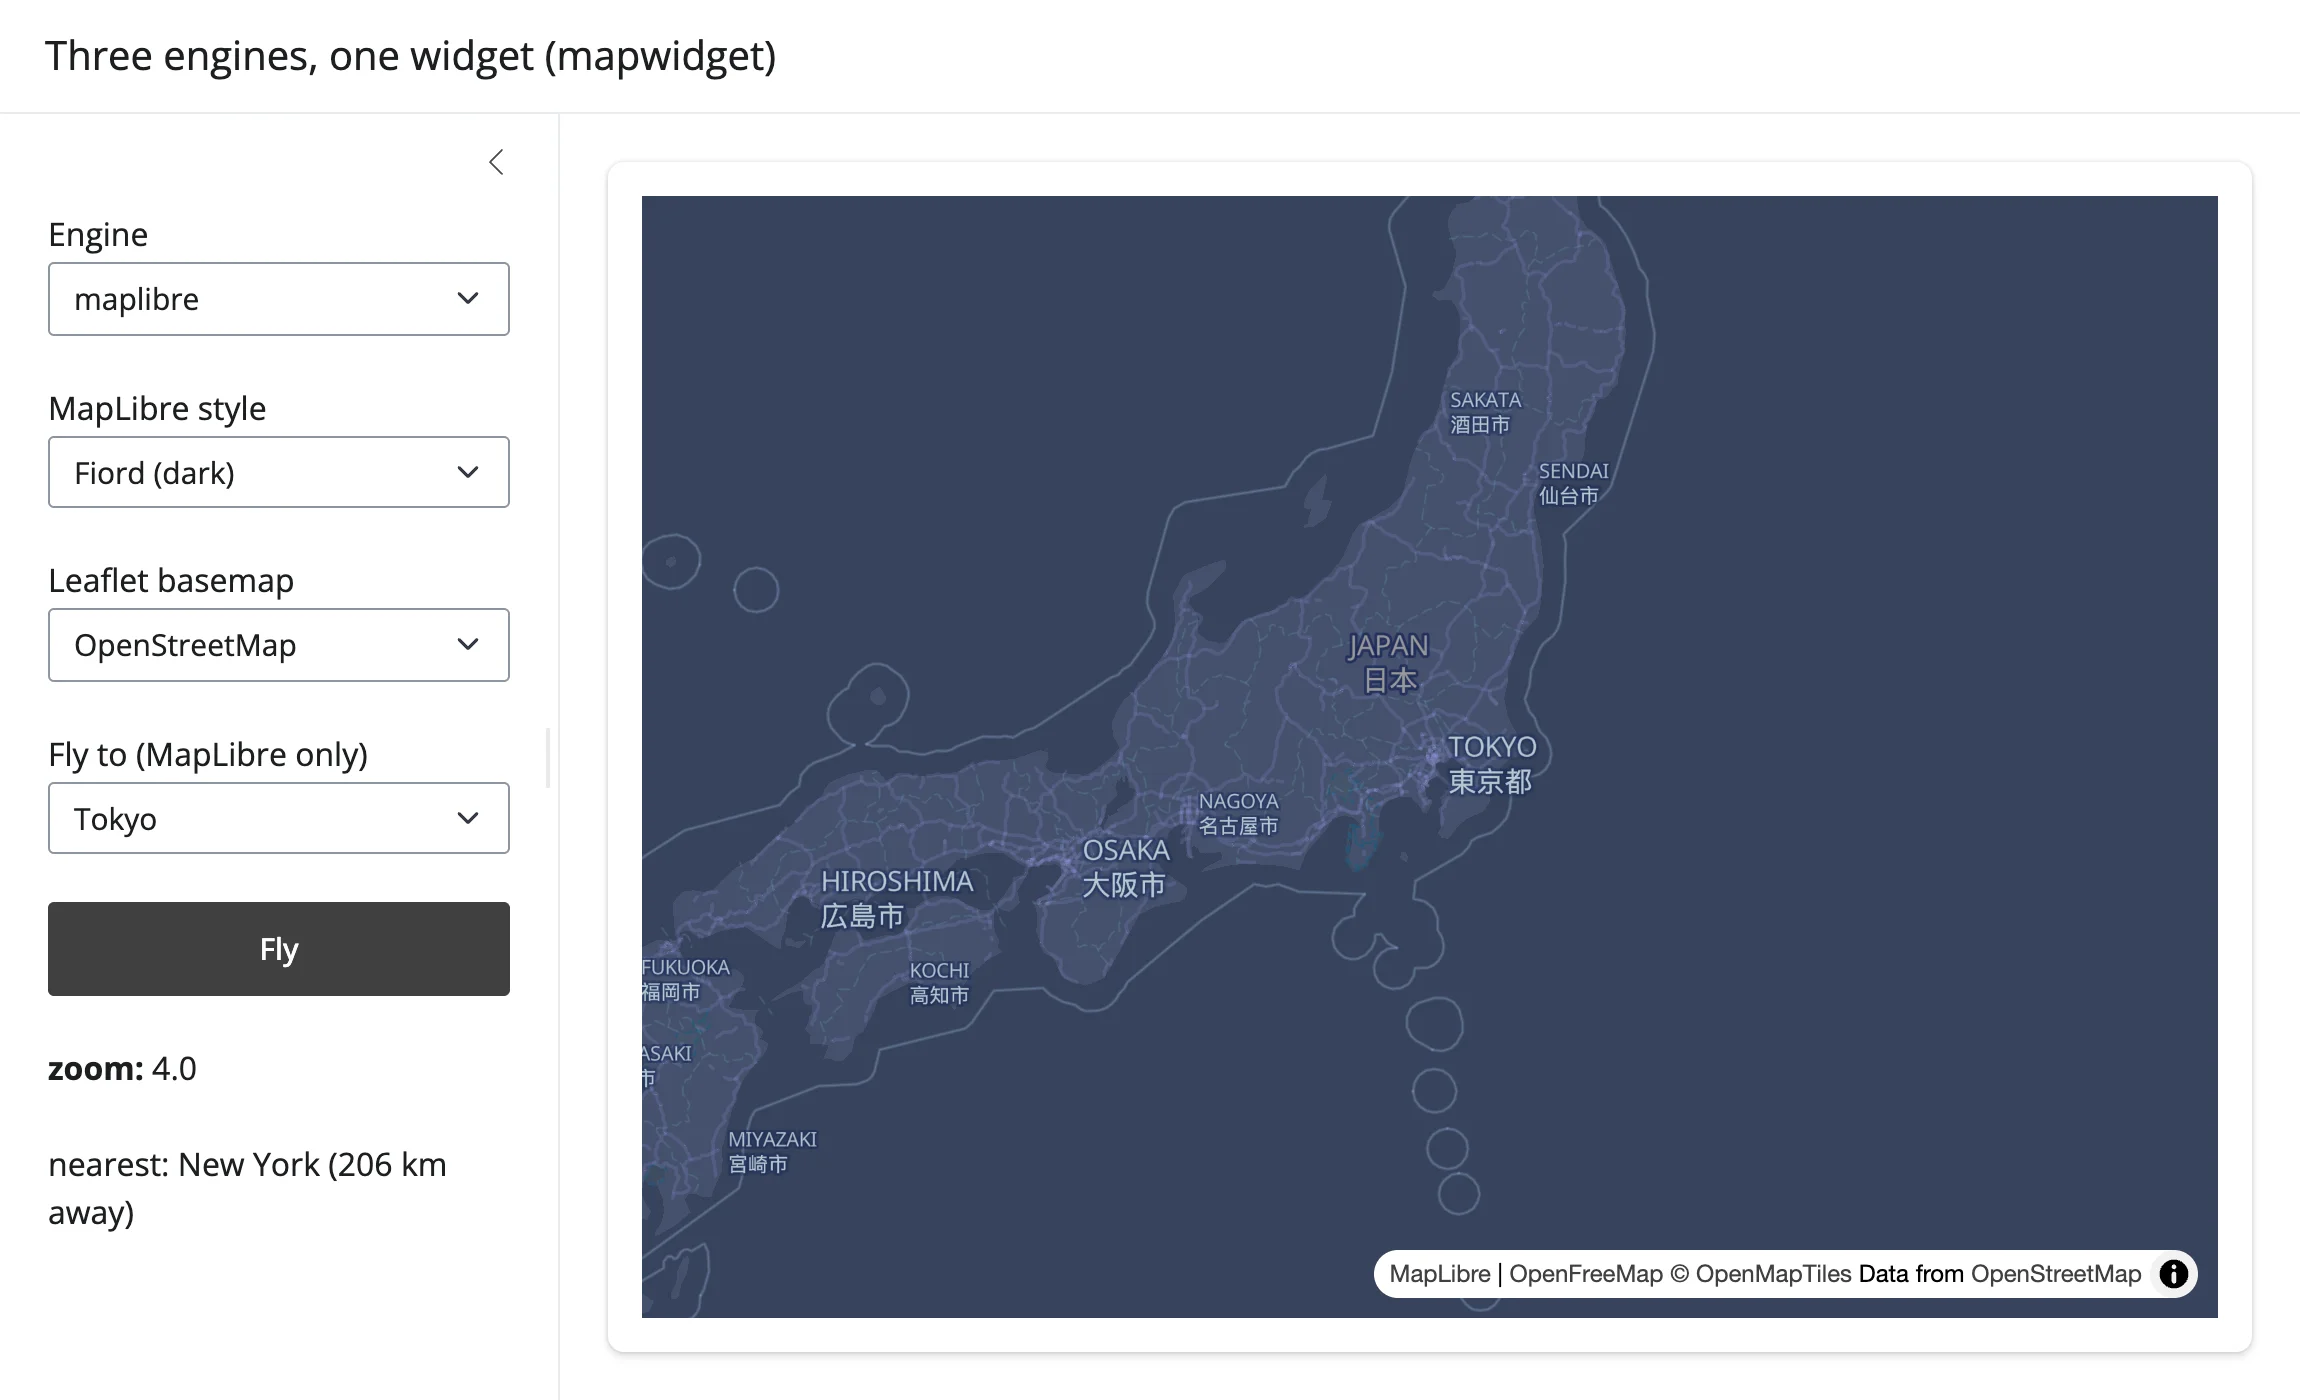
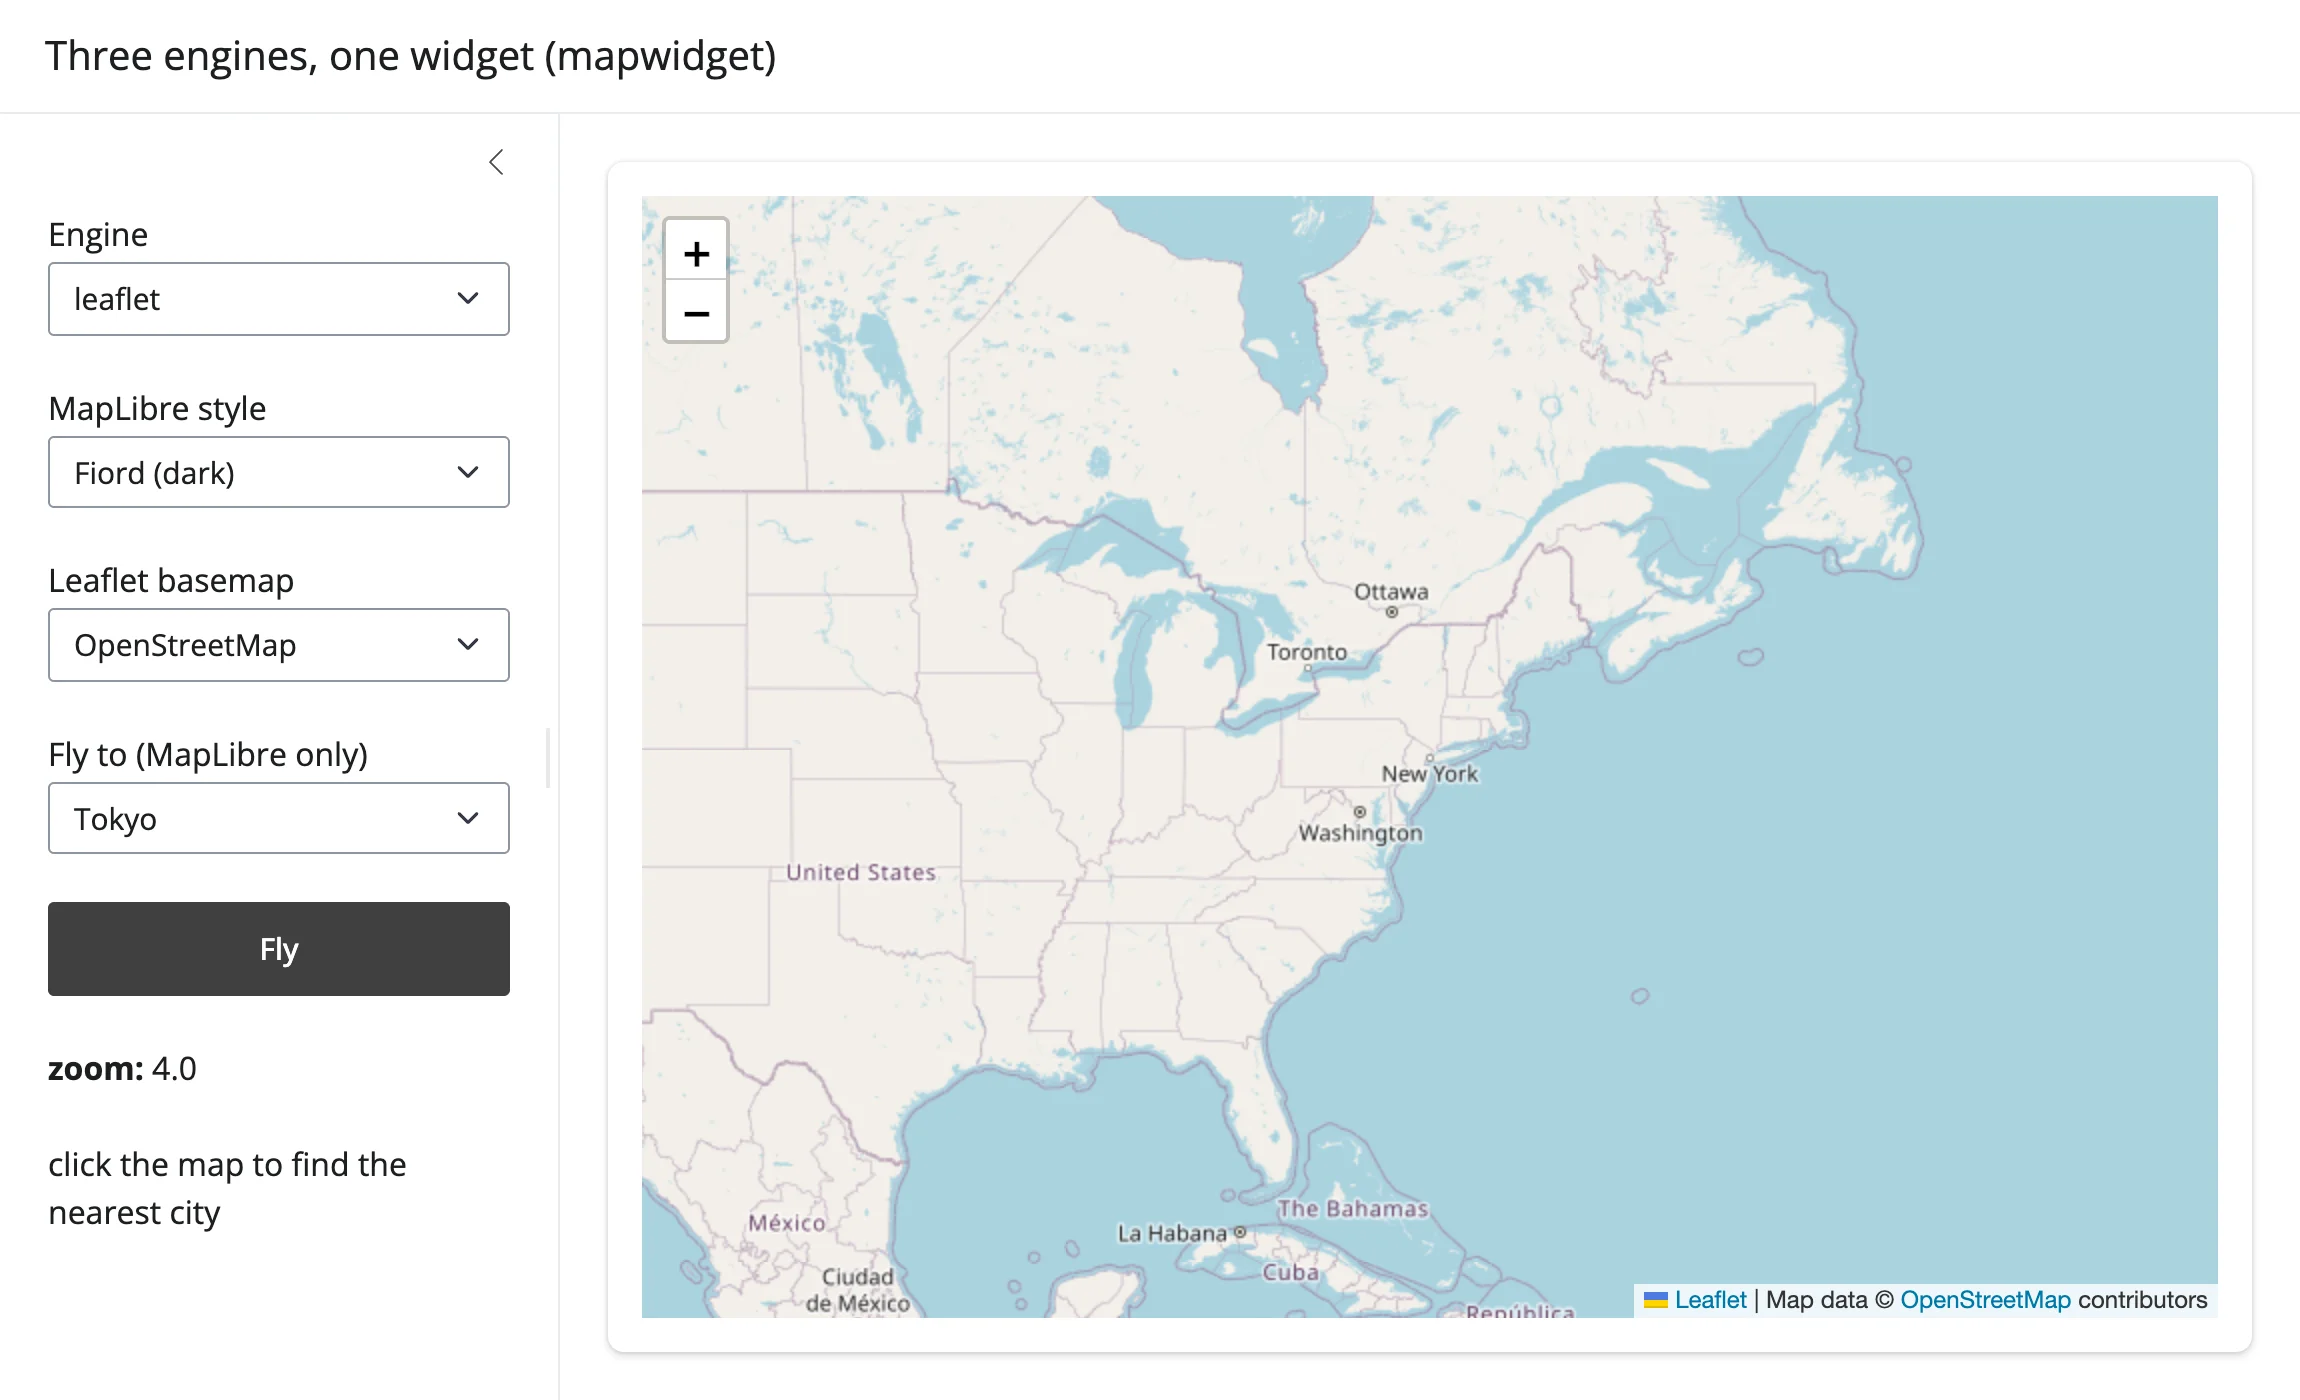
The chosen style also survives an engine swap: switch from MapLibre back to a brand-new MapLibre widget (via Leaflet) with Fiord selected, and the dark style is still applied on the new widget, with no need to touch the style control again – the queued add_call() is delivered once the new widget’s comm opens, not dropped:
Learn more
- ipywidgets documentation – the base
Widget/DOMWidgetAPI every renderer in the roster (and this guide) builds on. - anywidget documentation – the full
_esm/_css/trait contract, plus its own guide to custom serializers for complex trait types. - ipyreact on GitHub – the JSX-component approach to custom widgets, including its hot-reload tutorial notebook.
- Reacting to widgets – the cross-cutting article this guide leans on throughout: the three kinds of “nothing yet,” re-fire/clearing rules, rate limiting,
.read()vs.reactive_read(), writing back without looping, and the three widget lifetimes (session_lifetime()/shared_lifetime()), all demonstrated with roster widgets rather than custom ones. - Any dedicated renderer’s guide (start with plotly or ipyleaflet) for what a library-specific
render_*adds on top of everything in this guide: layout defaults tuned to that library’s quirks, input coercion, and accessors.