Perspective
Perspective is a streaming data-visualization engine built by the FINOS open-source foundation, originally for trading desks that need to pivot, filter, and chart large, fast-moving datasets without round-tripping to a server. Its WebAssembly query engine runs in the browser, so once your data is loaded, re-aggregating by a different group_by or applying a new filter happens instantly client-side.
@render_perspective accepts a pandas or polars DataFrame, a perspective.Table, or a configured perspective.widget.PerspectiveWidget, and hands back a full pivot-table UI: drag-and-drop grouping, a dozen chart plugins, and computed columns. The renderer builds each DataFrame’s table on a private Perspective server, so two sessions’ data never mix even though Perspective itself has no concept of per-user isolation (see “Gotchas” below).
The two accessors, filter() and view_config(), read back the query a user built in the viewer – not just the widget’s cosmetic state. That’s the headline feature: whatever pivot, group, or filter someone sets up in the browser is available in Python as a plain dict, ready to replay against the same table for a server-side computation, a linked chart, or an export.
Reach for Perspective when the user needs to explore a dataset themselves – pivot it, chart it a different way, filter it down – rather than just view a fixed table. For a plain sortable/filterable table without pivoting, see itables or reactable; for a table where Python supplies the exact rows and row selection matters more than client-side pivoting, see ipydatagrid.
Installation
pip install 'shinywidgets[perspective]'This installs perspective-python, which bundles the WebAssembly engine and every chart plugin – no separate JS build step.
Quick start
A bare DataFrame becomes a full datagrid viewer. This guide’s examples use plotly.express’s bundled gapminder dataset (country-level population, life expectancy, and GDP for every five years, 1952-2007) since it’s real, well known, and ships with a package already in the dependency tree. The settings panel (the » toggle, top right) is open by default, since that’s how a user discovers pivoting.
from __future__ import annotations

import plotly.express as px
from shiny.express import ui
from shinywidgets import render_perspective

ui.page_opts(title="Perspective quickstart", fillable=True)

countries = px.data.gapminder().query("year == 2007").drop(columns=["year", "iso_num"])


@render_perspective
def grid():
    return countries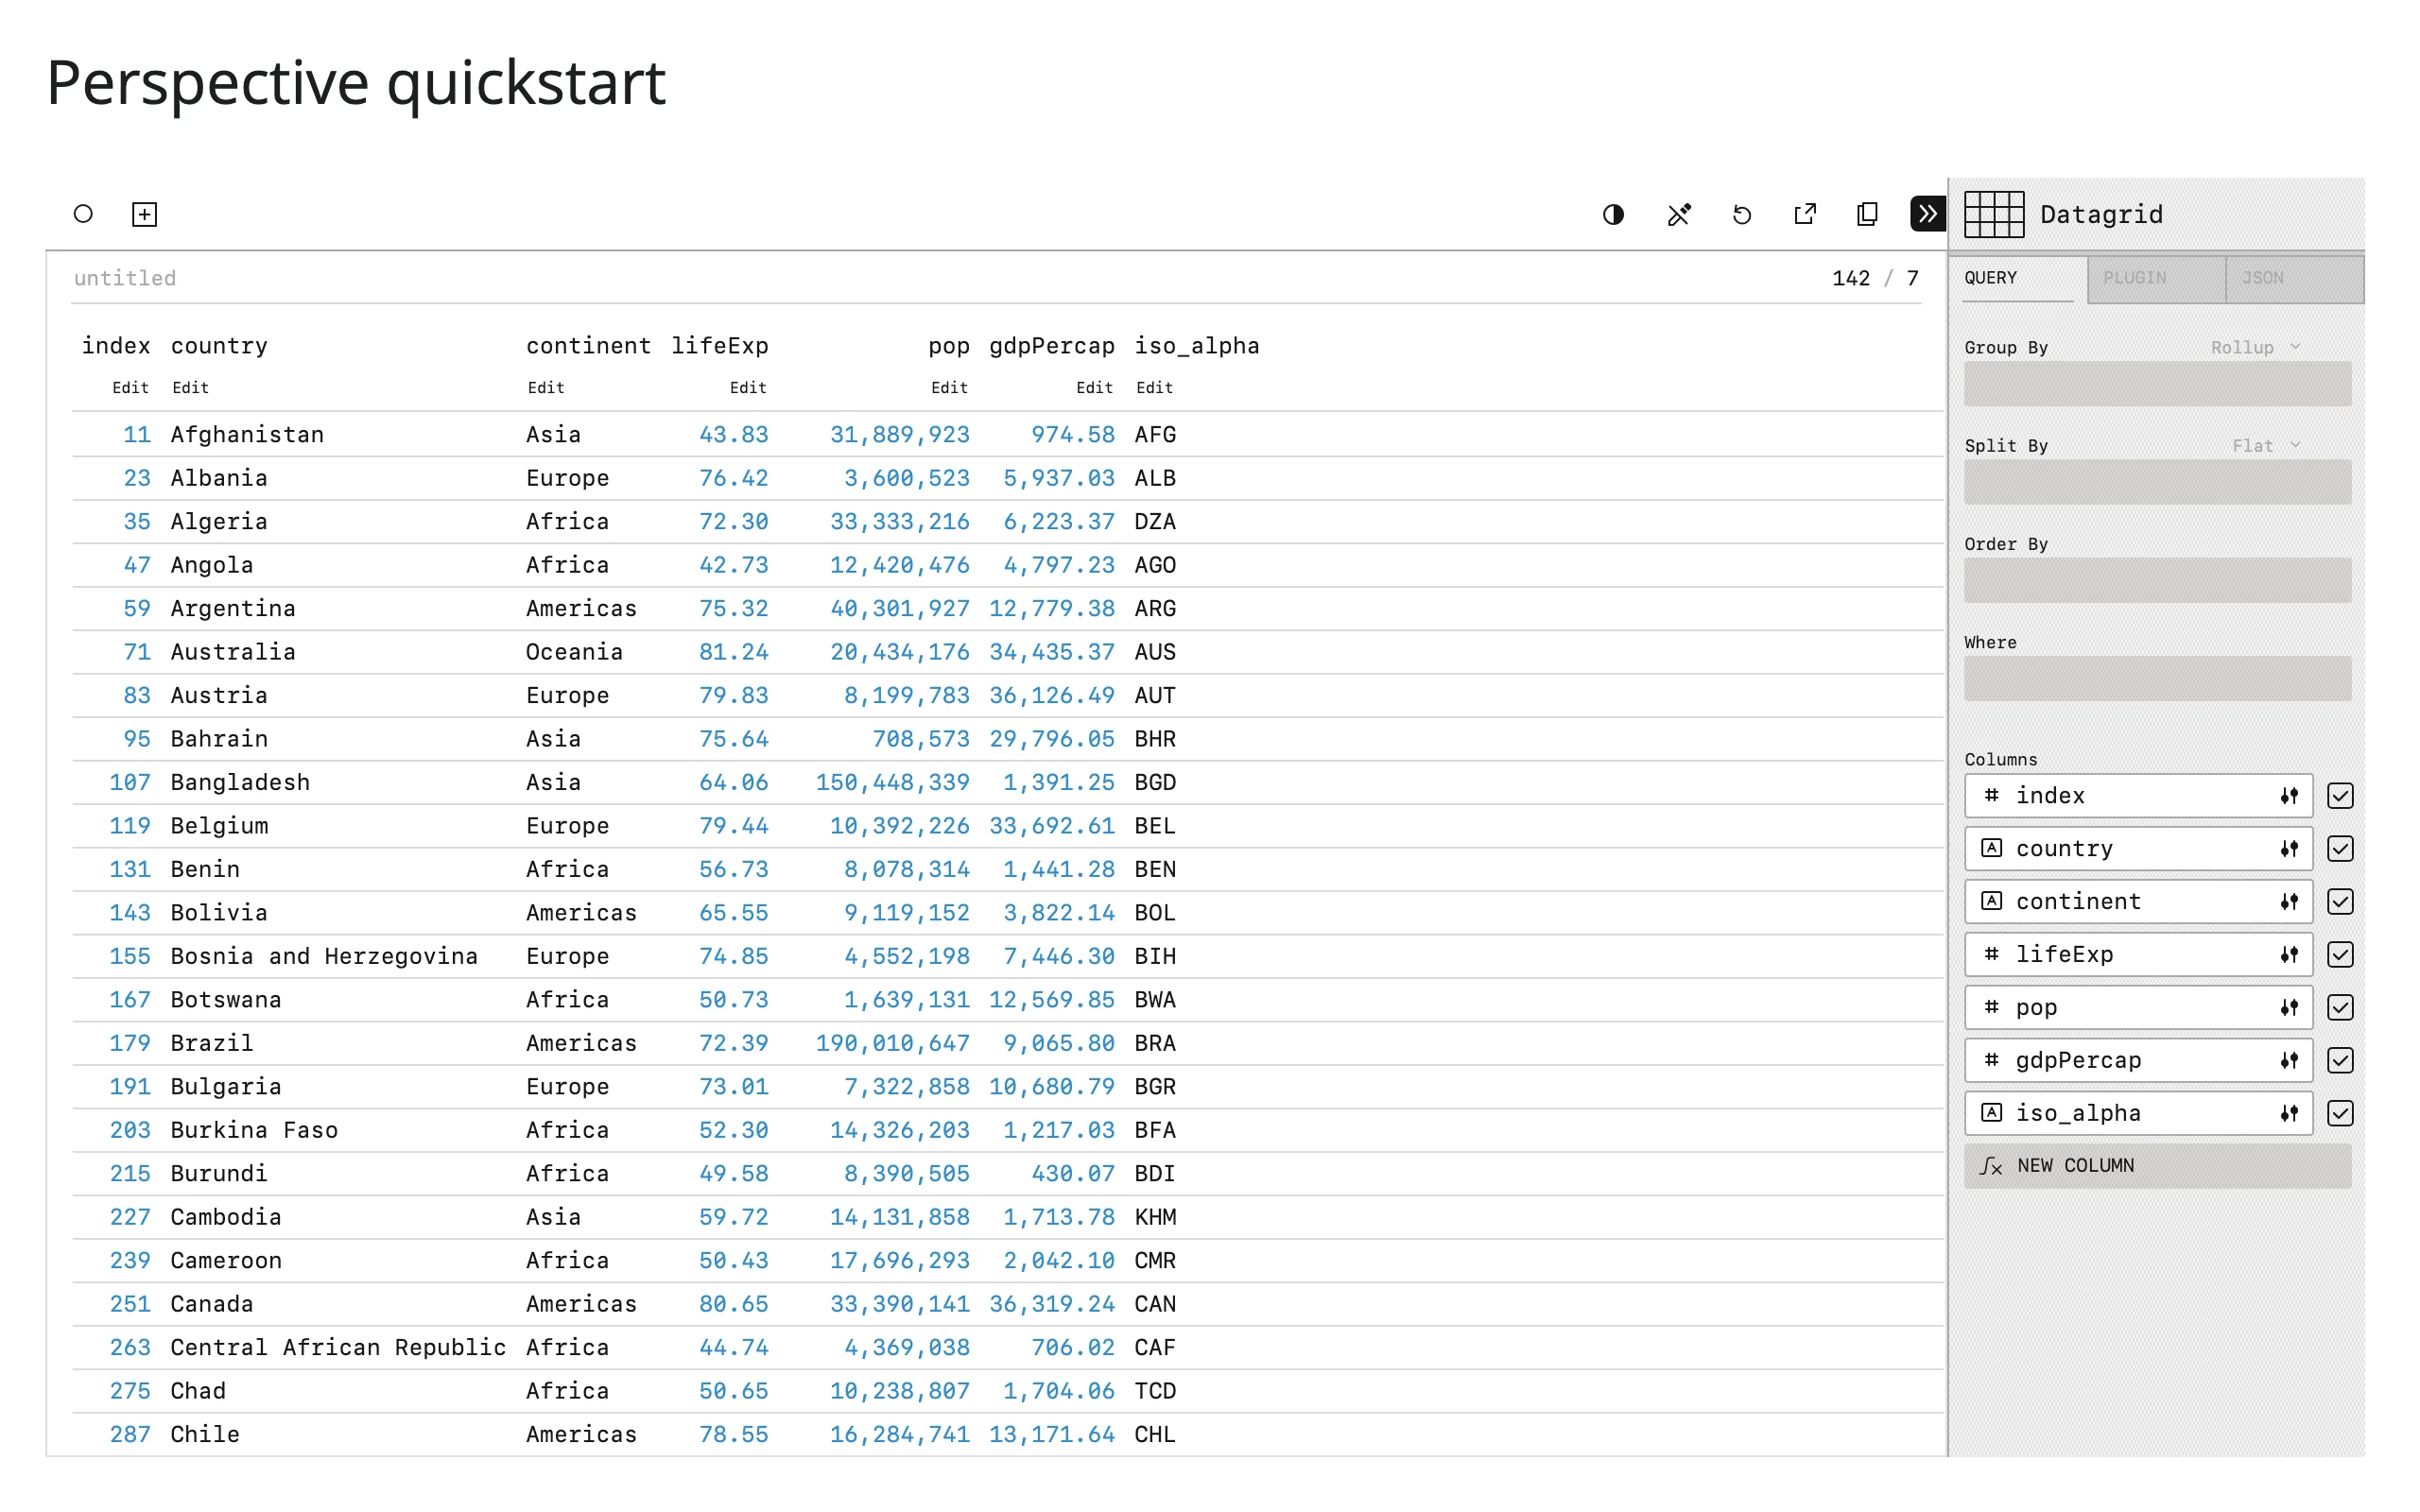
What you can build
Pivoting with group_by, split_by, and aggregates
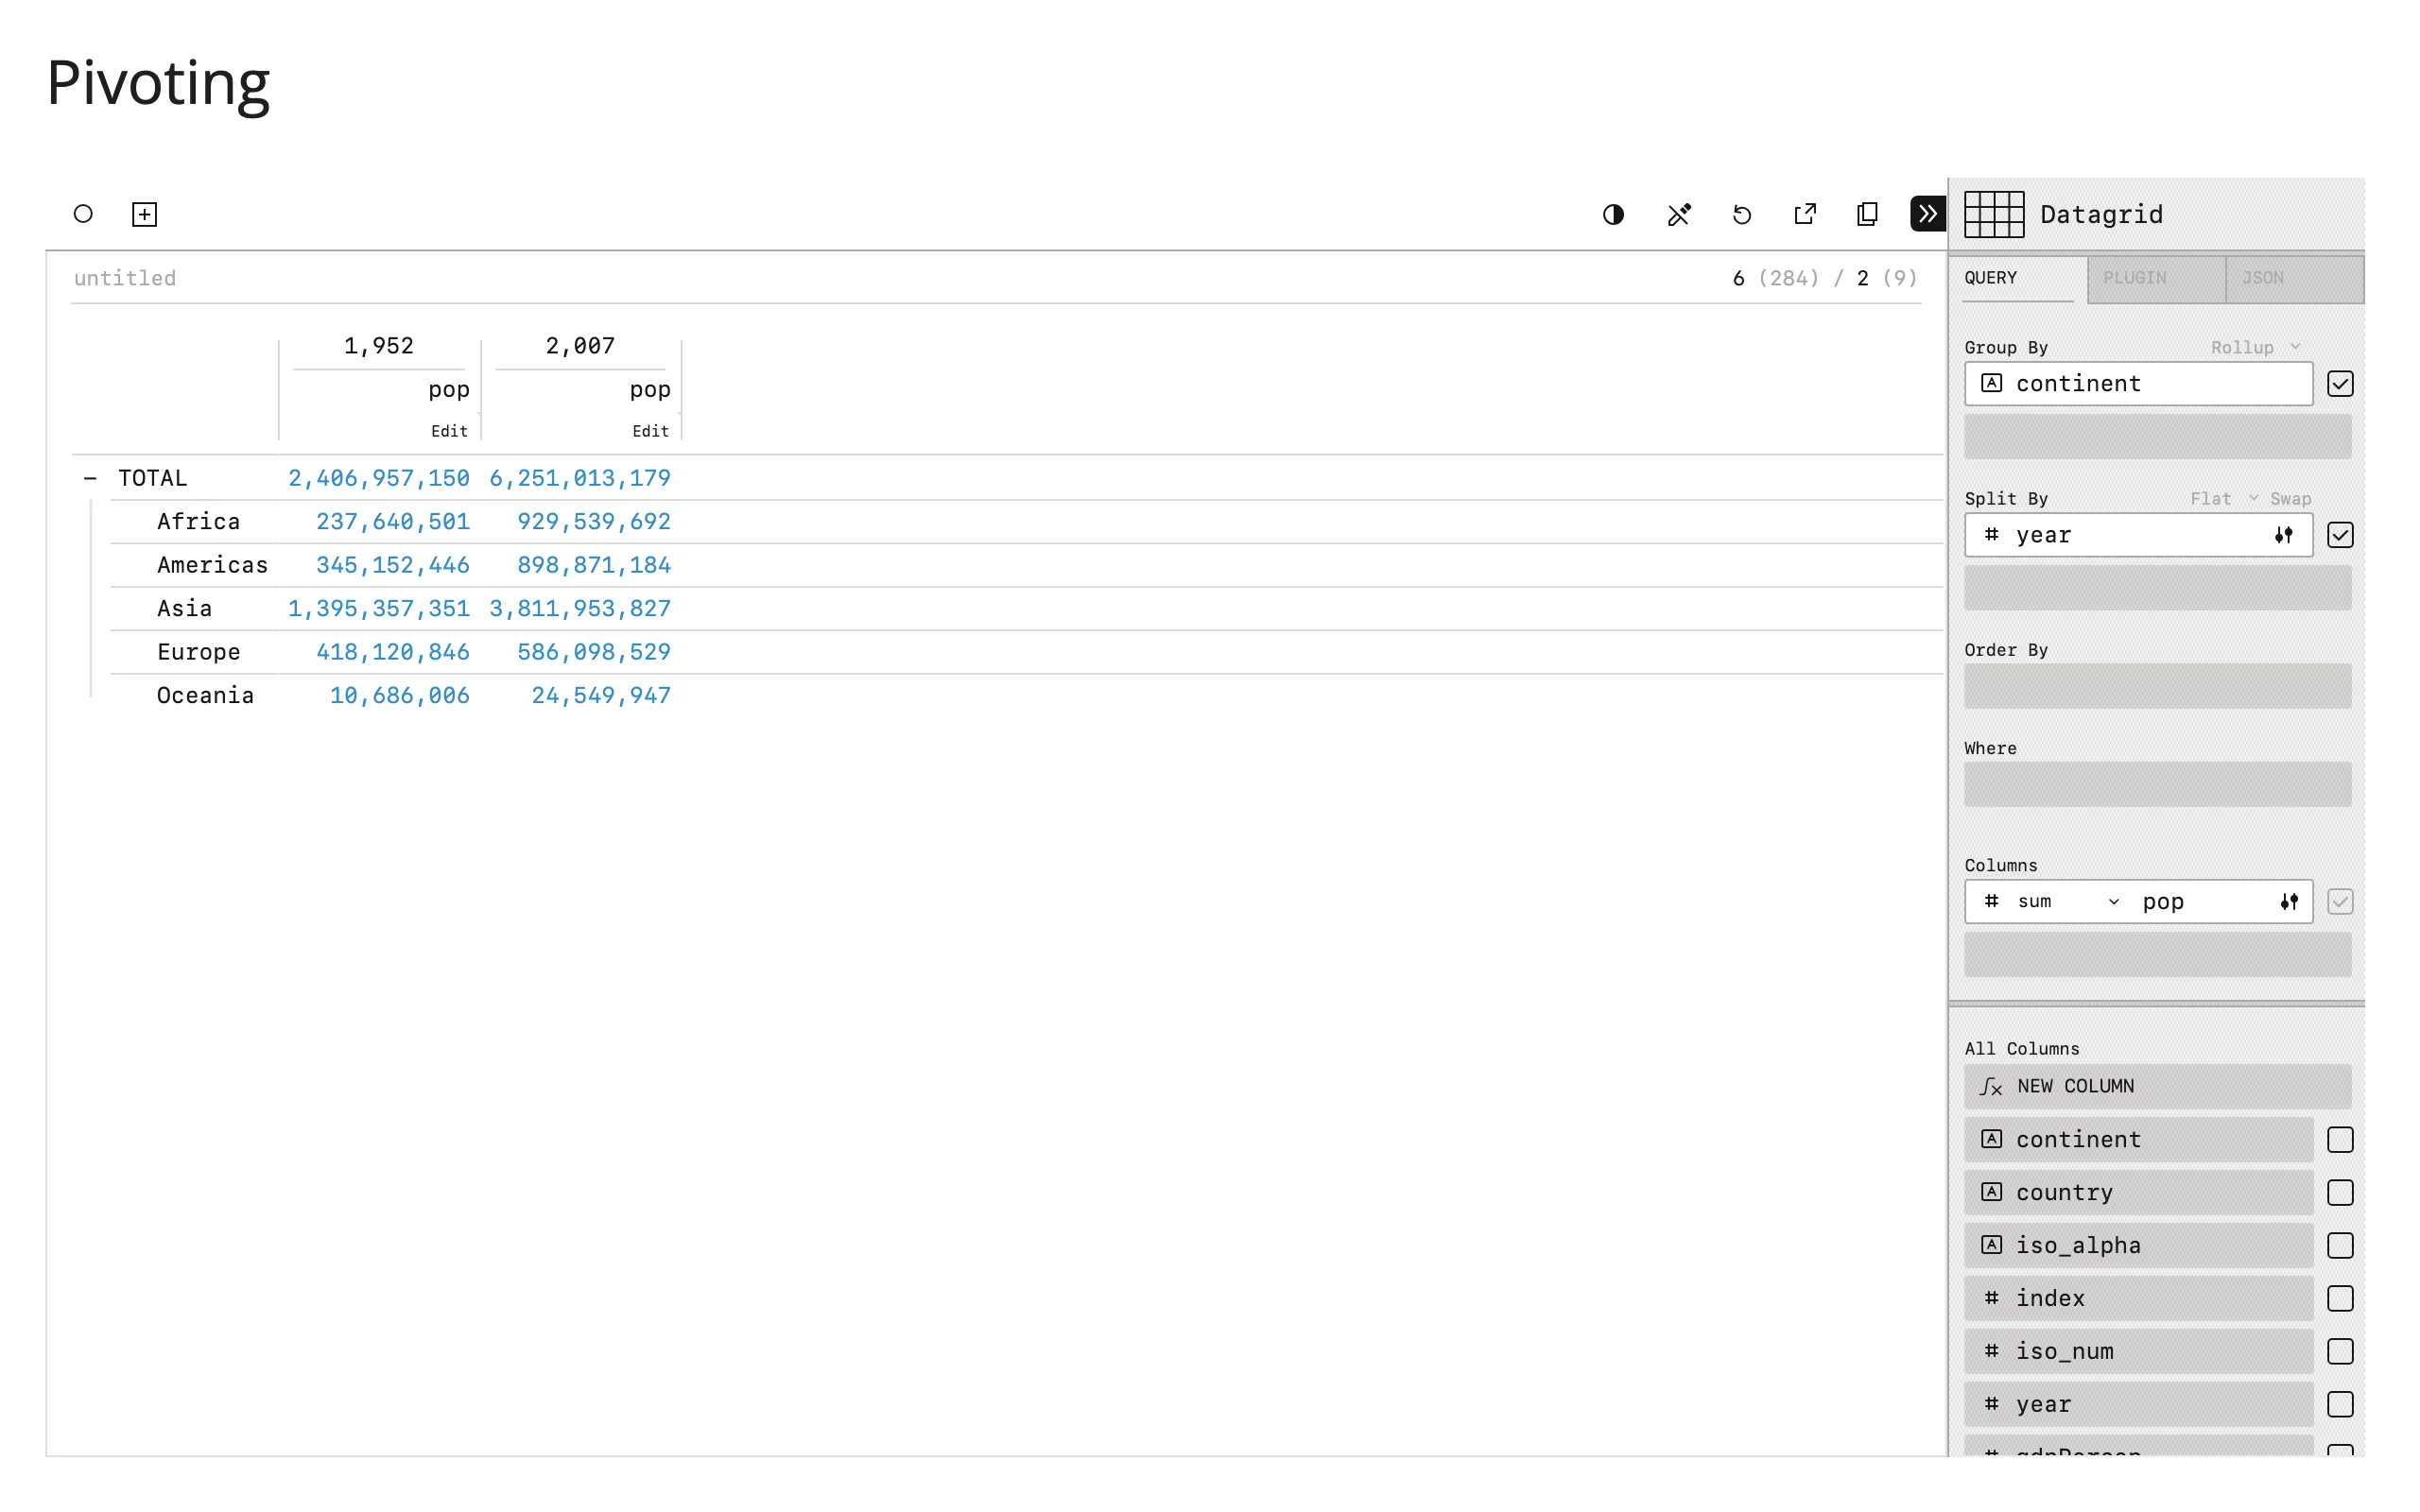
Group rows into a hierarchy (group_by), split columns into side-by-side series (split_by), and choose how numeric columns roll up (aggregates). A bare DataFrame return has nowhere to put this config, so build the table yourself and pass it to PerspectiveWidget. Two gapminder snapshots 55 years apart, pivoted by continent and split by year, turn into a world-population-growth table for free:
from __future__ import annotations

import plotly.express as px
from perspective import Server
from perspective.widget import PerspectiveWidget
from shiny.express import ui
from shinywidgets import render_perspective

ui.page_opts(title="Pivoting", fillable=True)

# Two snapshots 55 years apart, so a continent x year pivot tells a story
countries = px.data.gapminder().query("year in [1952, 2007]")


@render_perspective
def grid():
    # A bare DataFrame return gets a private per-session table for you, but
    # there's nowhere to pass pivot config -- build the table yourself so it
    # can go to the PerspectiveWidget constructor.
    table = Server().new_local_client().table(countries)
    return PerspectiveWidget(
        table,
        columns=["pop"],
        group_by=["continent"],
        split_by=["year"],
        aggregates={"pop": "sum"},
    )
A dozen plugins, one API
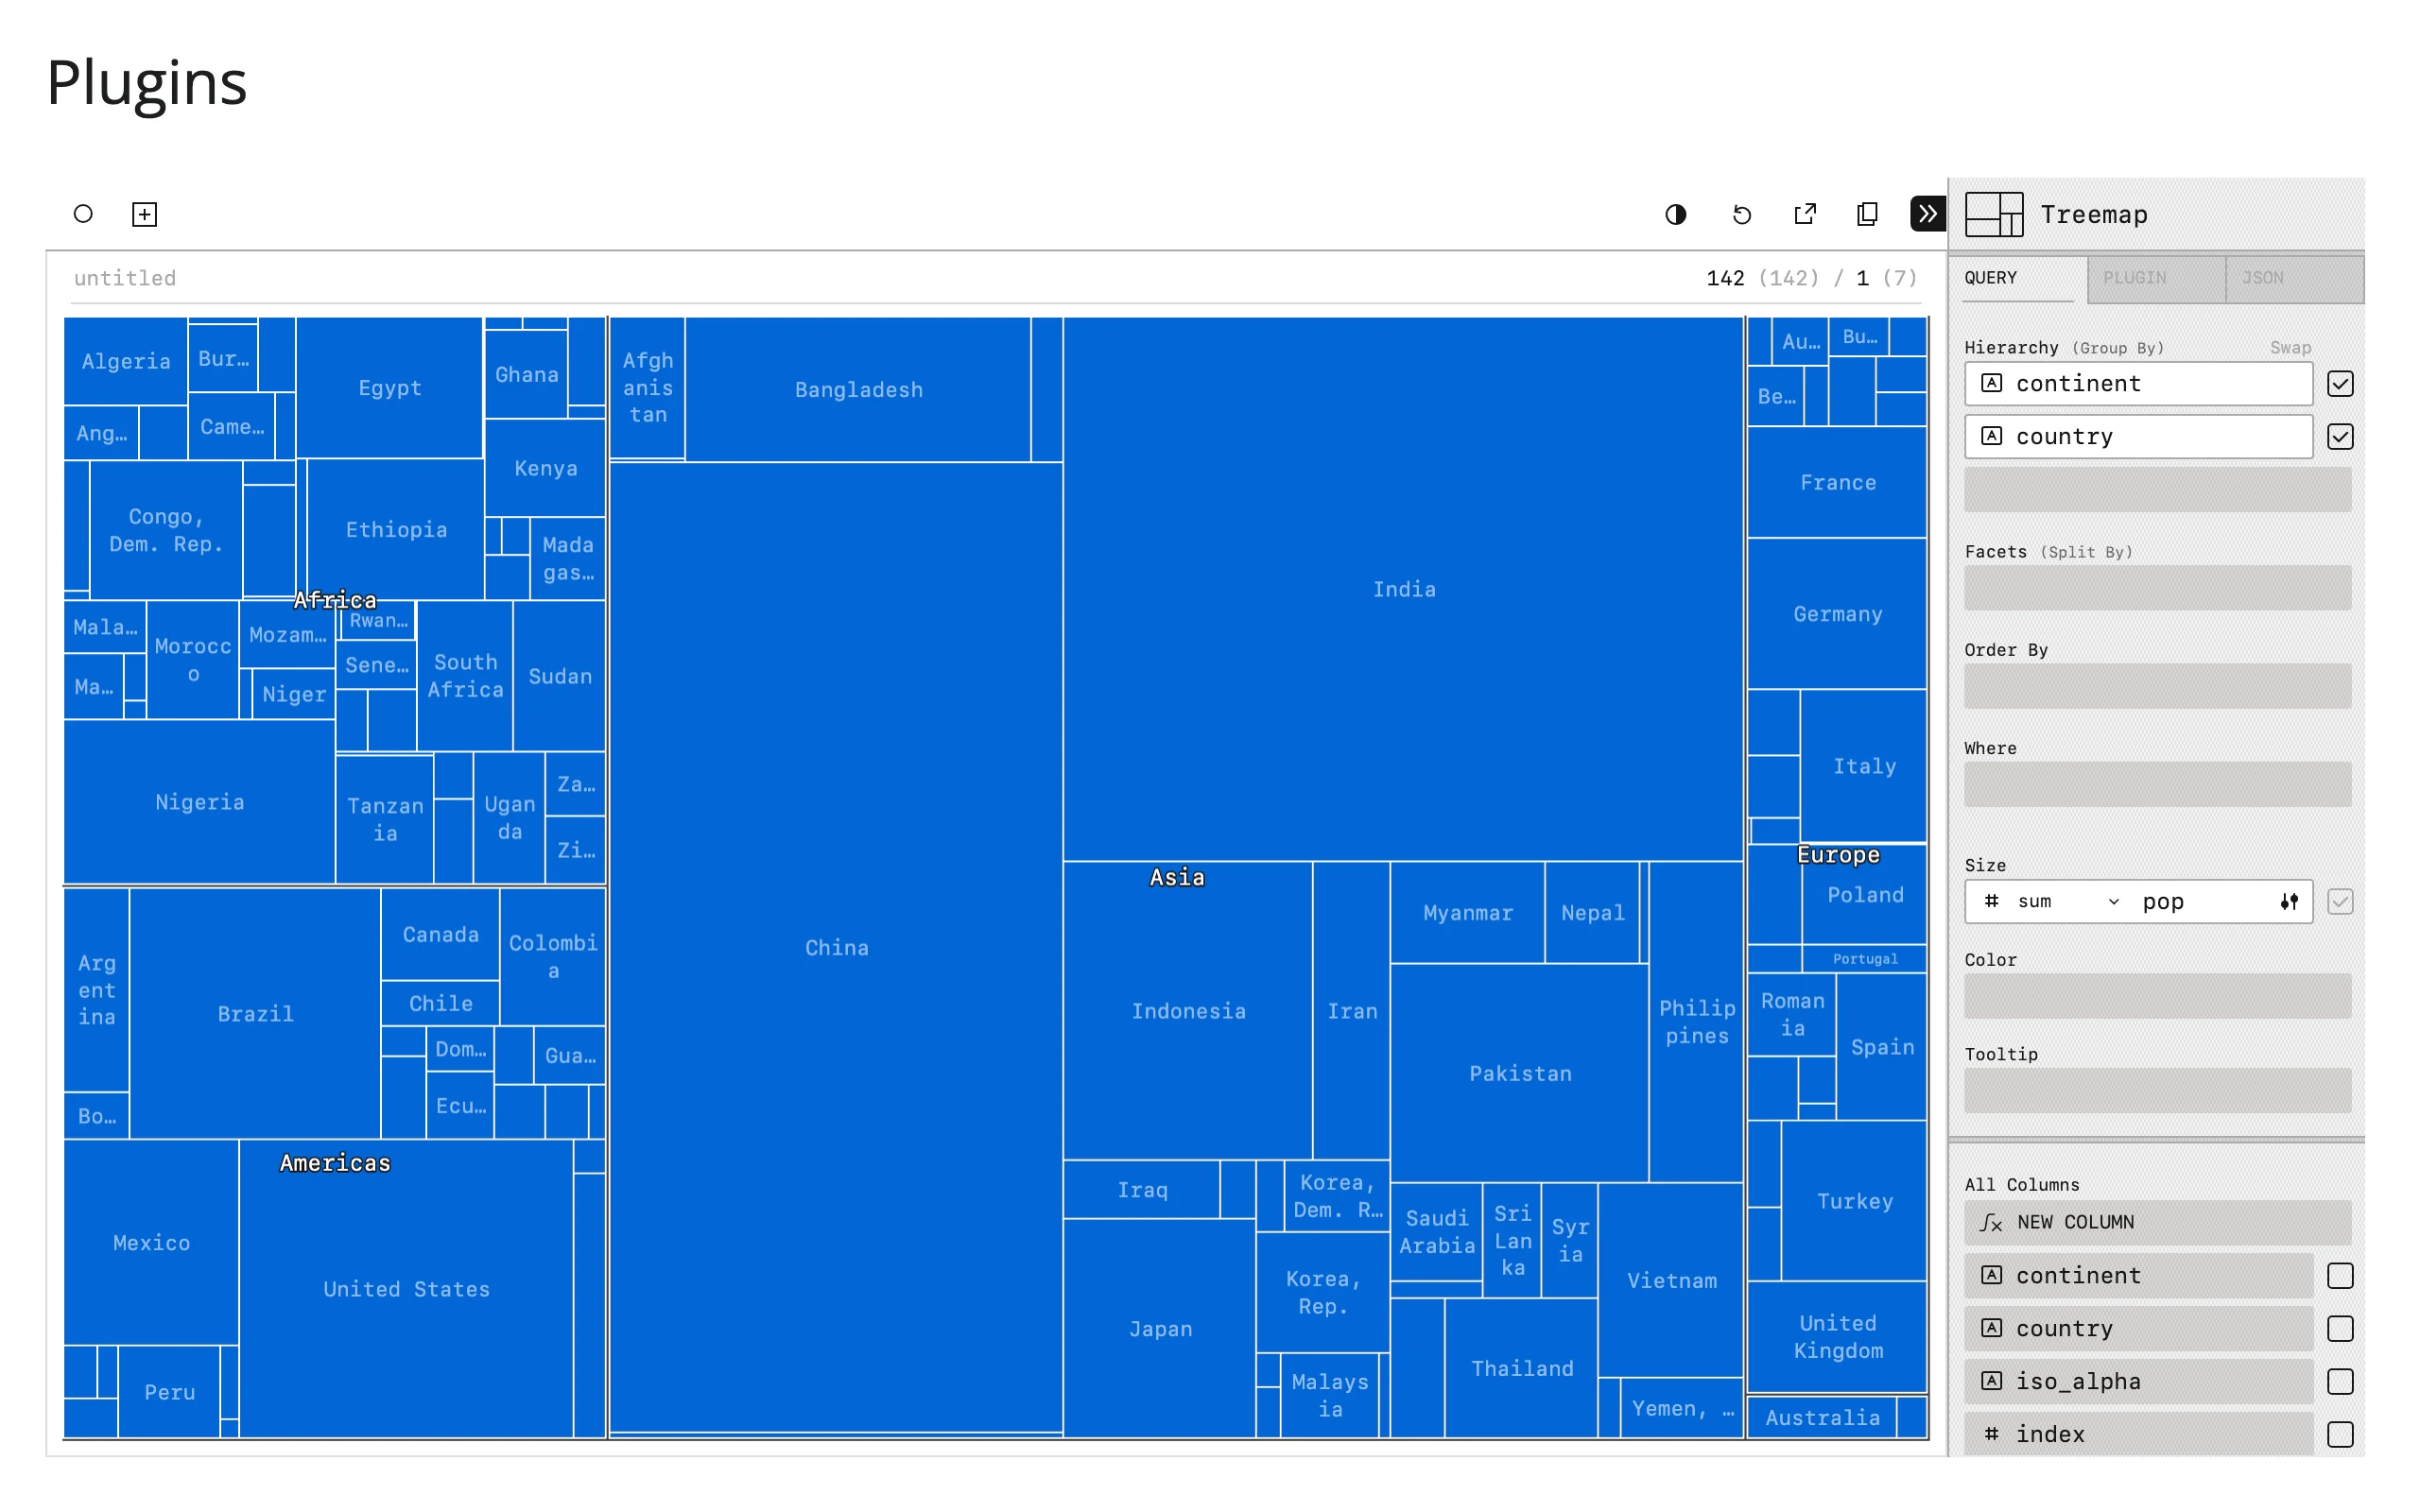
plugin= switches the whole visualization: "Datagrid" (default), "X Bar"/"Y Bar", "X/Y Line", "X/Y Scatter", "Treemap", "Sunburst", "Heatmap", "Candlestick", "OHLC". Every plugin reads the same group_by/split_by/aggregates/columns config, so switching charts is a one-line change – the textbook “world population treemap” is one plugin="Treemap" away from the pivot above.
from __future__ import annotations

import plotly.express as px
from perspective import Server
from perspective.widget import PerspectiveWidget
from shiny.express import ui
from shinywidgets import render_perspective

ui.page_opts(title="Plugins", fillable=True)

countries = px.data.gapminder().query("year == 2007").drop(columns=["year", "iso_num"])


@render_perspective
def grid():
    # Same data, same aggregation -- just a different plugin. Perspective
    # also ships X/Y Bar, X/Y Line, X/Y Scatter, Sunburst, Heatmap,
    # Candlestick, and OHLC; switch `plugin` to try any of them.
    table = Server().new_local_client().table(countries)
    return PerspectiveWidget(
        table,
        plugin="Treemap",
        # Without "columns", the Treemap sizes rectangles by the first
        # numeric column -- the auto-added pandas "index" -- instead of pop
        columns=["pop"],
        group_by=["continent", "country"],
        aggregates={"pop": "sum"},
    )
Computed columns with expressions
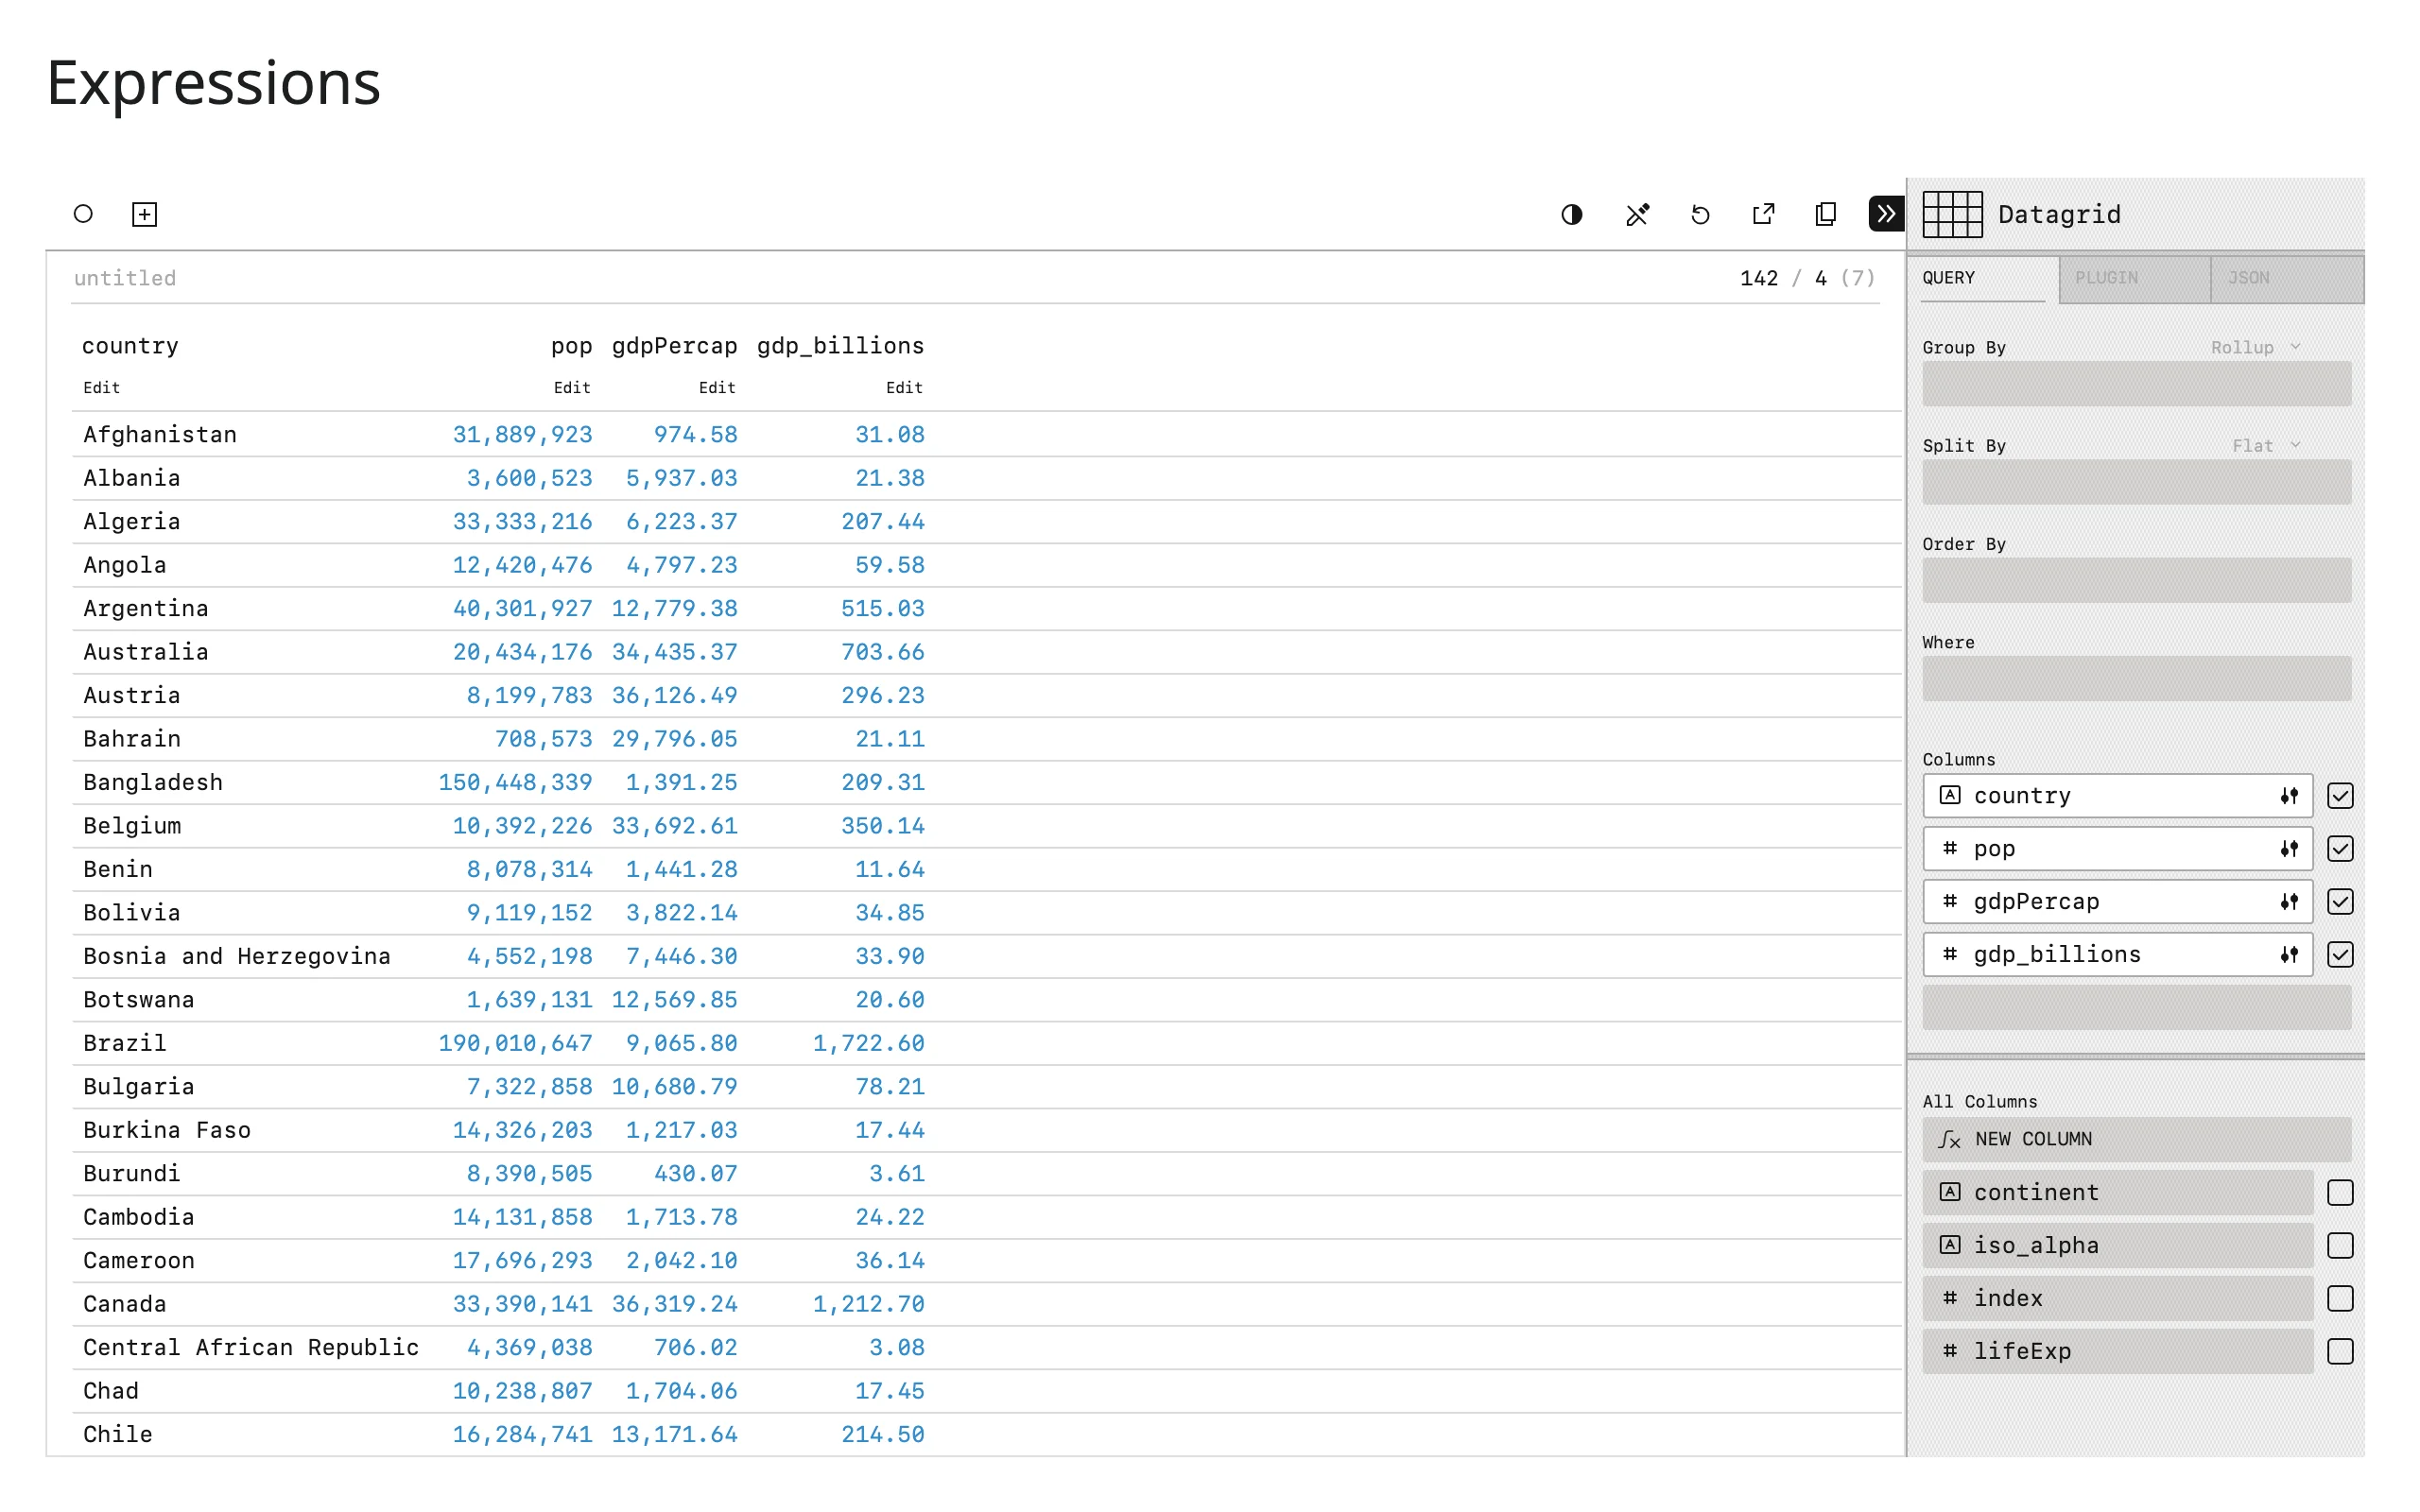
expressions adds columns computed in Perspective’s own expression language (ExprTK-based; column names are double-quoted). They stay live across pivots, filters, and streamed updates, since they’re evaluated by the table’s query engine, not in Python.
from __future__ import annotations

import plotly.express as px
from perspective import Server
from perspective.widget import PerspectiveWidget
from shiny.express import ui
from shinywidgets import render_perspective

ui.page_opts(title="Expressions", fillable=True)

countries = px.data.gapminder().query("year == 2007").drop(columns=["year", "iso_num"])


@render_perspective
def grid():
    # Expressions add a computed column, written in Perspective's own
    # expression language (column names are double-quoted). It's evaluated
    # in the table's engine, so it stays live across pivots and updates.
    table = Server().new_local_client().table(countries)
    return PerspectiveWidget(
        table,
        columns=["country", "pop", "gdpPercap", "gdp_billions"],
        expressions={"gdp_billions": '("gdpPercap" * "pop") / 1000000000'},
    )
Streaming updates with table.update()
table.update() pushes new rows to every viewer attached to that table over the comm – no re-render, no lost pivot/sort/filter state. Pair it with limit= to cap the table at a rolling window so a long-running stream doesn’t grow without bound. (There’s no live public market-data feed to pull from without an API key, so this one synthesizes notional for a few real stock tickers – the kind of thing that’s genuinely a stream in production.)
from __future__ import annotations

import random

import pandas as pd
from perspective import Server
from perspective.widget import PerspectiveWidget
from shiny import reactive
from shiny.express import ui
from shinywidgets import render_perspective

ui.page_opts(title="Streaming", fillable=True)

SYMBOLS = ["AAPL", "MSFT", "GOOG"]


def make_rows(n: int, start: int) -> list[dict]:
    return [
        {
            "id": start + i,
            "symbol": random.choice(SYMBOLS),
            "notional": round(random.uniform(1_000, 50_000), 2),
        }
        for i in range(n)
    ]


@render_perspective
def grid():
    # `limit` keeps only the most recent 500 rows, so the table is a rolling
    # window no matter how long the stream runs.
    table = Server().new_local_client().table(pd.DataFrame(make_rows(20, 0)), limit=500)
    return PerspectiveWidget(
        table,
        plugin="Y Bar",
        columns=["notional"],  # otherwise the auto "index"/"id" columns plot too
        group_by=["symbol"],
        aggregates={"notional": "avg"},
    )


next_id = reactive.value(20)


@reactive.effect
def _stream():
    reactive.invalidate_later(0.5)
    with reactive.isolate():
        start = next_id.get()
    next_id.set(start + 5)
    # update() streams straight into every viewer attached to this table over
    # its comm -- no re-render, so any pivot/sort/filter the user set stays.
    grid.widget.update(make_rows(5, start))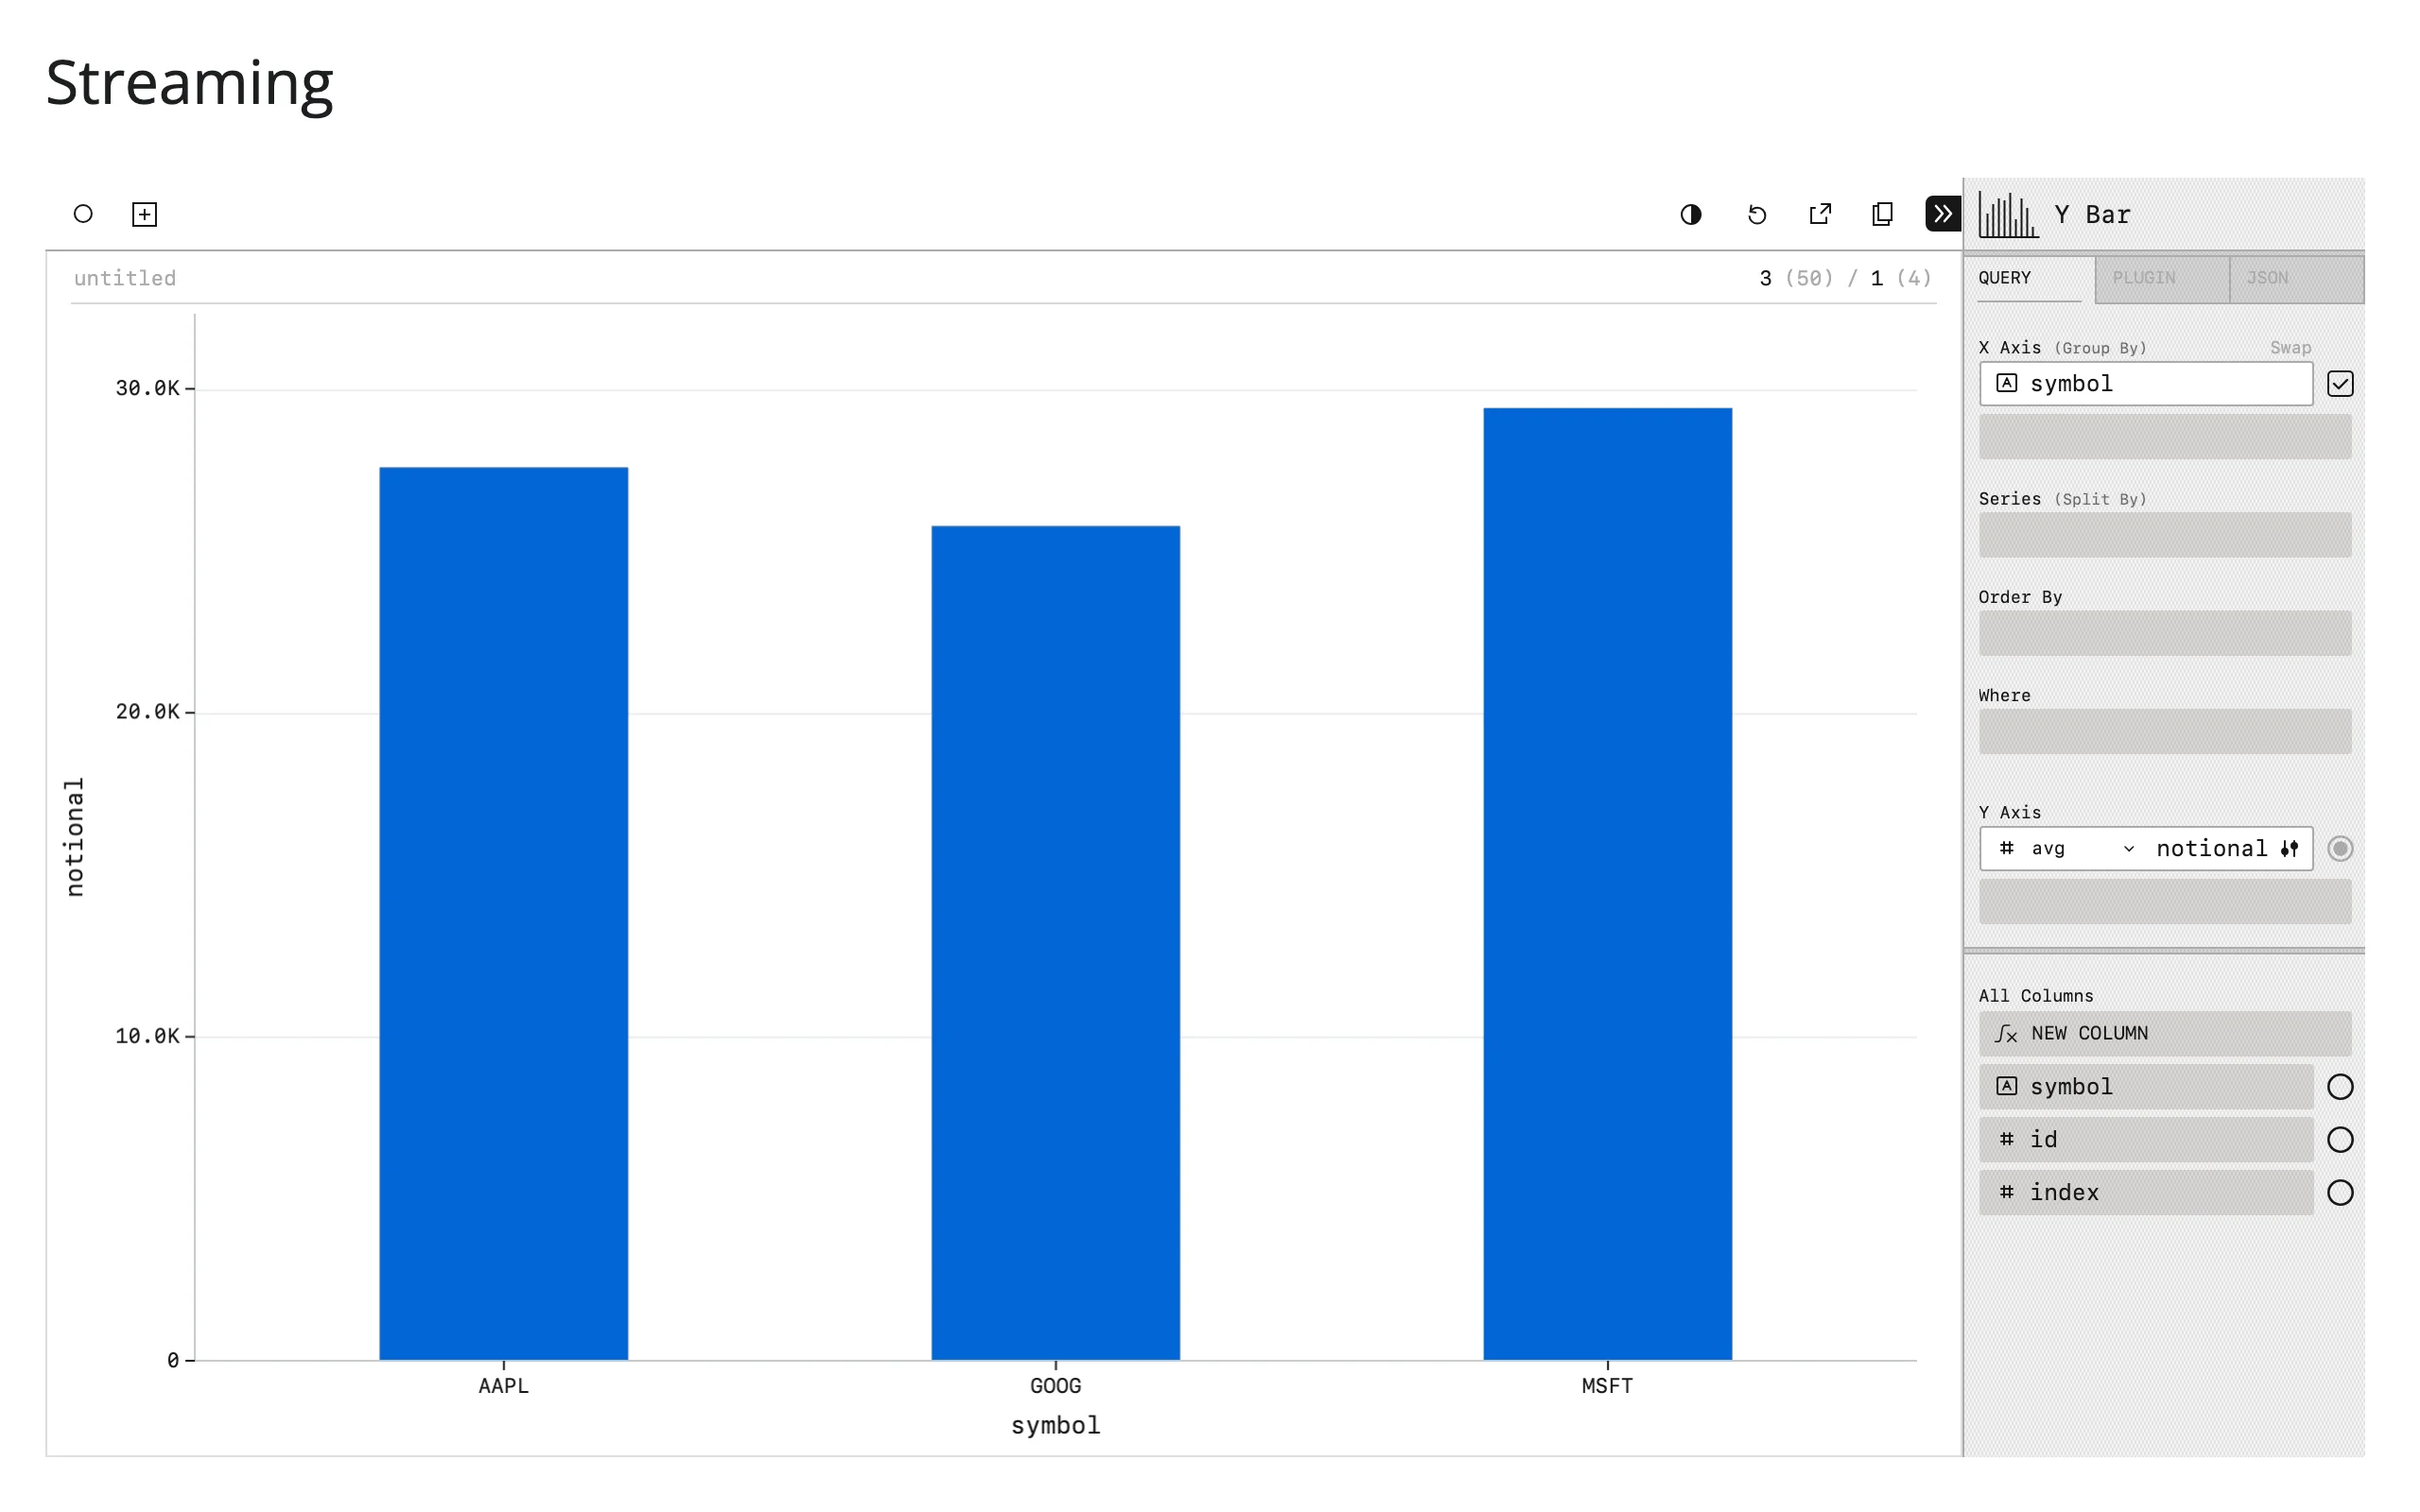
Reacting to user interaction
Accessor reference
| accessor | returns | before any interaction | across re-render | default rate policy |
|---|---|---|---|---|
filter() |
List[list], e.g. [["continent", "==", "Africa"]] |
seeded [] (never None) |
re-seeded from the new viewer (starts [] unless the new widget is constructed with a filter) |
none |
view_config() |
Dict[str, Any] with keys plugin, columns, group_by, split_by, aggregates, sort, filter, expressions |
seeded at render (always a dict) | re-seeded from the new viewer’s config | none |
Both are kind="state": they hold the viewer’s current configuration rather than reporting a one-off event, so reading them never needs req() – there’s always a value, even before the user has touched anything. Both describe the viewer’s own current configuration (not a record of a past edit), so a re-render re-seeds each one from the new viewer rather than carrying over the old viewer’s values. Neither declares a default rate limit, because settings-panel edits are discrete clicks and drags, not continuous streams like a map pan.
filter()
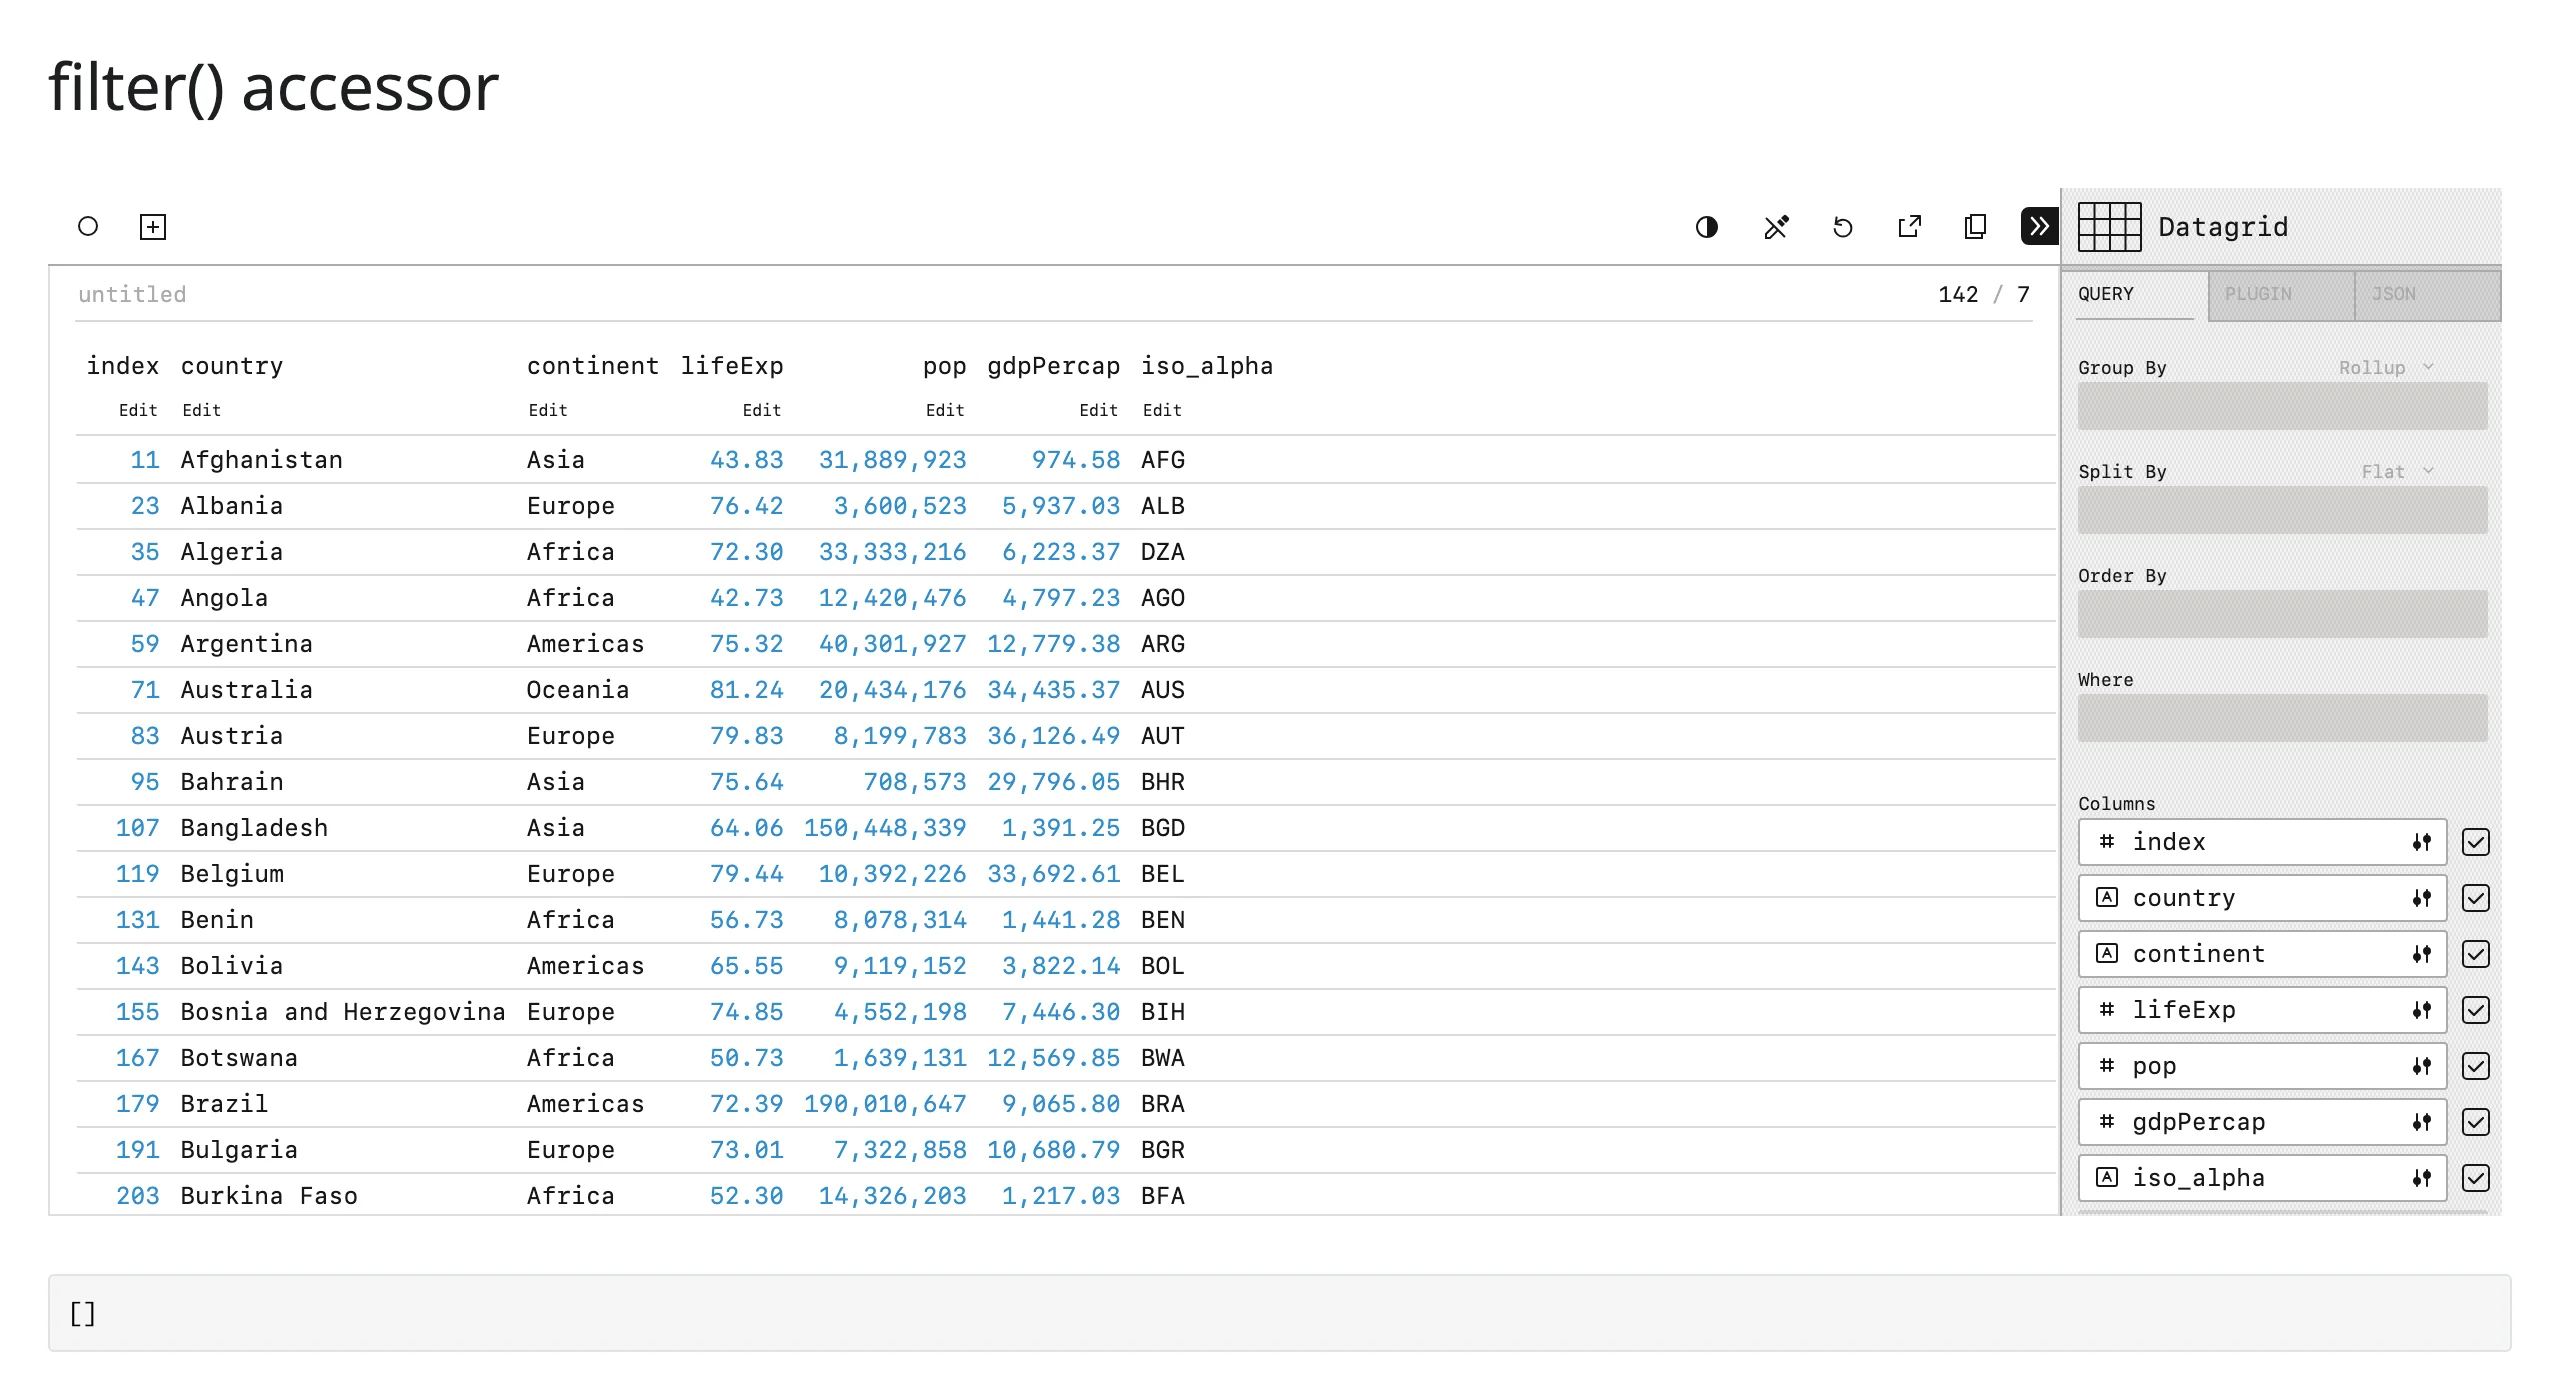
filter() mirrors the viewer’s Where clause as a plain list, exactly as PerspectiveWidget.save()["filter"] would report it. Build the same filter server-side with table.view(filter=grid.filter()).
from __future__ import annotations

import plotly.express as px
from shiny.express import render, ui
from shinywidgets import render_perspective

ui.page_opts(title="filter() accessor", fillable=True)

countries = px.data.gapminder().query("year == 2007").drop(columns=["year", "iso_num"])


@render_perspective
def grid():
    return countries


@render.code
def filter_state():
    # filter() seeds at [] and never goes None, so "no filter set" and
    # "nothing reported yet" are the same value -- no req()/not-ready
    # handling needed.
    return str(grid.filter())
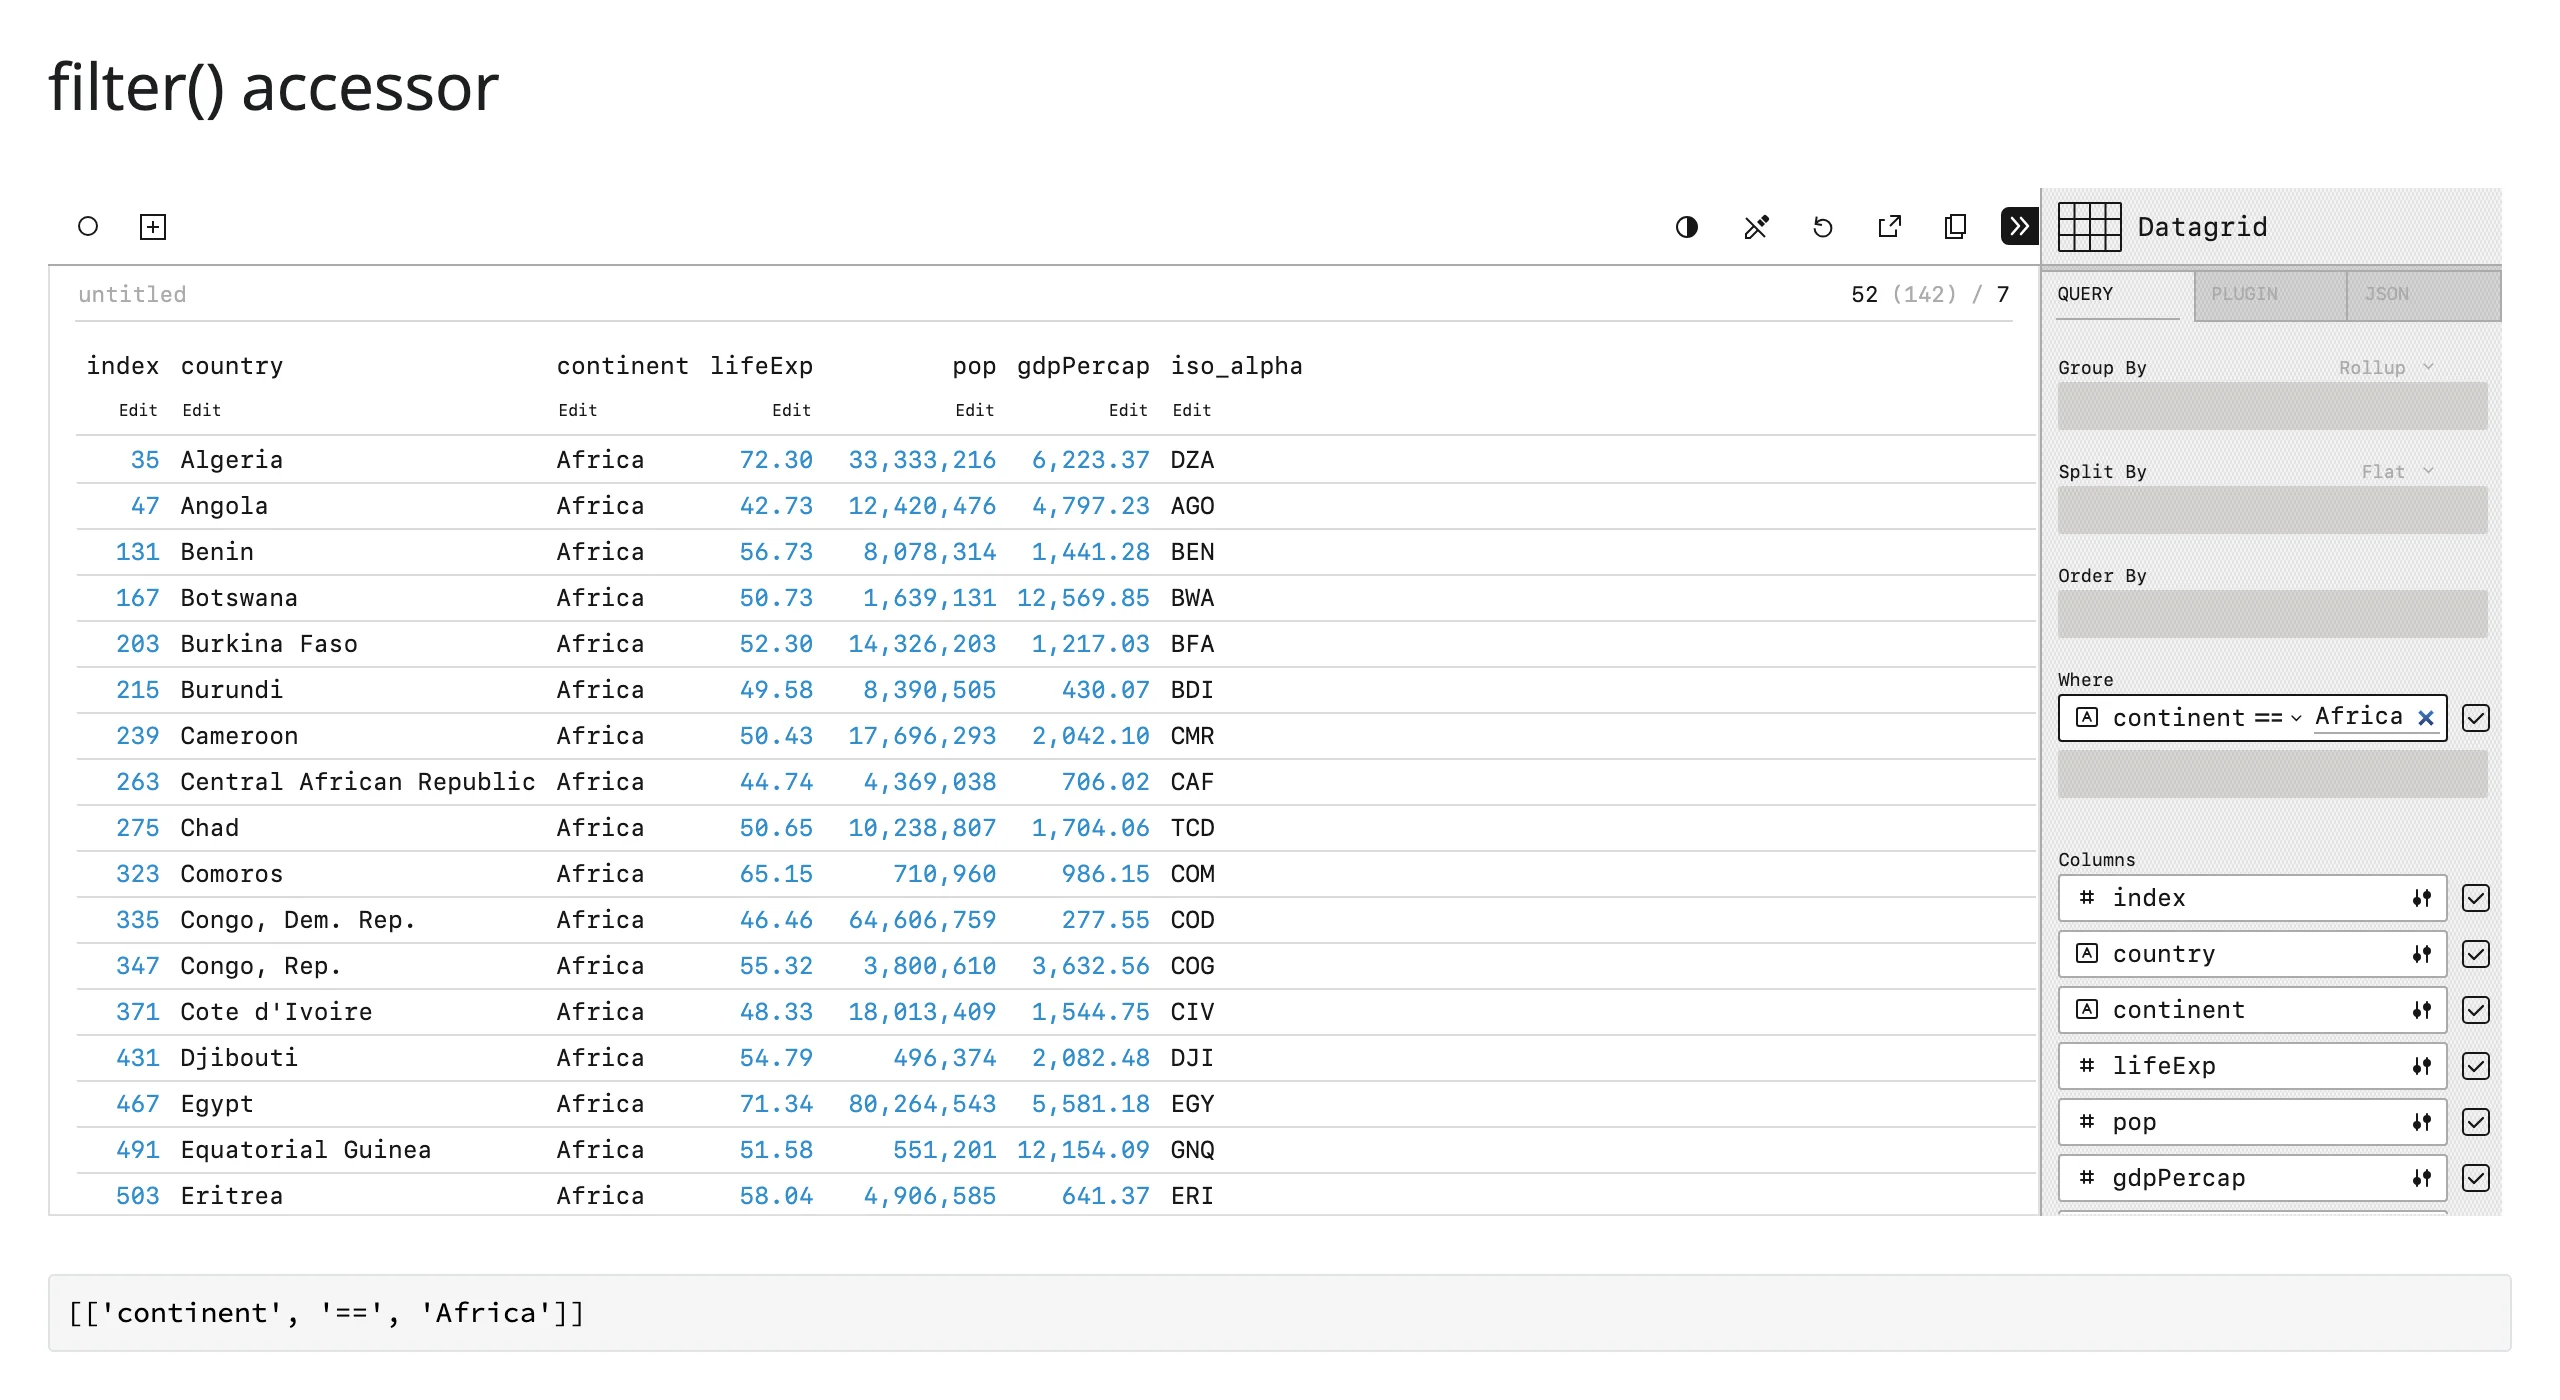
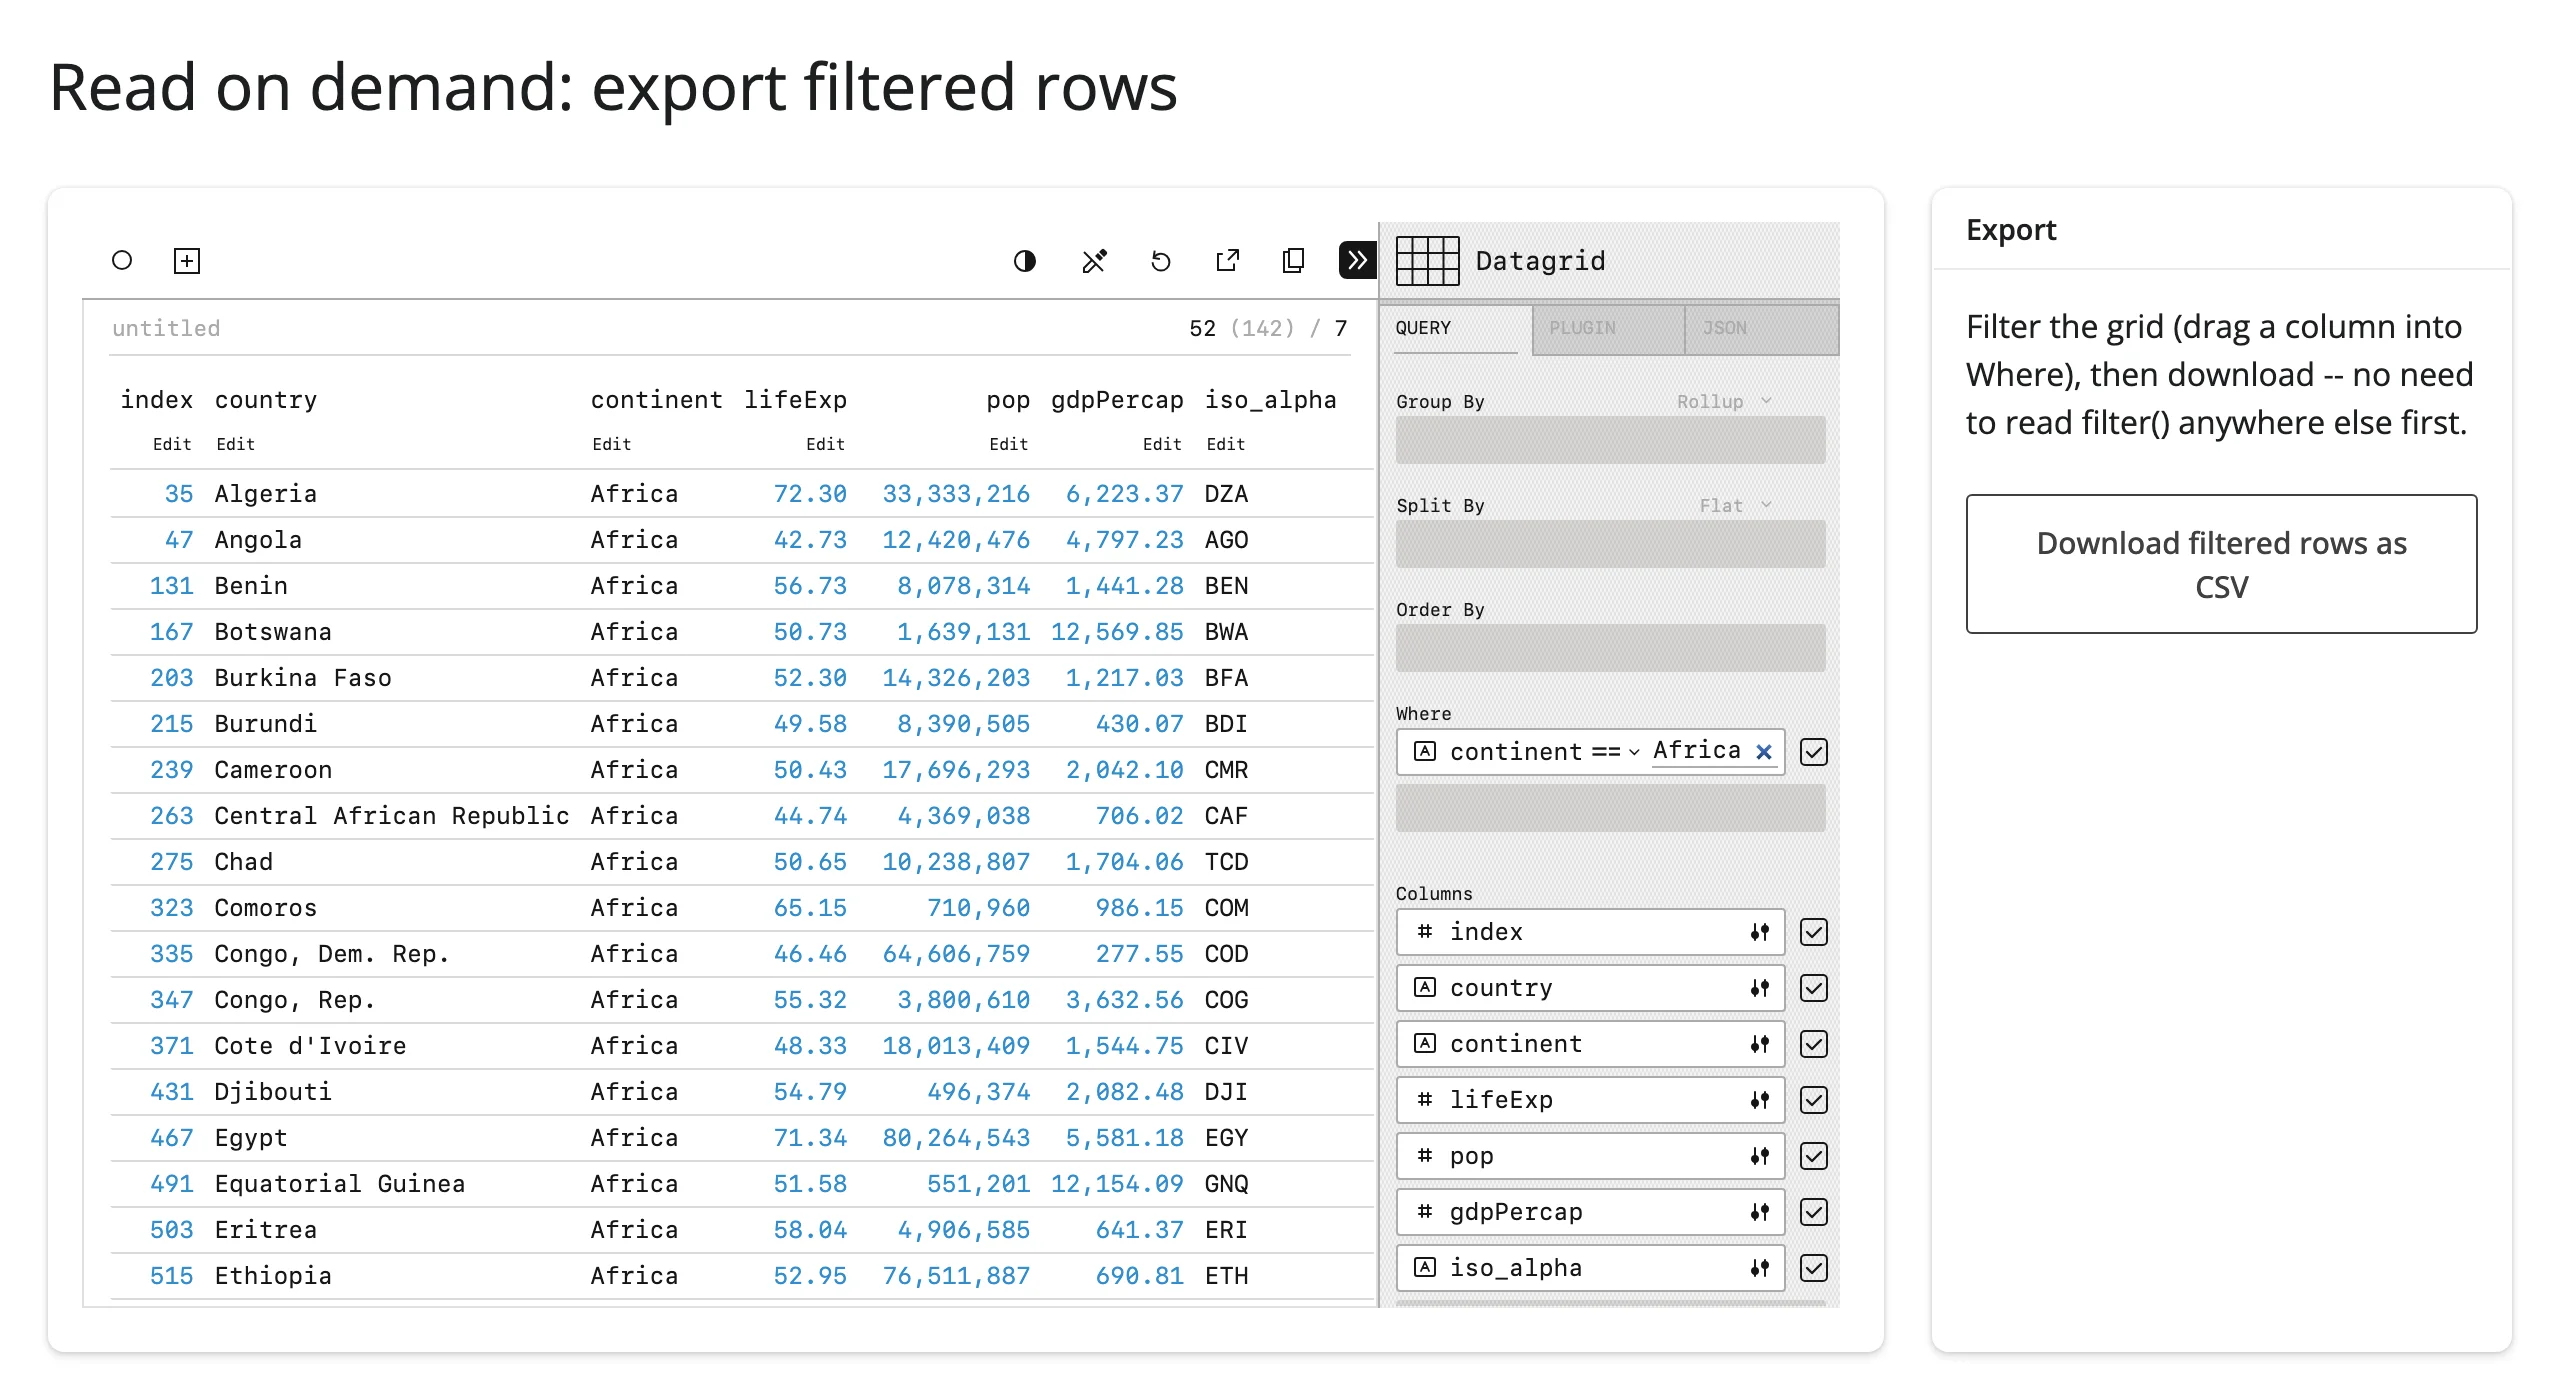
Dragging the continent column into the viewer’s Where field and picking a value updates filter():
Read on demand: export filtered rows
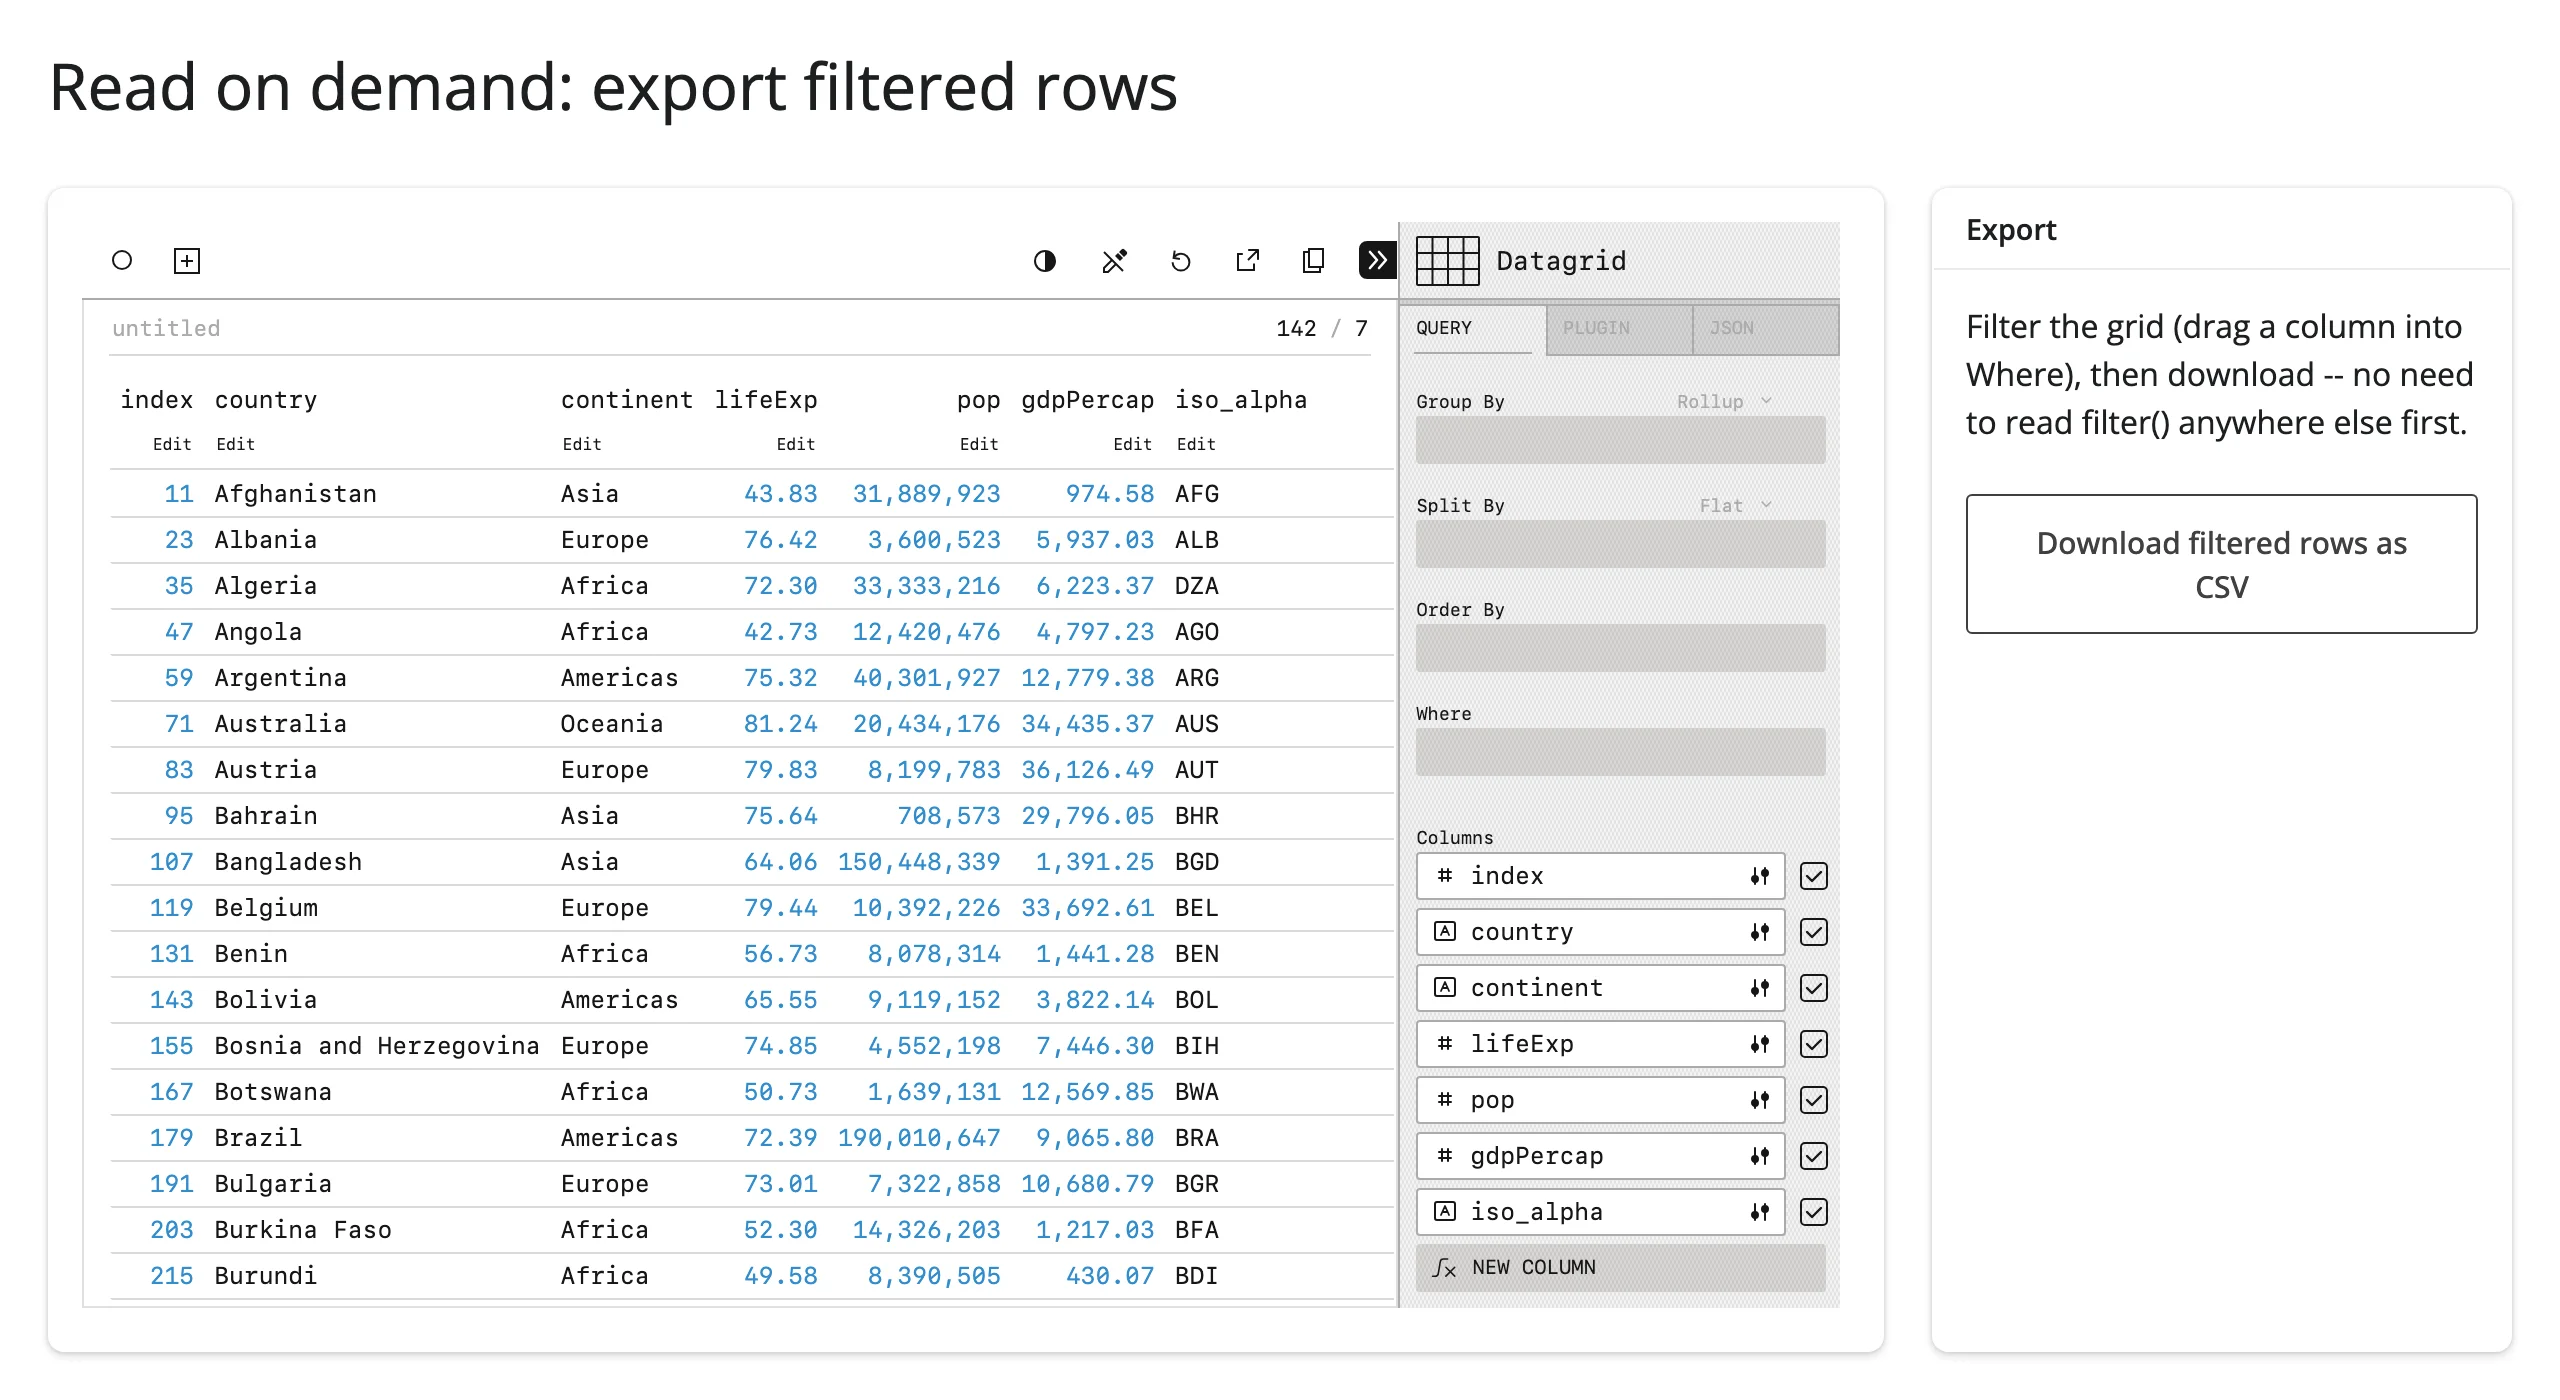
Because filter() is live from the moment the viewer renders, you can read it the instant you need the value – in a download handler, a button click, a chat tool call – with no reader warming it up first. examples/15_export_filtered.py:
from __future__ import annotations

import io

import pandas as pd
import plotly.express as px
from shiny.express import render, ui
from shinywidgets import render_perspective

ui.page_opts(title="Read on demand: export filtered rows", fillable=True)

countries = px.data.gapminder().query("year == 2007").drop(columns=["year", "iso_num"])

with ui.layout_columns(col_widths=[9, 3]):
    with ui.card(full_screen=True):

        @render_perspective
        def grid():
            return countries

    with ui.card():
        ui.card_header("Export")
        ui.p("Filter the grid (drag a column into Where), then download -- no need to read filter() anywhere else first.")

        # filter() is live from the moment the viewer renders, whether or not
        # anything has read it yet, so this handler can read it cold, the
        # instant the user clicks download: no warm-up reader required.
        @render.download_button(filename="filtered_countries.csv", label="Download filtered rows as CSV")
        def download_csv():
            view = grid.widget.table.view(filter=grid.filter())
            cols = view.to_columns()
            view.delete()
            df = pd.DataFrame(cols).drop(columns=["index"], errors="ignore")
            buf = io.StringIO()
            df.to_csv(buf, index=False)
            yield buf.getvalue()
Filtering to continent == "Africa" (142 rows down to 52), then downloading – the exported CSV contains exactly those 52 rows, read cold at click time:
view_config()
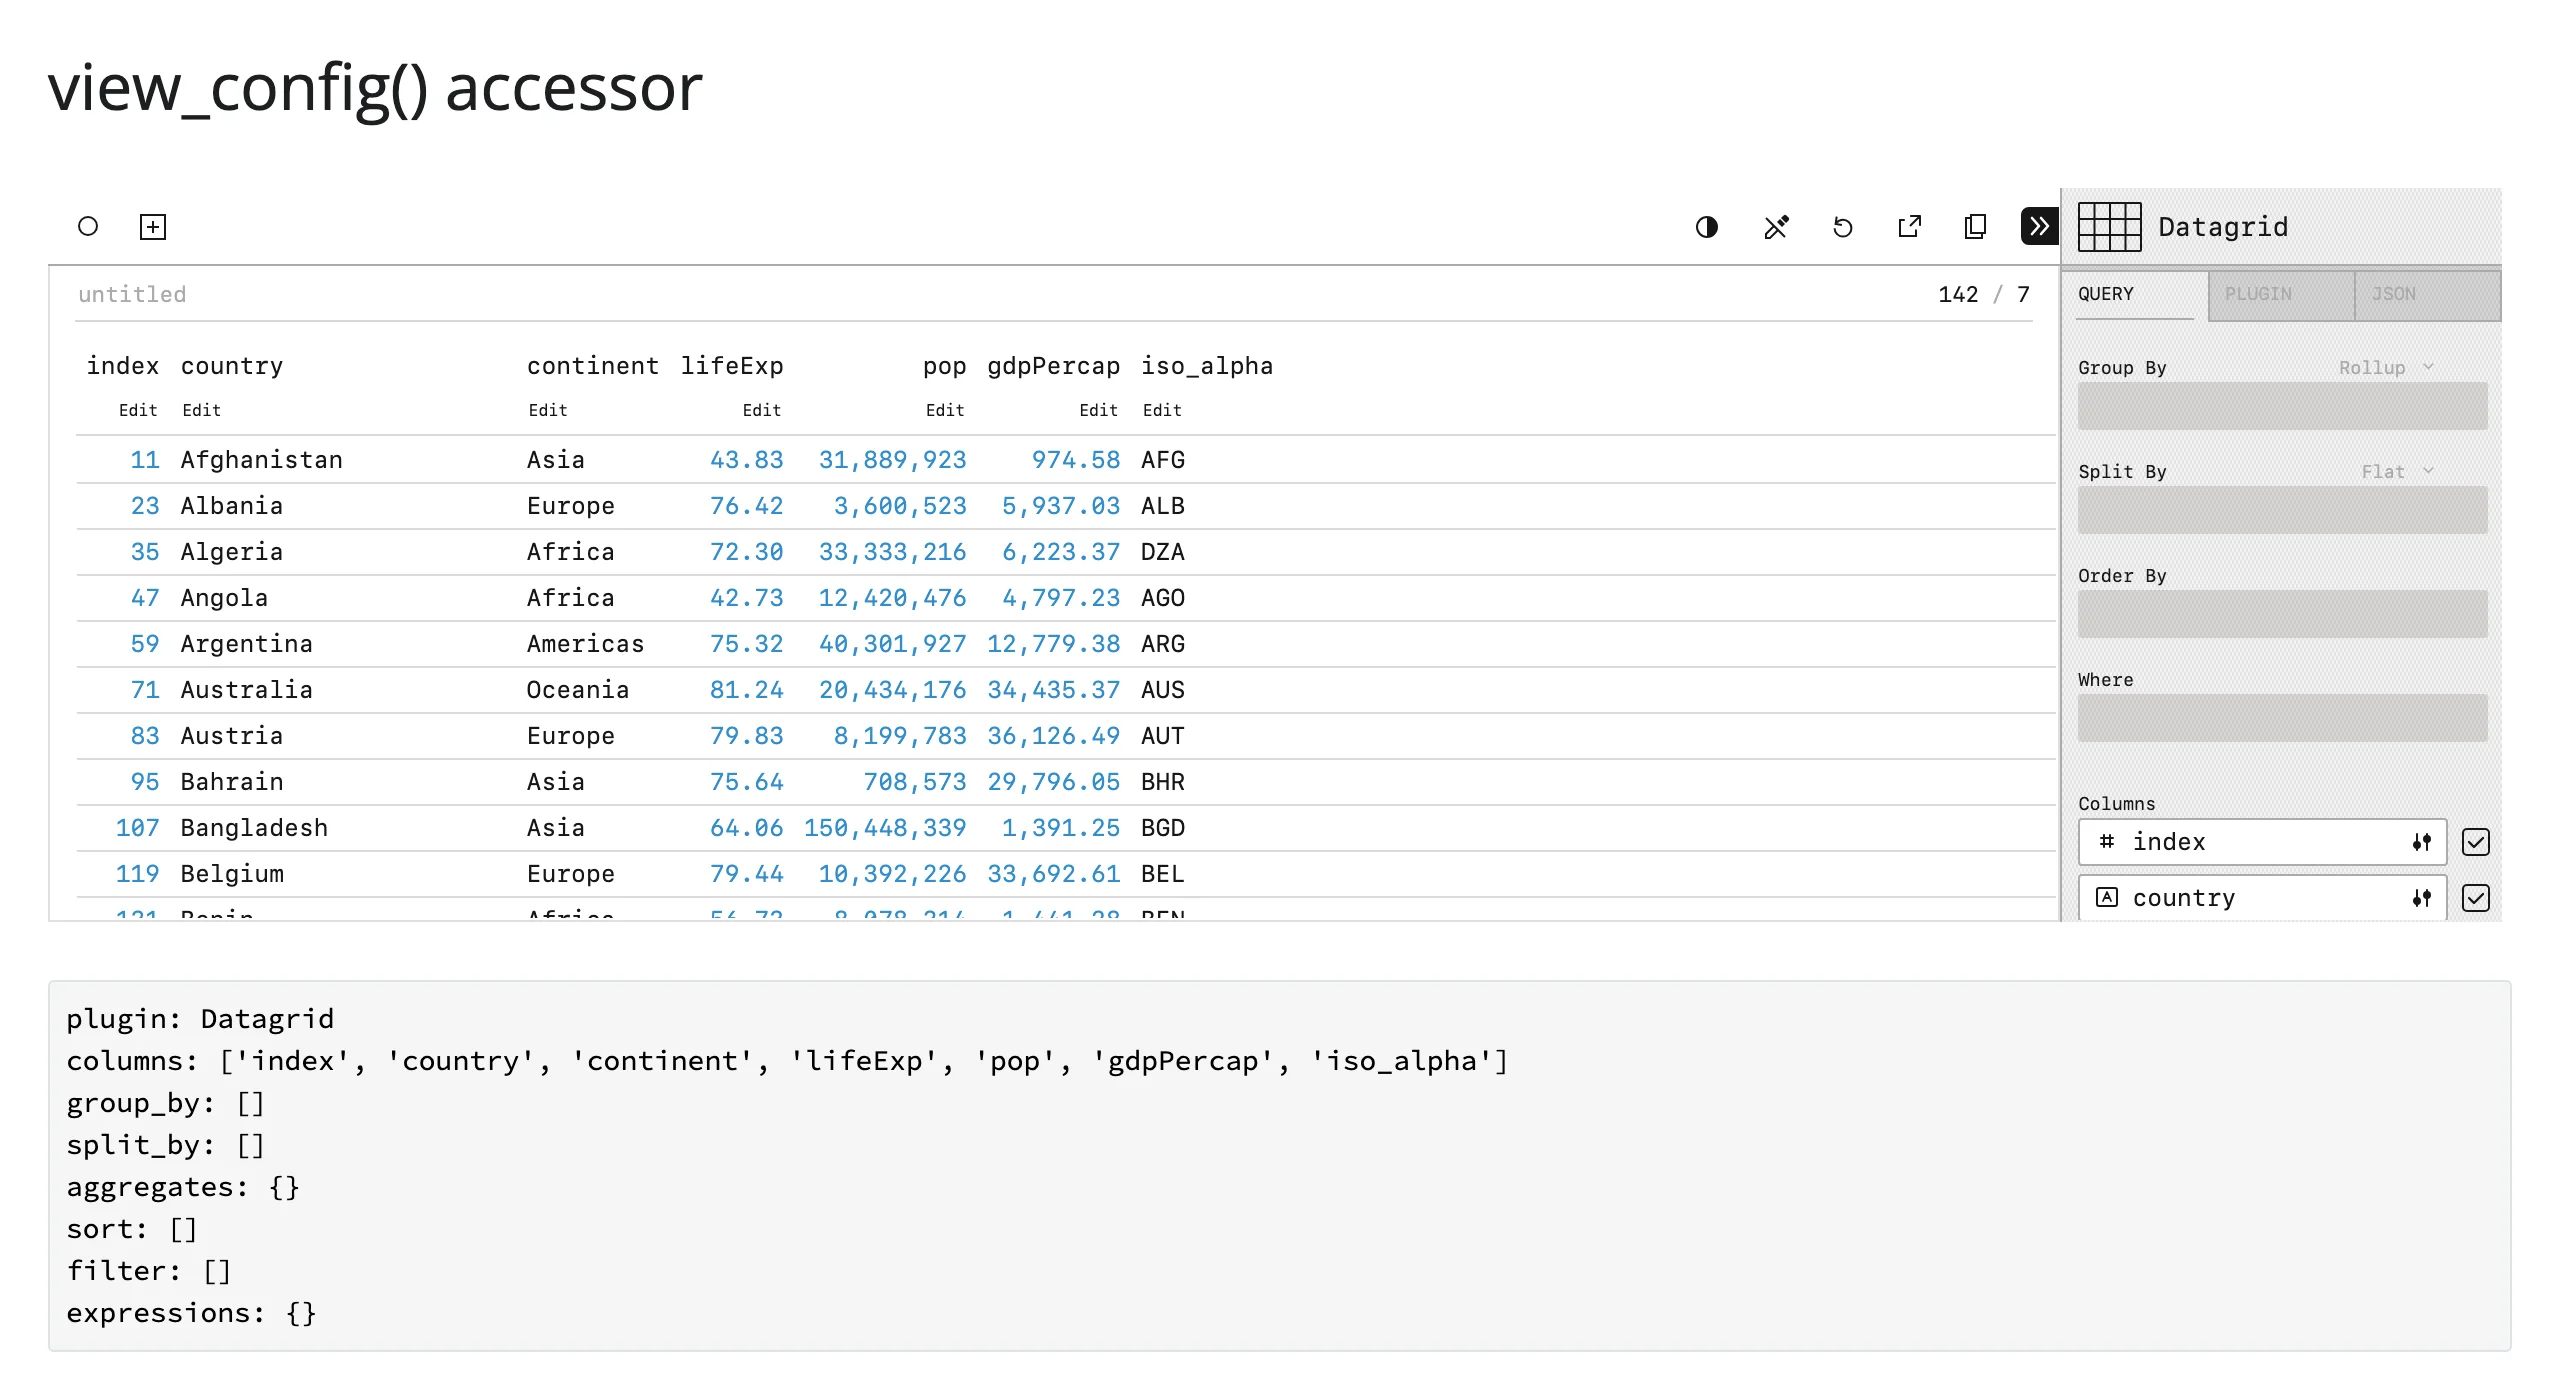
view_config() is the subset of PerspectiveWidget.save() that determines which rows are shown: pivoting, splitting, aggregation, sort, filter, and expressions, plus plugin (which affects how they’re drawn, not which rows). Cosmetic state – theme, title, settings, plugin_config, columns_config – is deliberately excluded, so opening the settings panel or switching themes doesn’t invalidate anything that depends on it.
from __future__ import annotations

import plotly.express as px
from shiny.express import render, ui
from shinywidgets import render_perspective

ui.page_opts(title="view_config() accessor", fillable=True)

countries = px.data.gapminder().query("year == 2007").drop(columns=["year", "iso_num"])


@render_perspective
def grid():
    return countries


@render.code
def config_state():
    # The structural subset of the viewer's config: plugin, columns,
    # group_by, split_by, aggregates, sort, filter, expressions. Cosmetic
    # changes (opening settings, switching themes) don't fire this.
    cfg = grid.view_config()
    return "\n".join(f"{k}: {v}" for k, v in cfg.items())
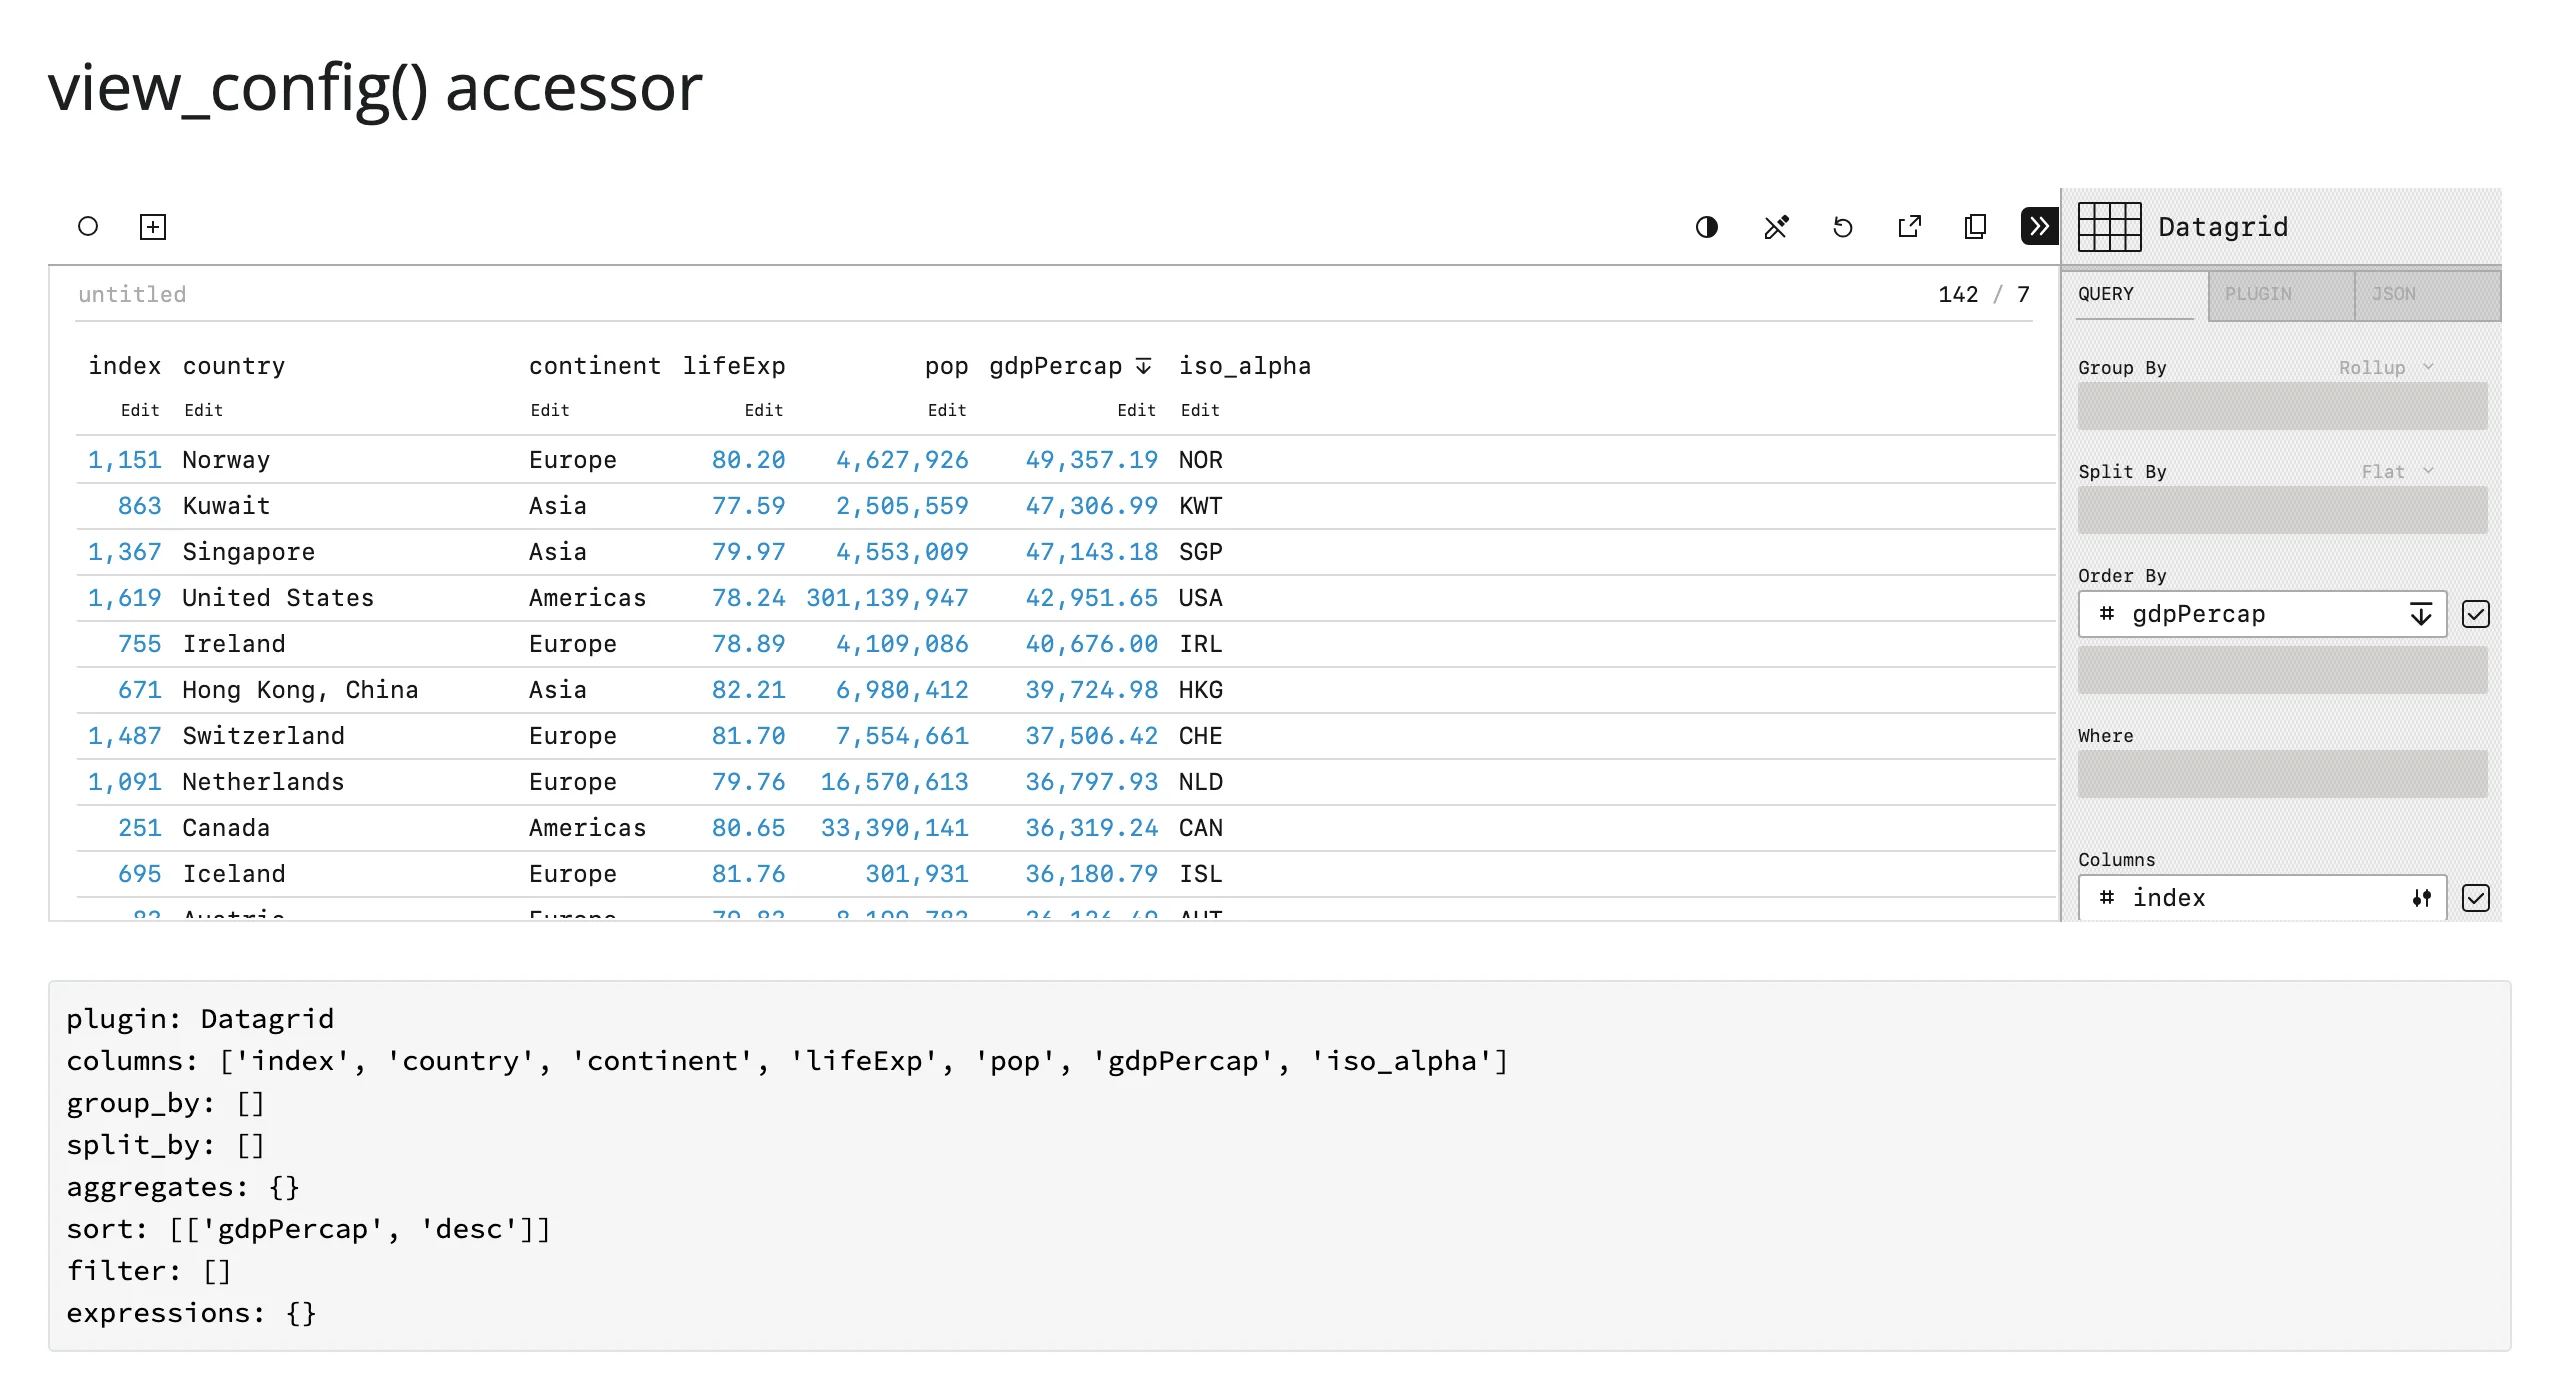
Clicking the gdpPercap column header to sort by it updates view_config()["sort"] (Norway, Kuwait, and Singapore top the 2007 ranking):
To reproduce the exact rows a view_config() represents, replay it against the table, dropping plugin (which Table.view() doesn’t accept) (examples/10_linked_filtered_summary.py):
cfg = {k: v for k, v in grid.view_config().items() if k != "plugin"}
view = grid.widget.table.view(**cfg)
Beyond the accessors: read()
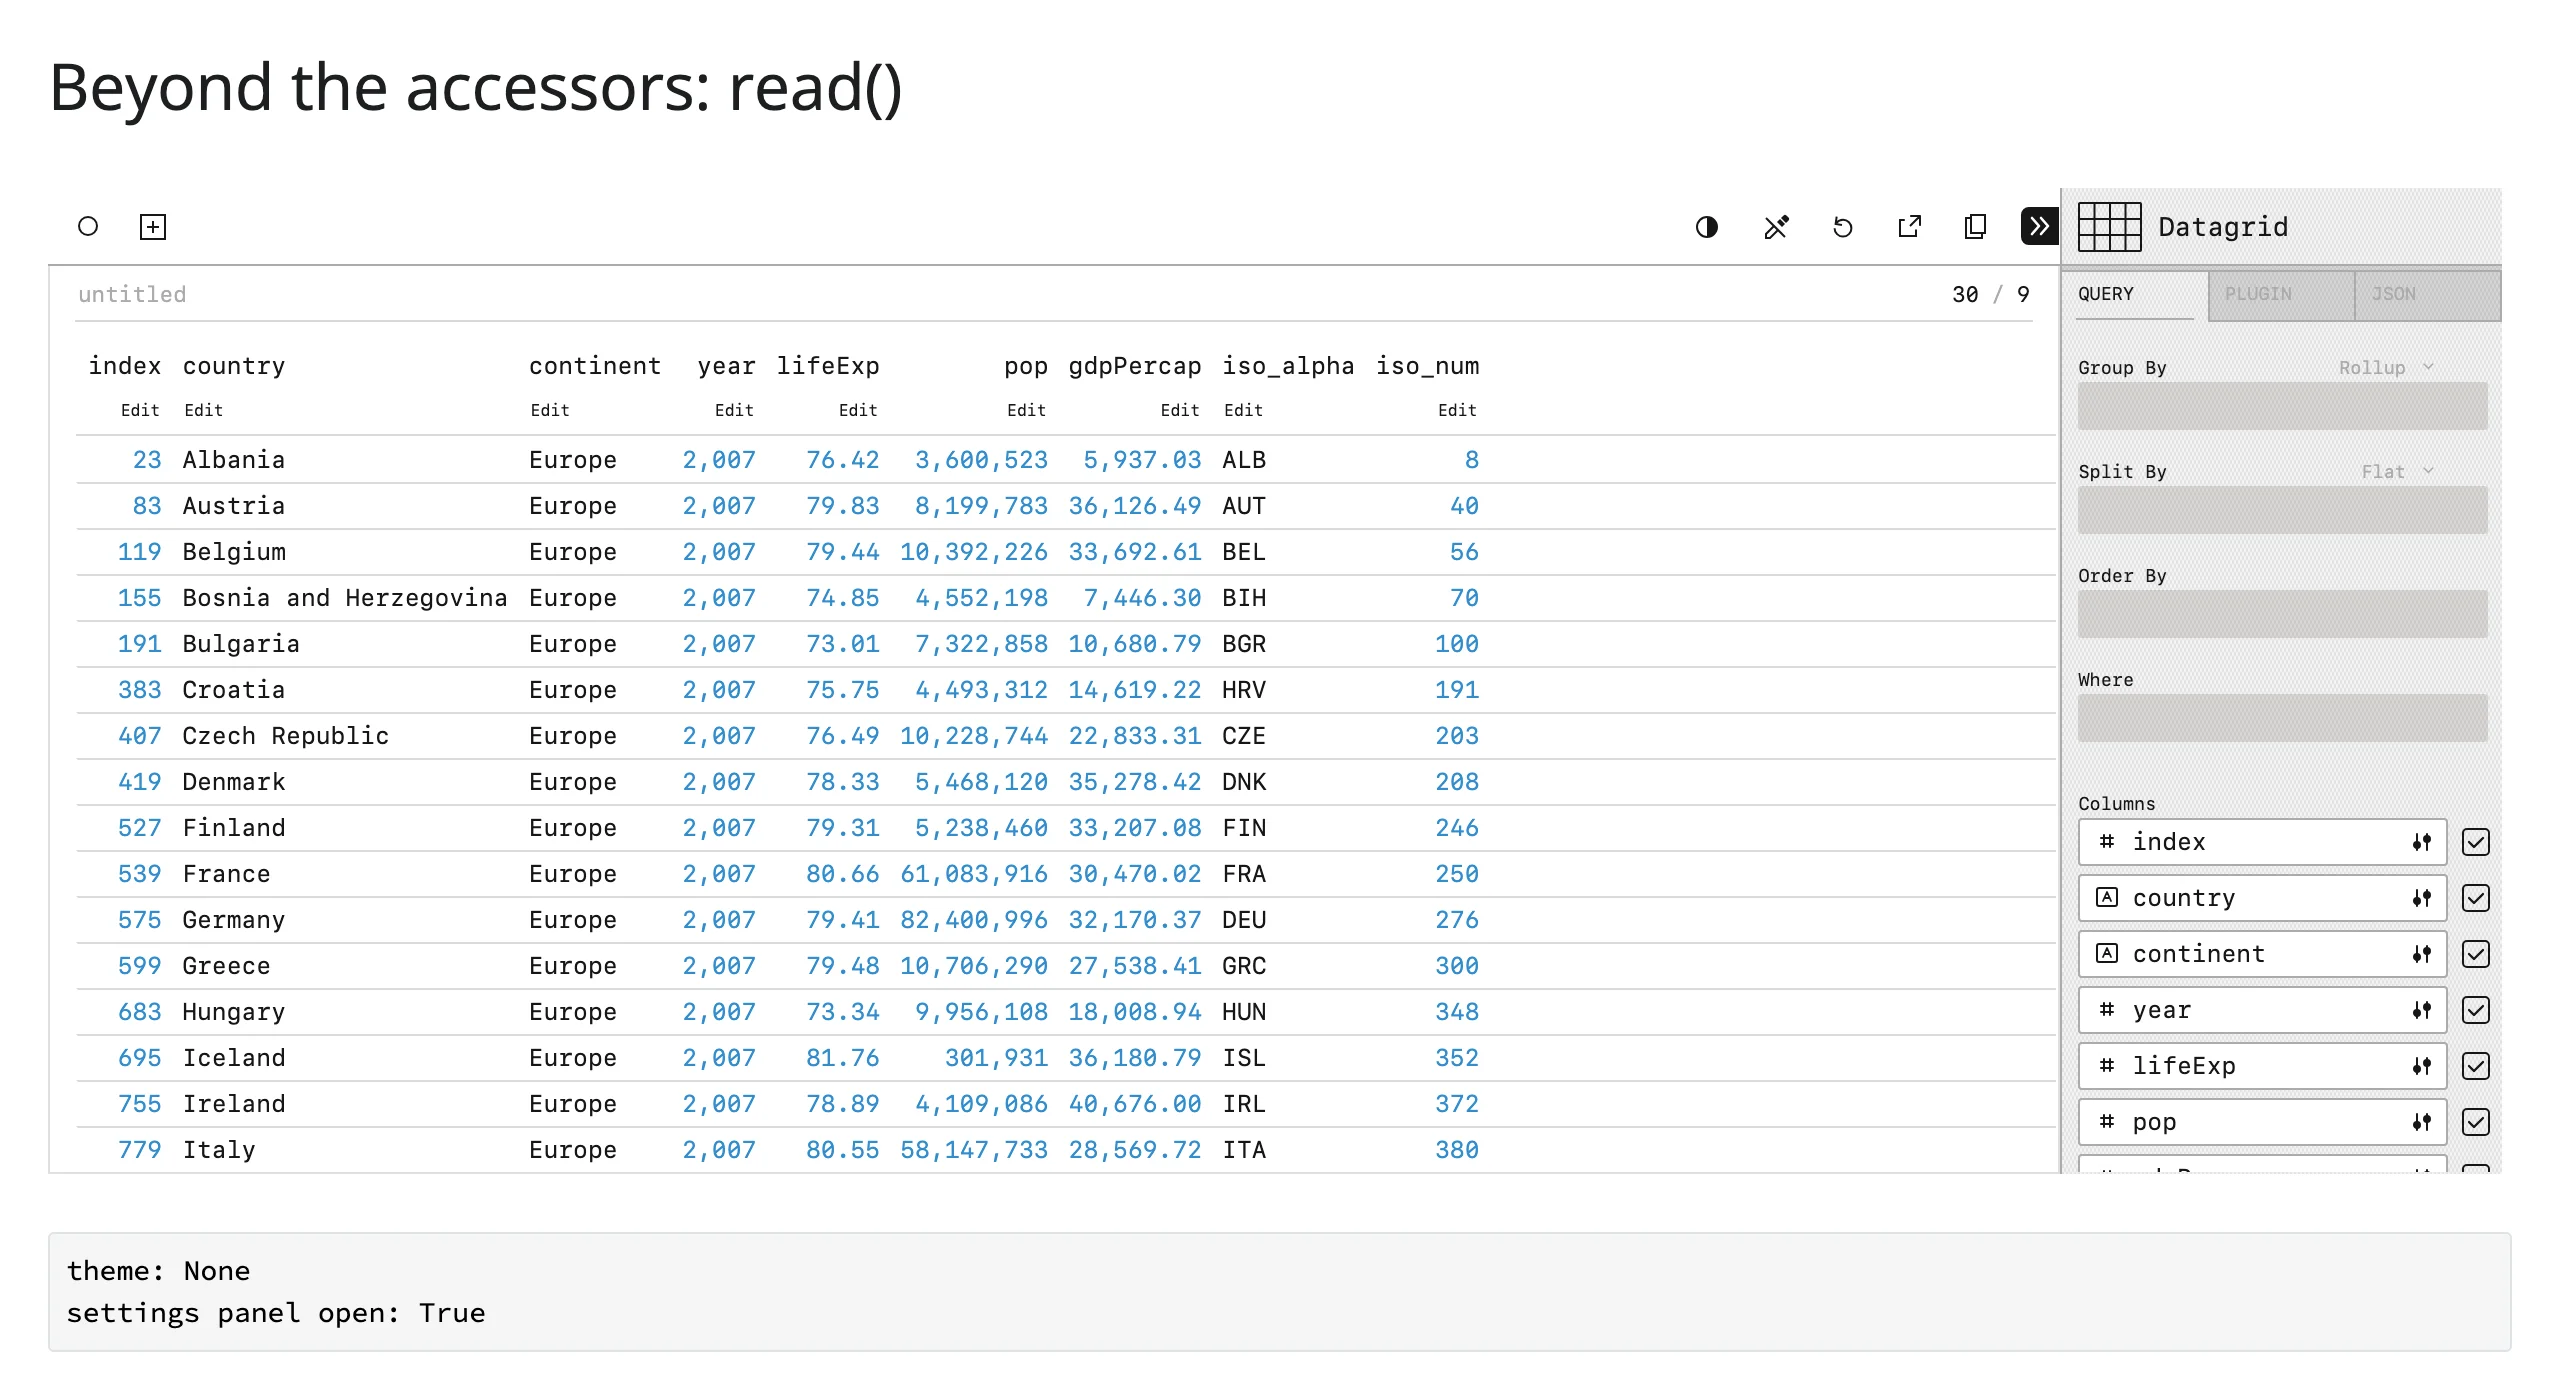
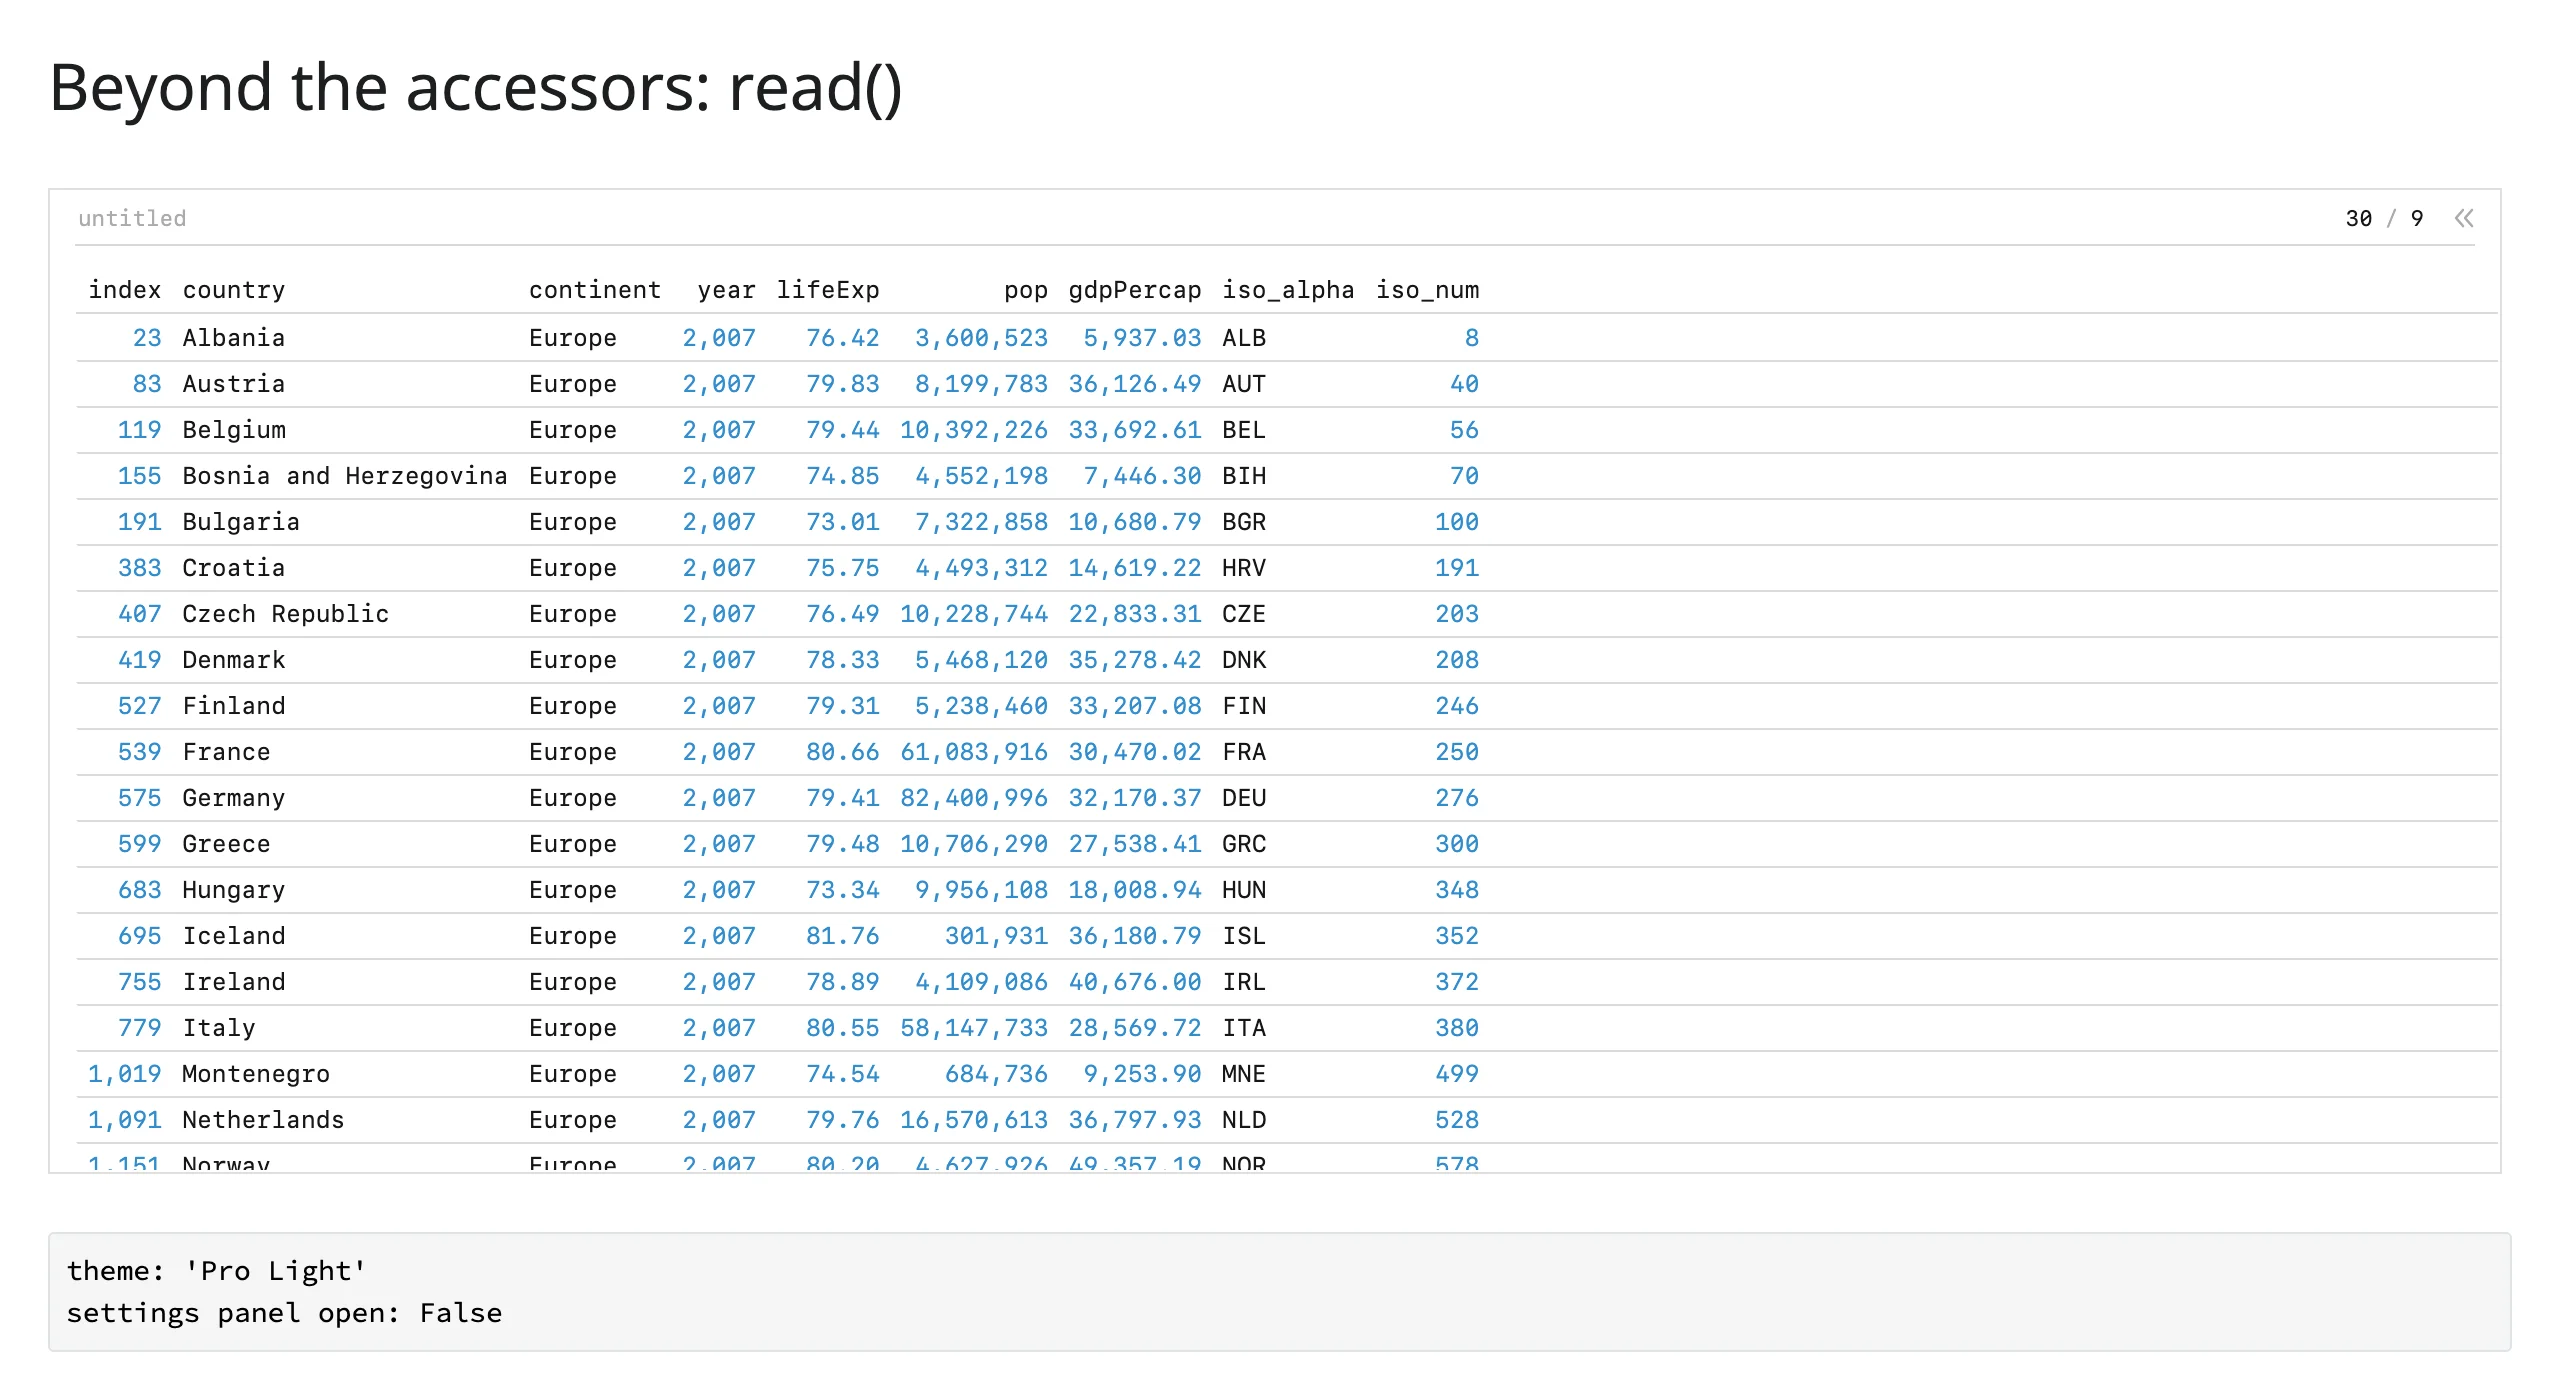
Cosmetic traits aren’t part of view_config(), but they’re still ordinary ipywidgets traits: theme, title, and settings (whether the settings panel is open) are the ones worth reading. grid.read("theme") is the preferred way to read them – it falls through to reactive_read() on the rendered widget for any name that isn’t a declared accessor, so there’s one method to reach for regardless of which tier a given name falls into.
from __future__ import annotations

import plotly.express as px
from shiny.express import render, ui
from shinywidgets import render_perspective

ui.page_opts(title="Beyond the accessors: read()", fillable=True)

countries = px.data.gapminder().query("year == 2007 and continent == 'Europe'")


@render_perspective
def grid():
    return countries


@render.code
def cosmetic_state():
    # theme/title/settings don't change which rows are shown, so they're
    # outside view_config() -- read() falls through to reactive_read() on
    # the widget for any trait that isn't a declared accessor.
    return f"theme: {grid.read('theme')!r}\nsettings panel open: {grid.read('settings')}"
Closing the settings panel flips the settings trait:
One quirk: right after a render, grid.read("theme") (equivalently, reactive_read(grid.widget, "theme")) can briefly read None, before the browser’s first sync sets it (verified). The two named accessors don’t have this problem – they seed with a real value ([] or the config dict) the moment they’re attached. If you read theme at startup, handle None.
Rate limiting
Neither accessor declares a default rate policy, so reading filter() or view_config() is never debounced or throttled out of the box – appropriate, since settings-panel edits are discrete actions, not a continuous stream of events like a map drag. The renderer still accepts rate_policy=/rate_delay= kwargs (e.g. @render_perspective(rate_policy="debounce", rate_delay=0.5)), which apply uniformly to any reactive_read() on the widget – useful if your app reads a trait that does fire rapidly, but not needed for the two accessors themselves.
Updating the widget from Python
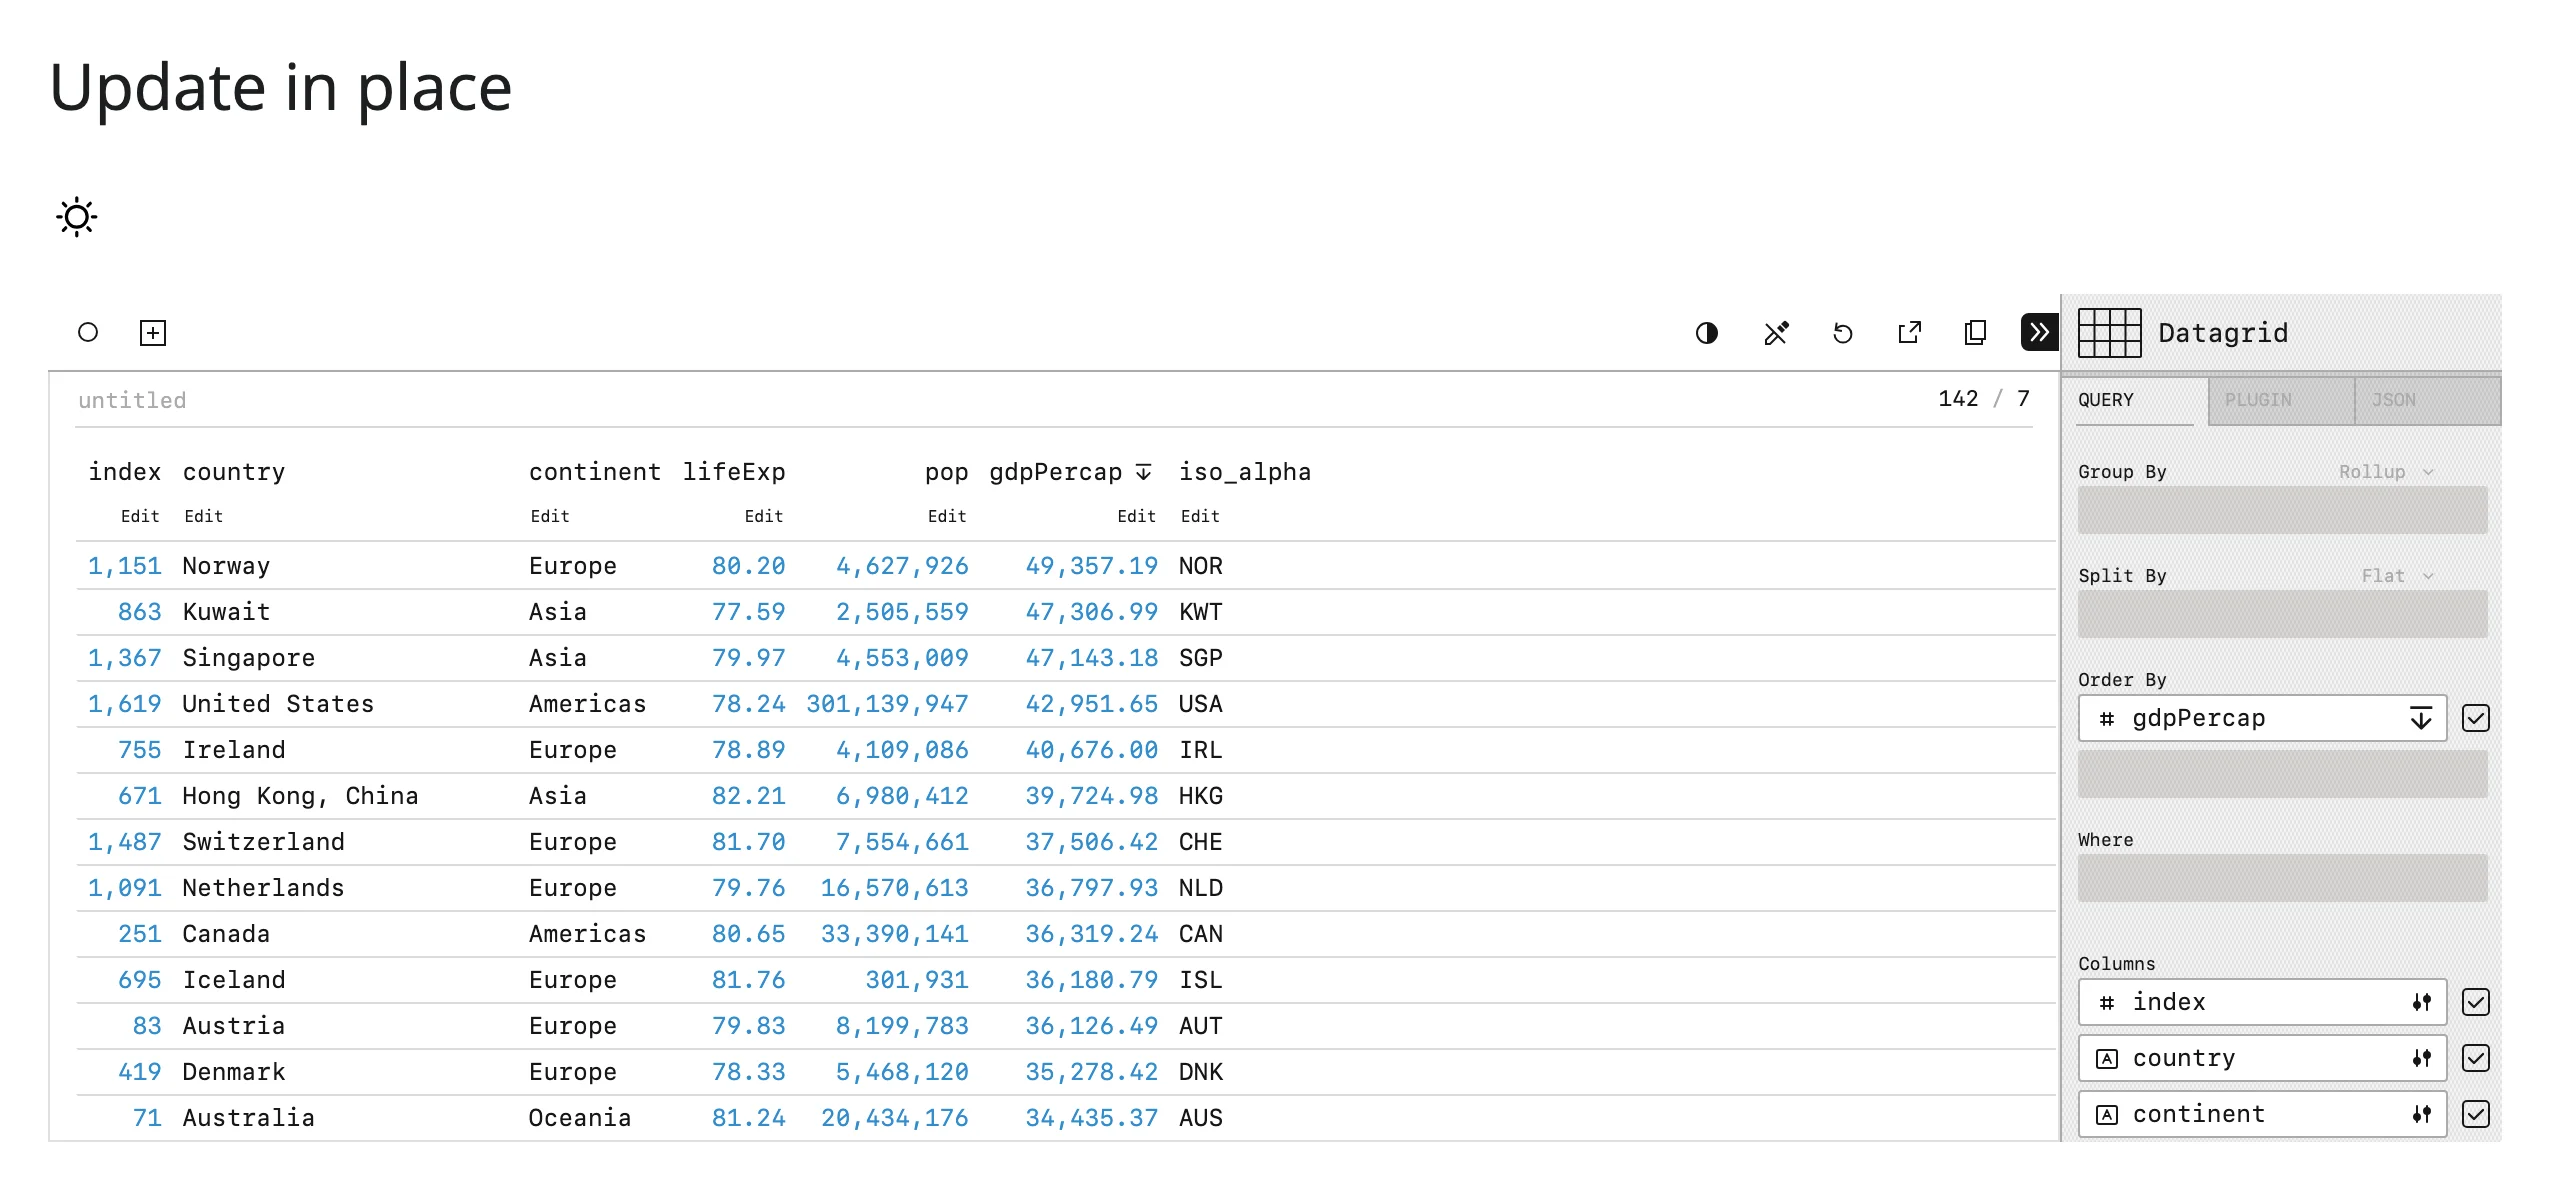
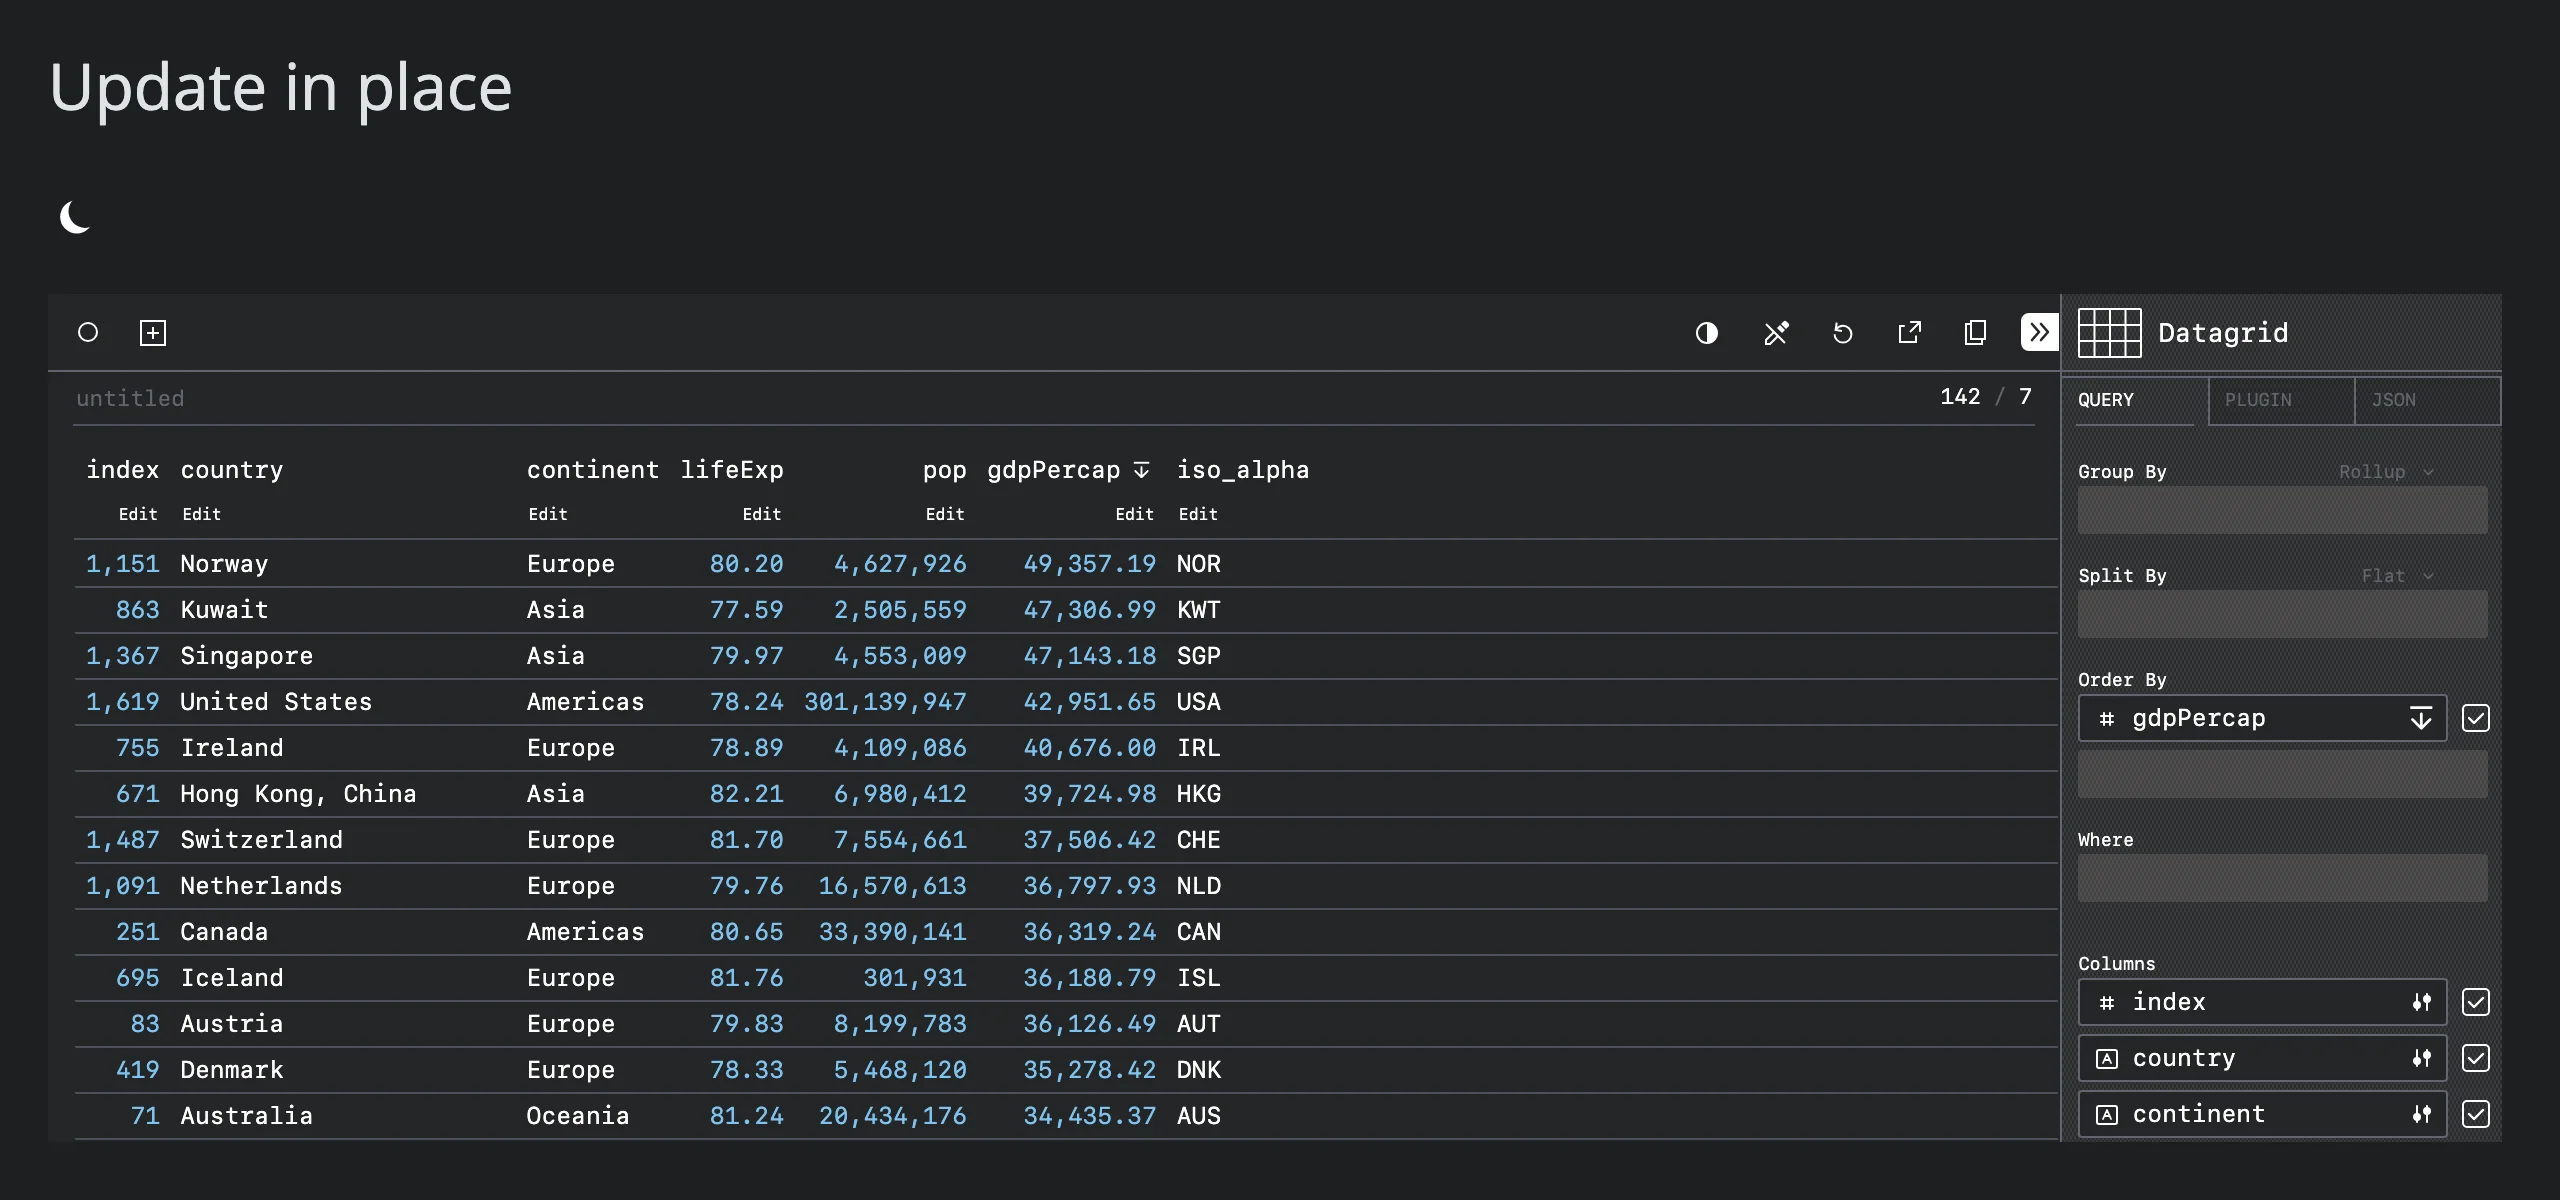
Two ways to change what a viewer shows: re-run the render function (a full rebuild) or mutate .widget in place (.widget.update(), .widget.theme = ..., etc.) from an effect. Prefer in-place updates whenever the user has set up a pivot, filter, or sort they’d be annoyed to lose – a re-render discards all of it and rebuilds the viewer from scratch, re-sending Perspective’s multi-megabyte JS bundle over the comm in the process.
from __future__ import annotations

import plotly.express as px
from shiny import reactive
from shiny.express import input, ui
from shinywidgets import render_perspective

ui.page_opts(title="Update in place", fillable=True)
ui.input_dark_mode(id="mode")

countries = px.data.gapminder().query("year == 2007").drop(columns=["year", "iso_num"])


@render_perspective
def grid():
    return countries


@reactive.effect
def _sync_theme():
    # Setting a trait on .widget pushes it to the live viewer over its comm:
    # whatever pivot/sort/filter the user already set stays, and Perspective's
    # multi-megabyte ESM bundle isn't re-sent. Re-running grid() instead would
    # rebuild the viewer from scratch and lose both.
    grid.widget.theme = "Pro Dark" if input.mode() == "dark" else "Pro Light"
Dark mode toggled in place – a sort by gdpPercap (set by hand before the toggle) survives:
The same rule applies to data changes: .widget.update(df) appends or upserts rows into the existing table in place; re-running the render function to “refresh the data” instead rebuilds the table (and viewer) from scratch, discarding the user’s pivot along with it.
Coordinating multiple views
Filter-driven server-side summary
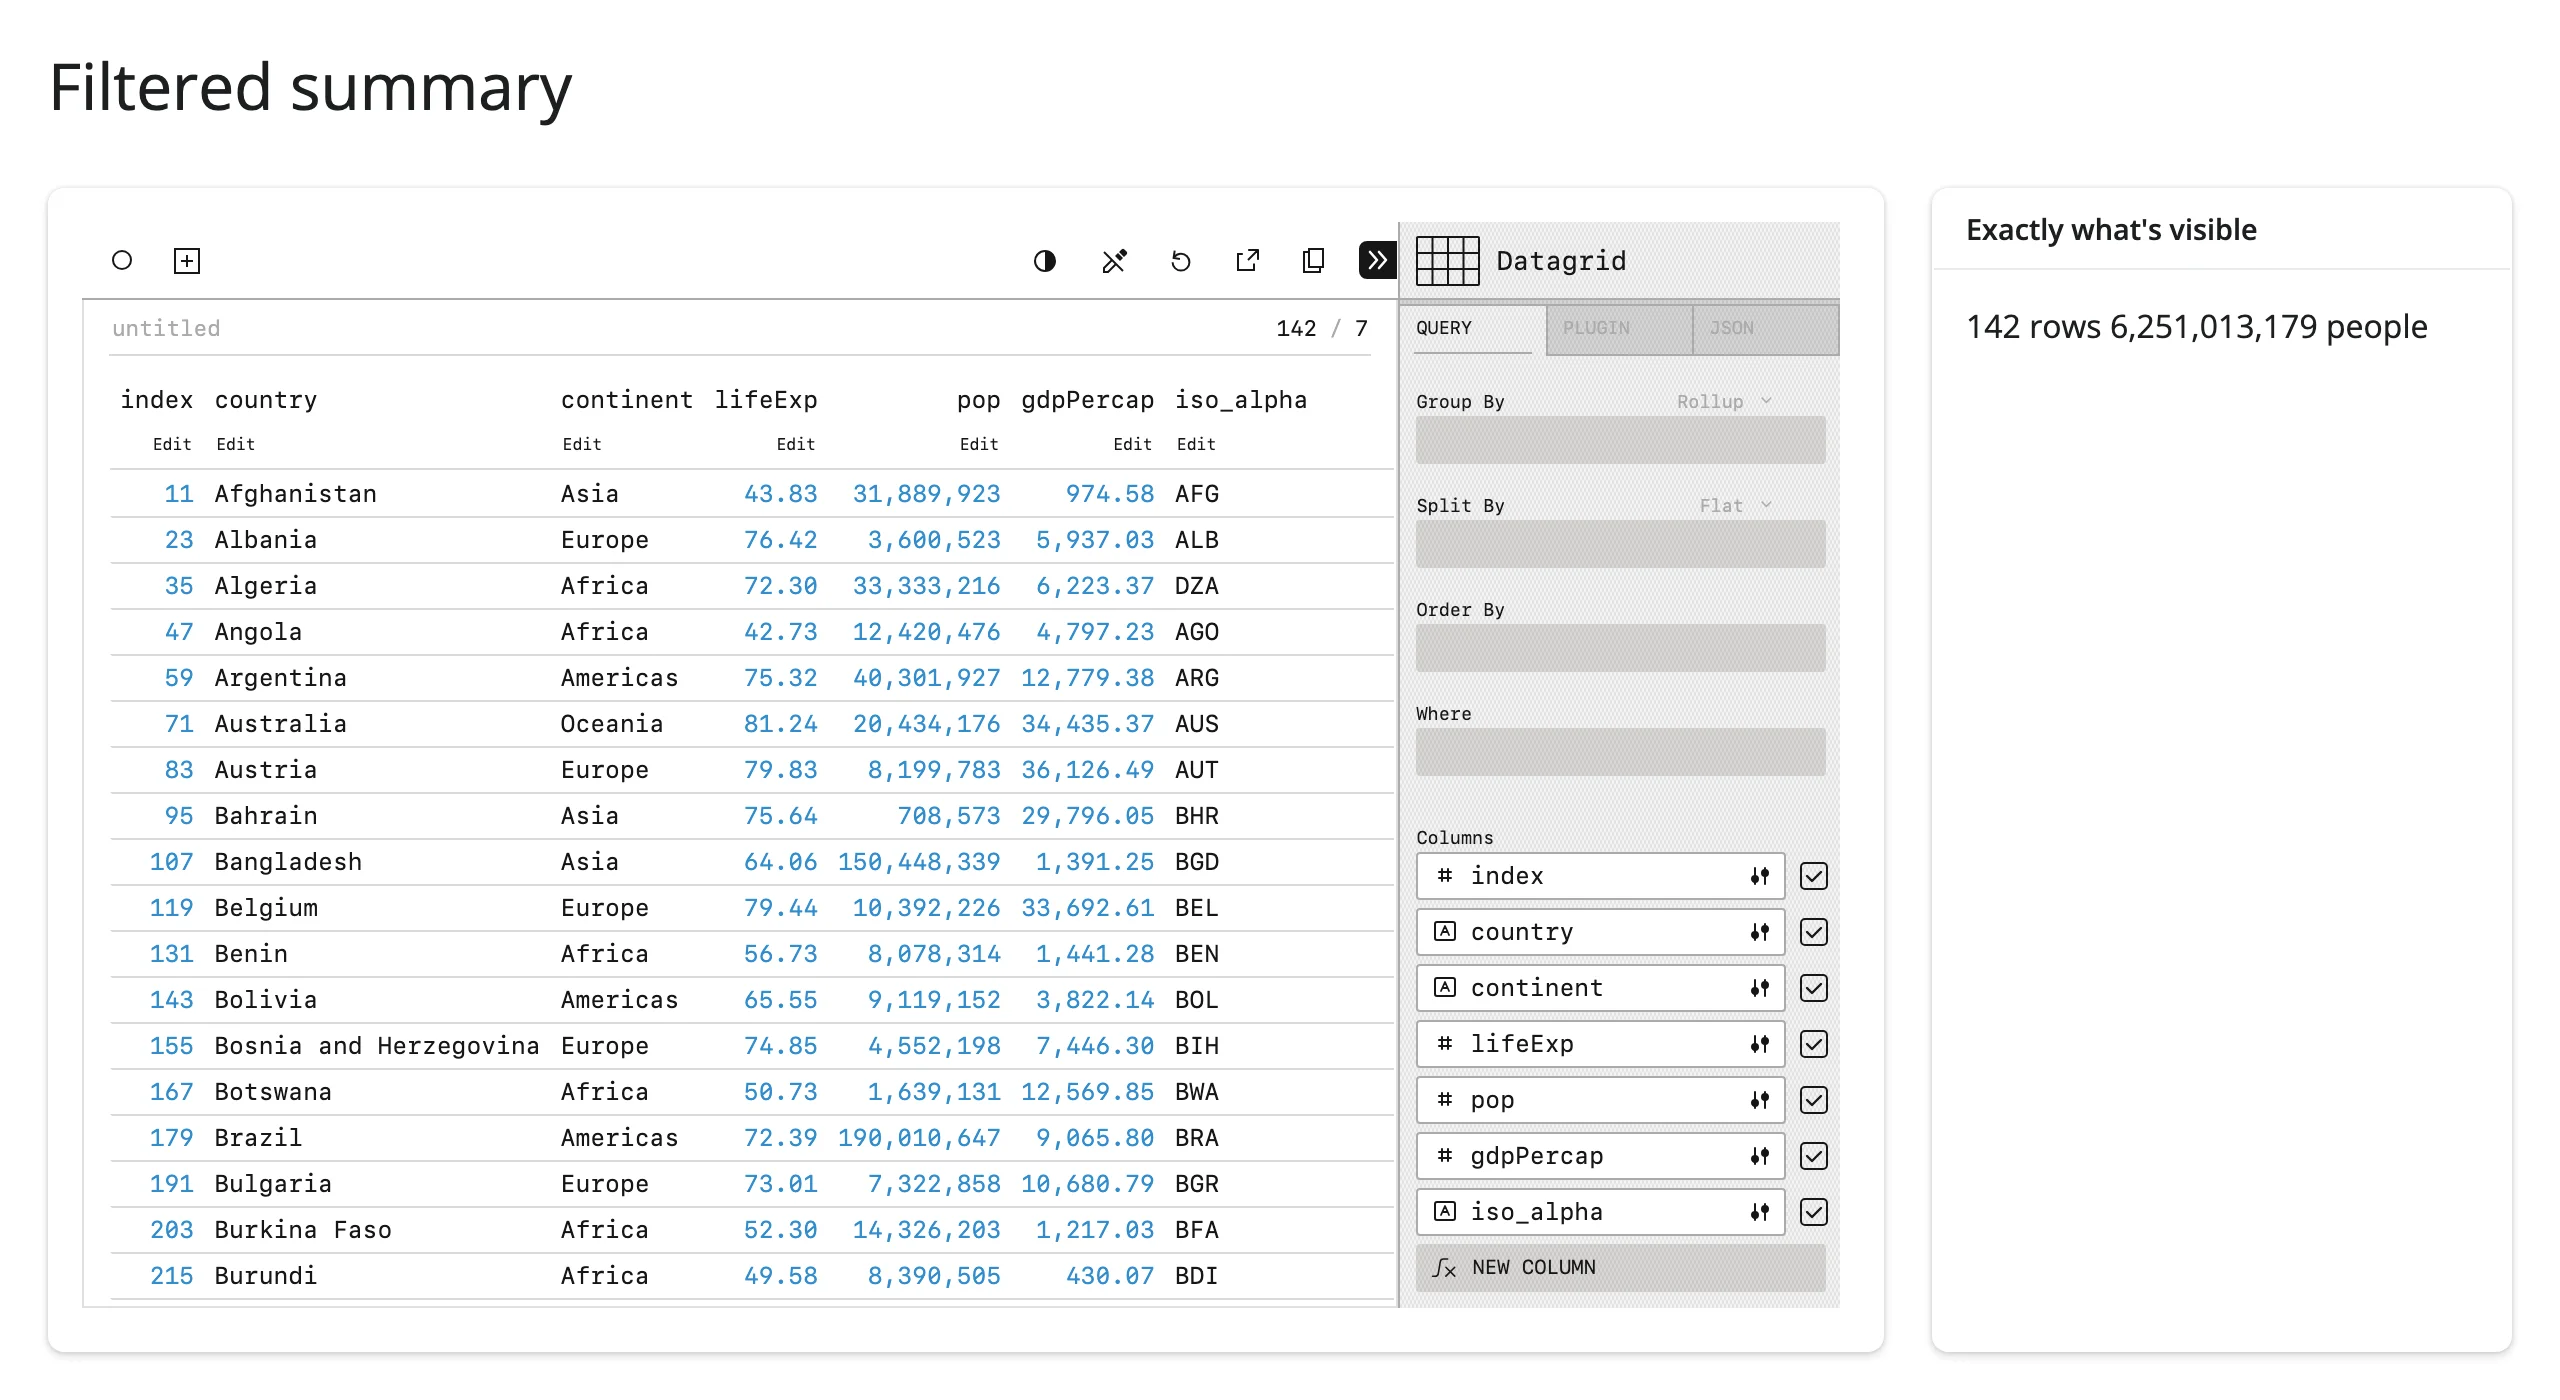
The most useful pattern for Perspective specifically: let the user pivot and filter in the browser, then replay their view_config() against the table in Python to compute something the viewer itself can’t show – here, an exact row/population count for whatever’s currently visible.
from __future__ import annotations

import plotly.express as px
from shiny.express import render, ui
from shinywidgets import render_perspective

ui.page_opts(title="Filtered summary", fillable=True)

countries = px.data.gapminder().query("year == 2007").drop(columns=["year", "iso_num"])

with ui.layout_columns(col_widths=[9, 3]):
    with ui.card(full_screen=True):

        @render_perspective
        def grid():
            return countries

    with ui.card():
        ui.card_header("Exactly what's visible")

        @render.text
        def total():
            # view_config() carries the pivot/group/filter the user set in
            # the browser; replay it server-side so the total always matches
            # the rows on screen. Drop "plugin": it's how rows are drawn,
            # not which ones.
            cfg = {k: v for k, v in grid.view_config().items() if k != "plugin"}
            view = grid.widget.table.view(**cfg)
            cols = view.to_columns()
            view.delete()
            if "__ROW_PATH__" in cols:
                # Grouped views put a grand total in the first row (its
                # __ROW_PATH__ is []); summing every row would double-count it.
                pop = cols["pop"][0]
                rows = len(cols["__ROW_PATH__"]) - 1
            else:
                pop = sum(cols.get("pop", []))
                rows = len(cols.get("country", cols.get("pop", [])))
            return f"{rows} rows\n{pop:,.0f} people"
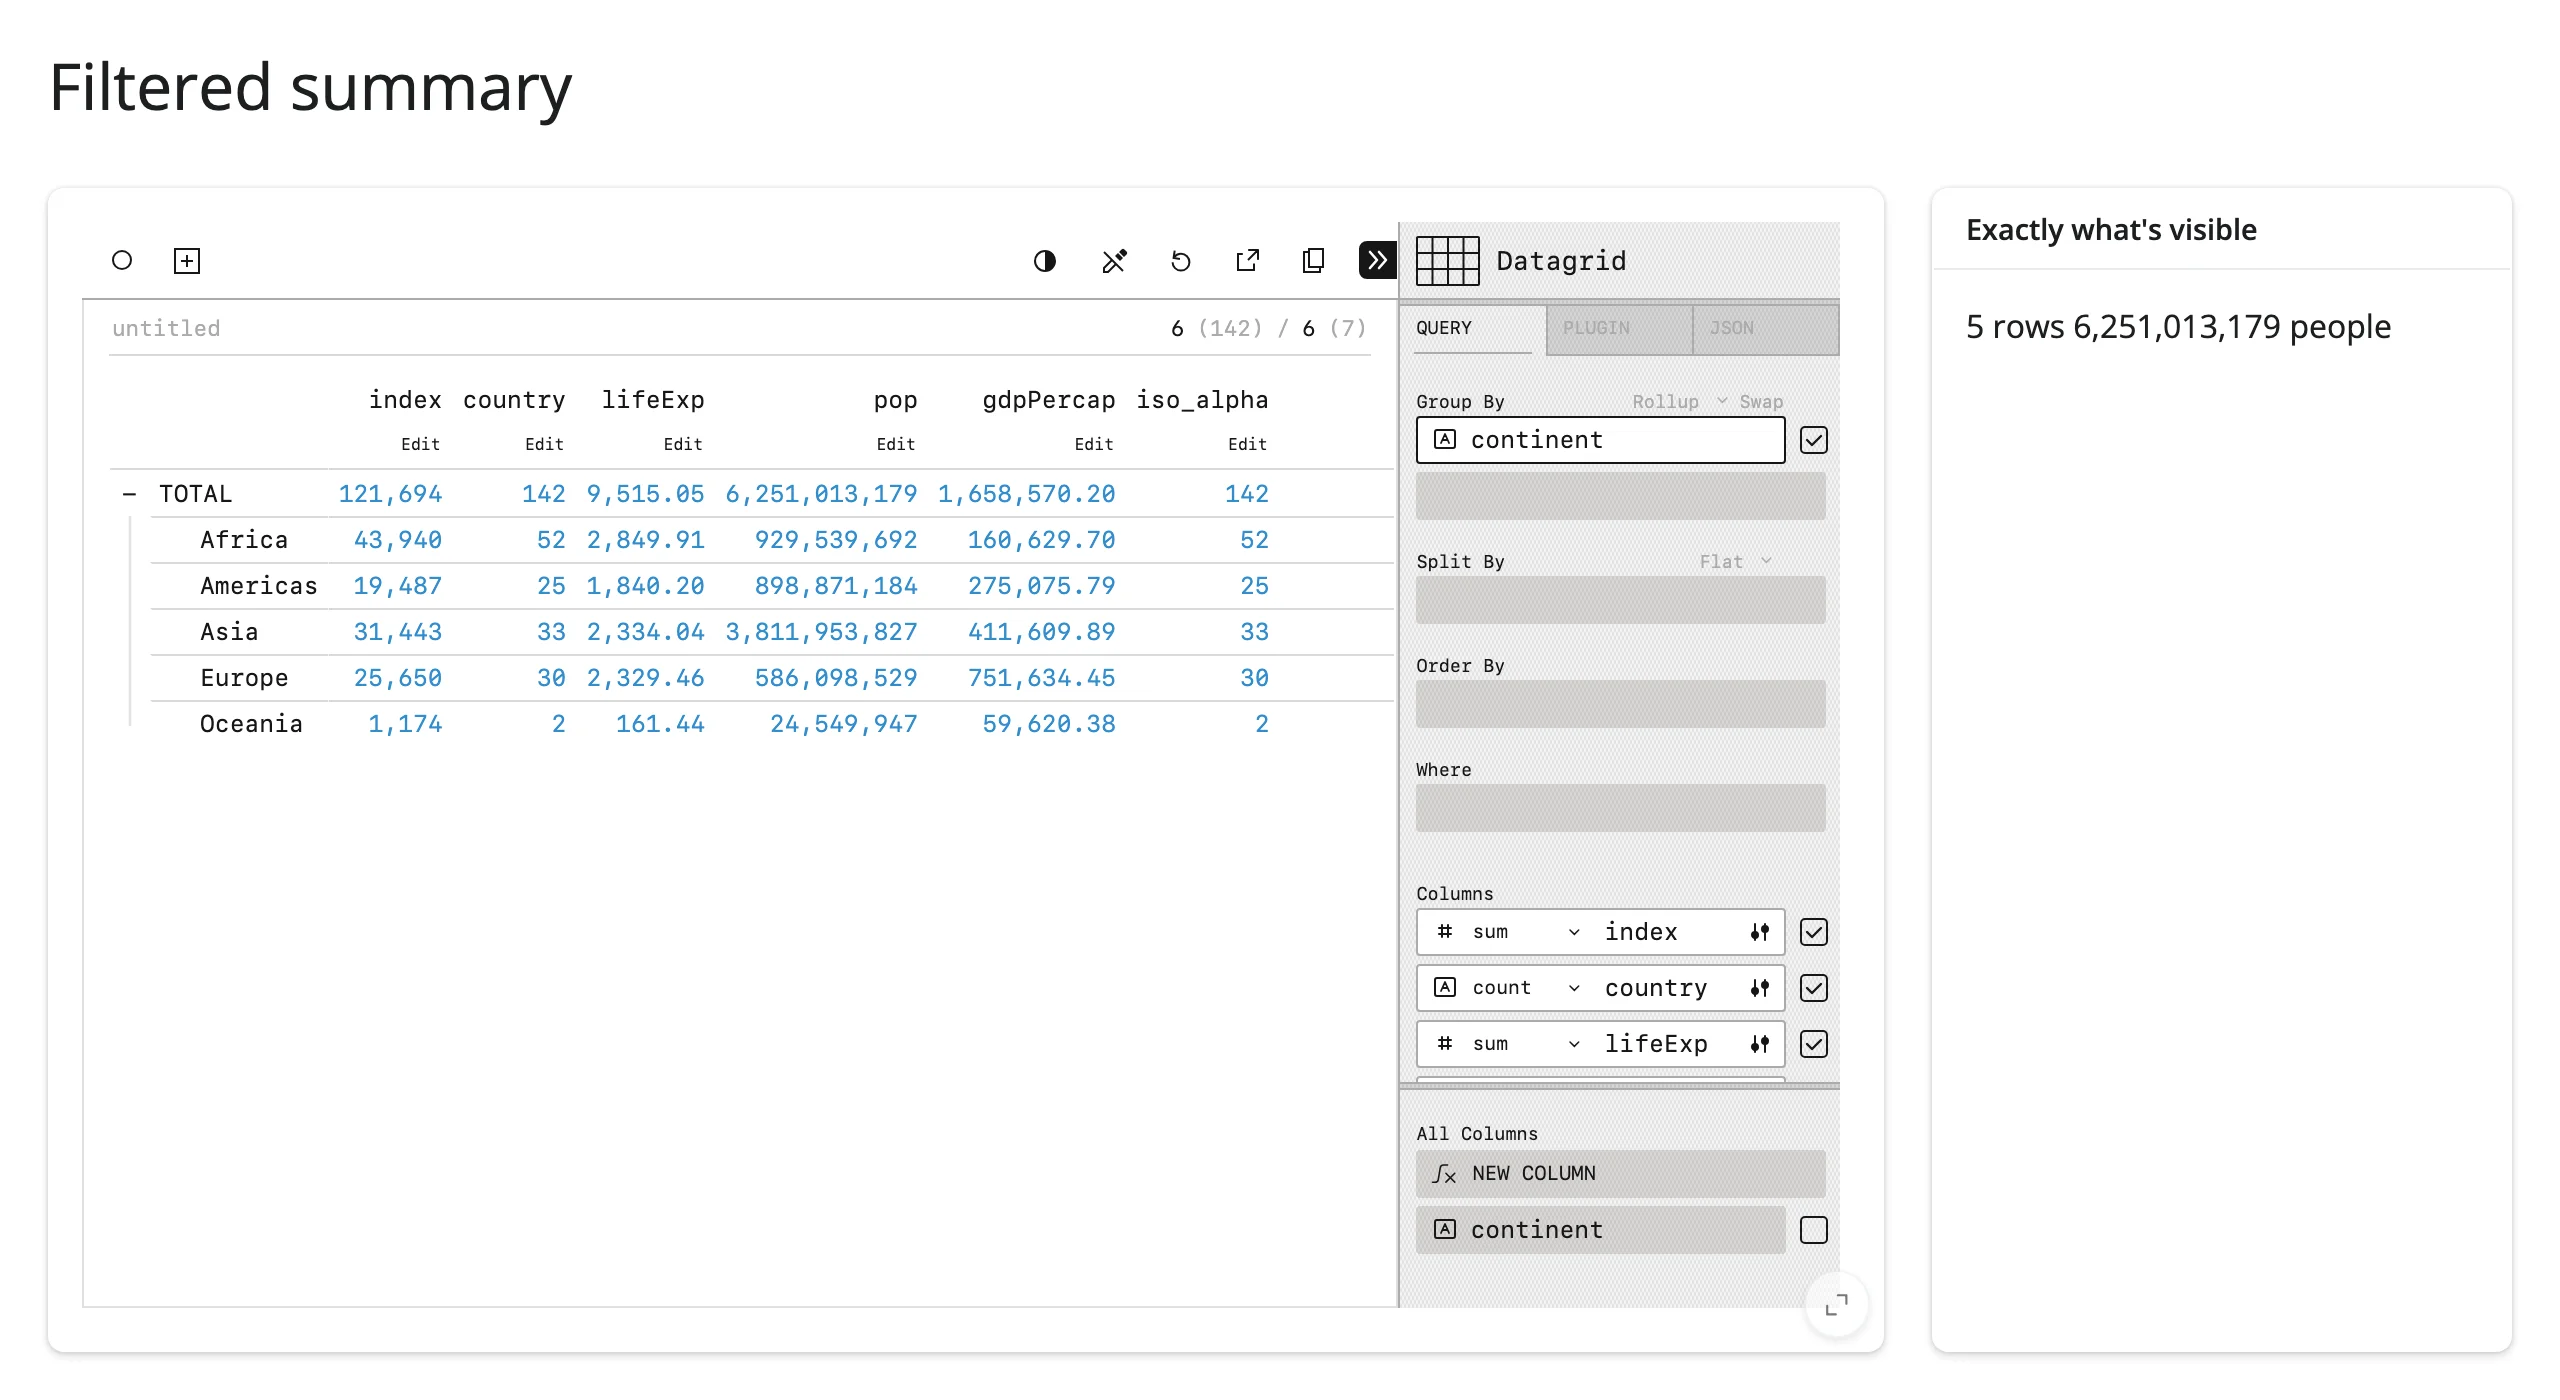
Grouping by continent in the browser collapses the grid to 5 rows; the summary card still reports the correct 2007 world population (6.25 billion) by reading the grouped view’s total row instead of summing every displayed row:
One table, two synced viewers
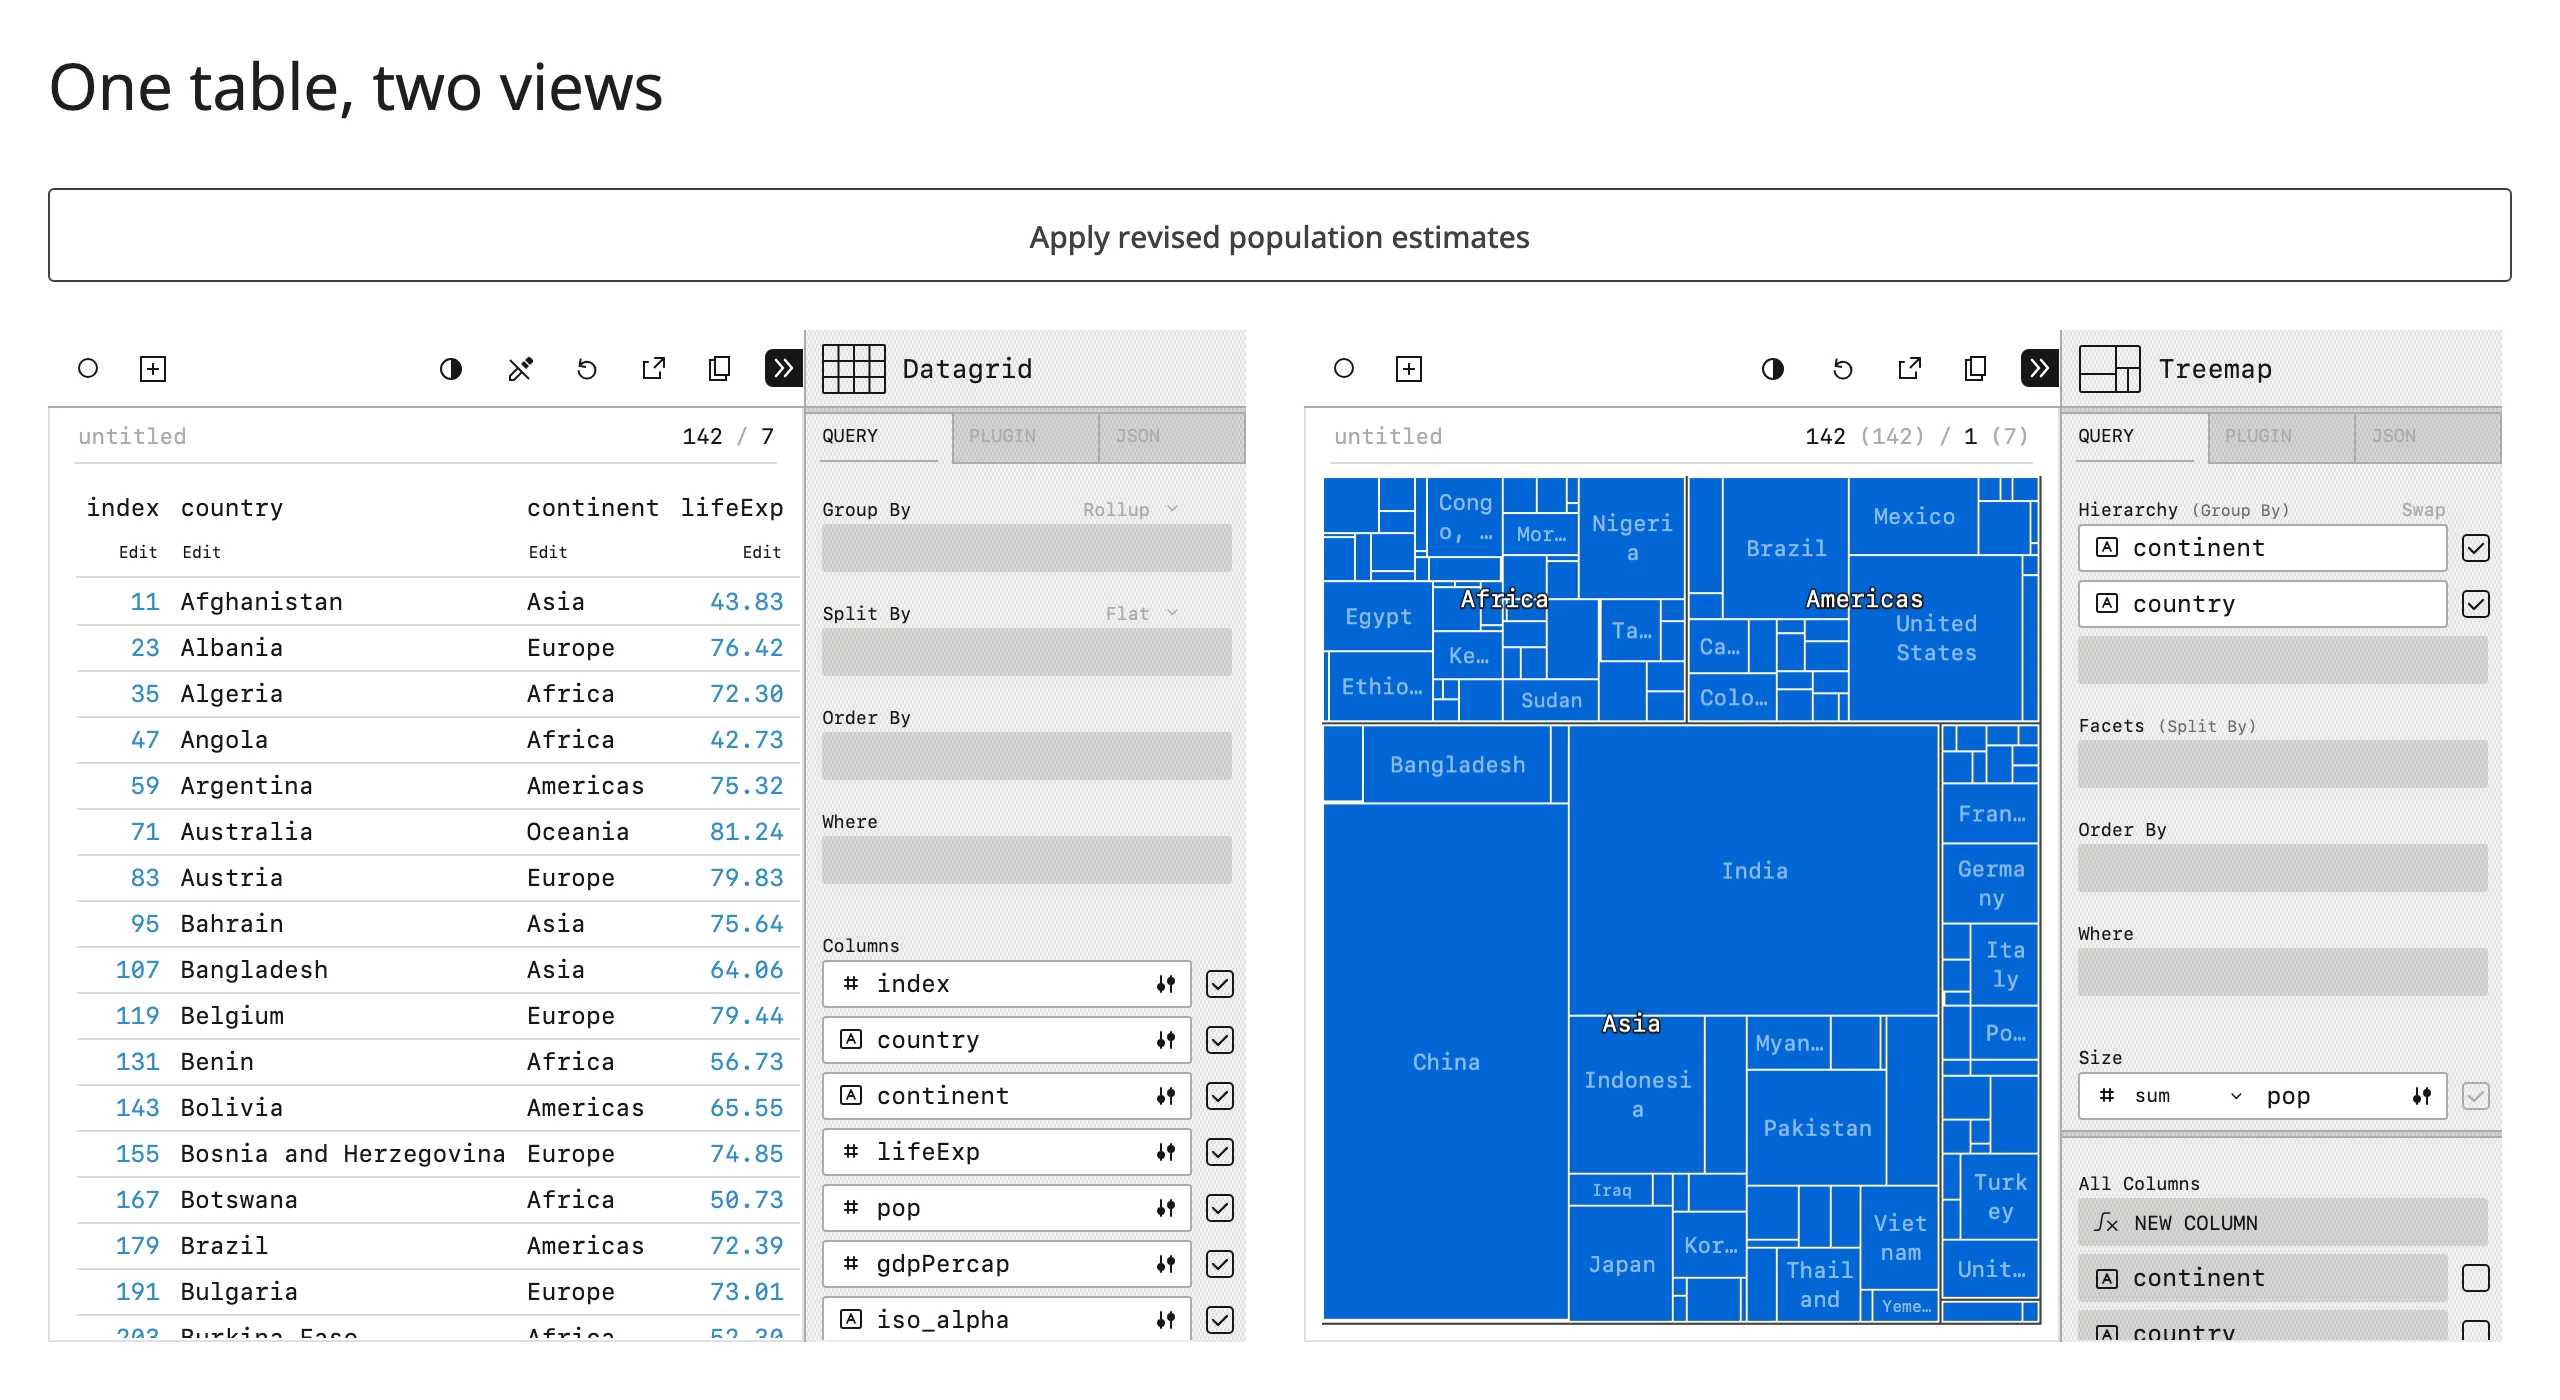
Perspective tables aren’t tied to a single viewer. Build one table and hand it to two PerspectiveWidgets – a detail grid and a summary chart – and both repaint whenever the table changes, with no extra wiring. Since Shiny Express re-runs the whole script once per session, a table built at the top level (not inside a render function) is already private to that session. Building the table with index="country" makes update() an upsert: rows matching an existing key are revised in place instead of appended, which is the right shape for “a few countries’ estimates got revised,” not just “new rows arrived.”
from __future__ import annotations

import plotly.express as px
from perspective import Server
from perspective.widget import PerspectiveWidget
from shiny import reactive
from shiny.express import input, ui
from shinywidgets import render_perspective

ui.page_opts(title="One table, two views", fillable=True)
ui.input_action_button("revise", "Apply revised population estimates")

countries = px.data.gapminder().query("year == 2007").drop(columns=["year", "iso_num"])

# Express re-runs this whole script once per session, so a table built here
# at the top level is already private to this session -- no extra bookkeeping
# needed to share it between the two viewers below. `index="country"` makes
# update() upsert: matching rows are revised in place instead of appended.
table = Server().new_local_client().table(countries, index="country")


@reactive.effect
@reactive.event(input.revise)
def _():
    # A real-world update: a few countries get revised population figures.
    # Streams to both viewers below at once -- they share one table.
    table.update(
        [
            {"country": "China", "pop": 1_360_000_000},
            {"country": "India", "pop": 1_200_000_000},
            {"country": "Nigeria", "pop": 150_000_000},
        ]
    )


with ui.layout_columns():

    @render_perspective
    def datagrid():
        return PerspectiveWidget(table, plugin="Datagrid")

    @render_perspective
    def treemap():
        return PerspectiveWidget(
            table,
            plugin="Treemap",
            columns=["pop"],  # otherwise sizes by the auto "index" column
            group_by=["continent", "country"],
            aggregates={"pop": "sum"},
        )
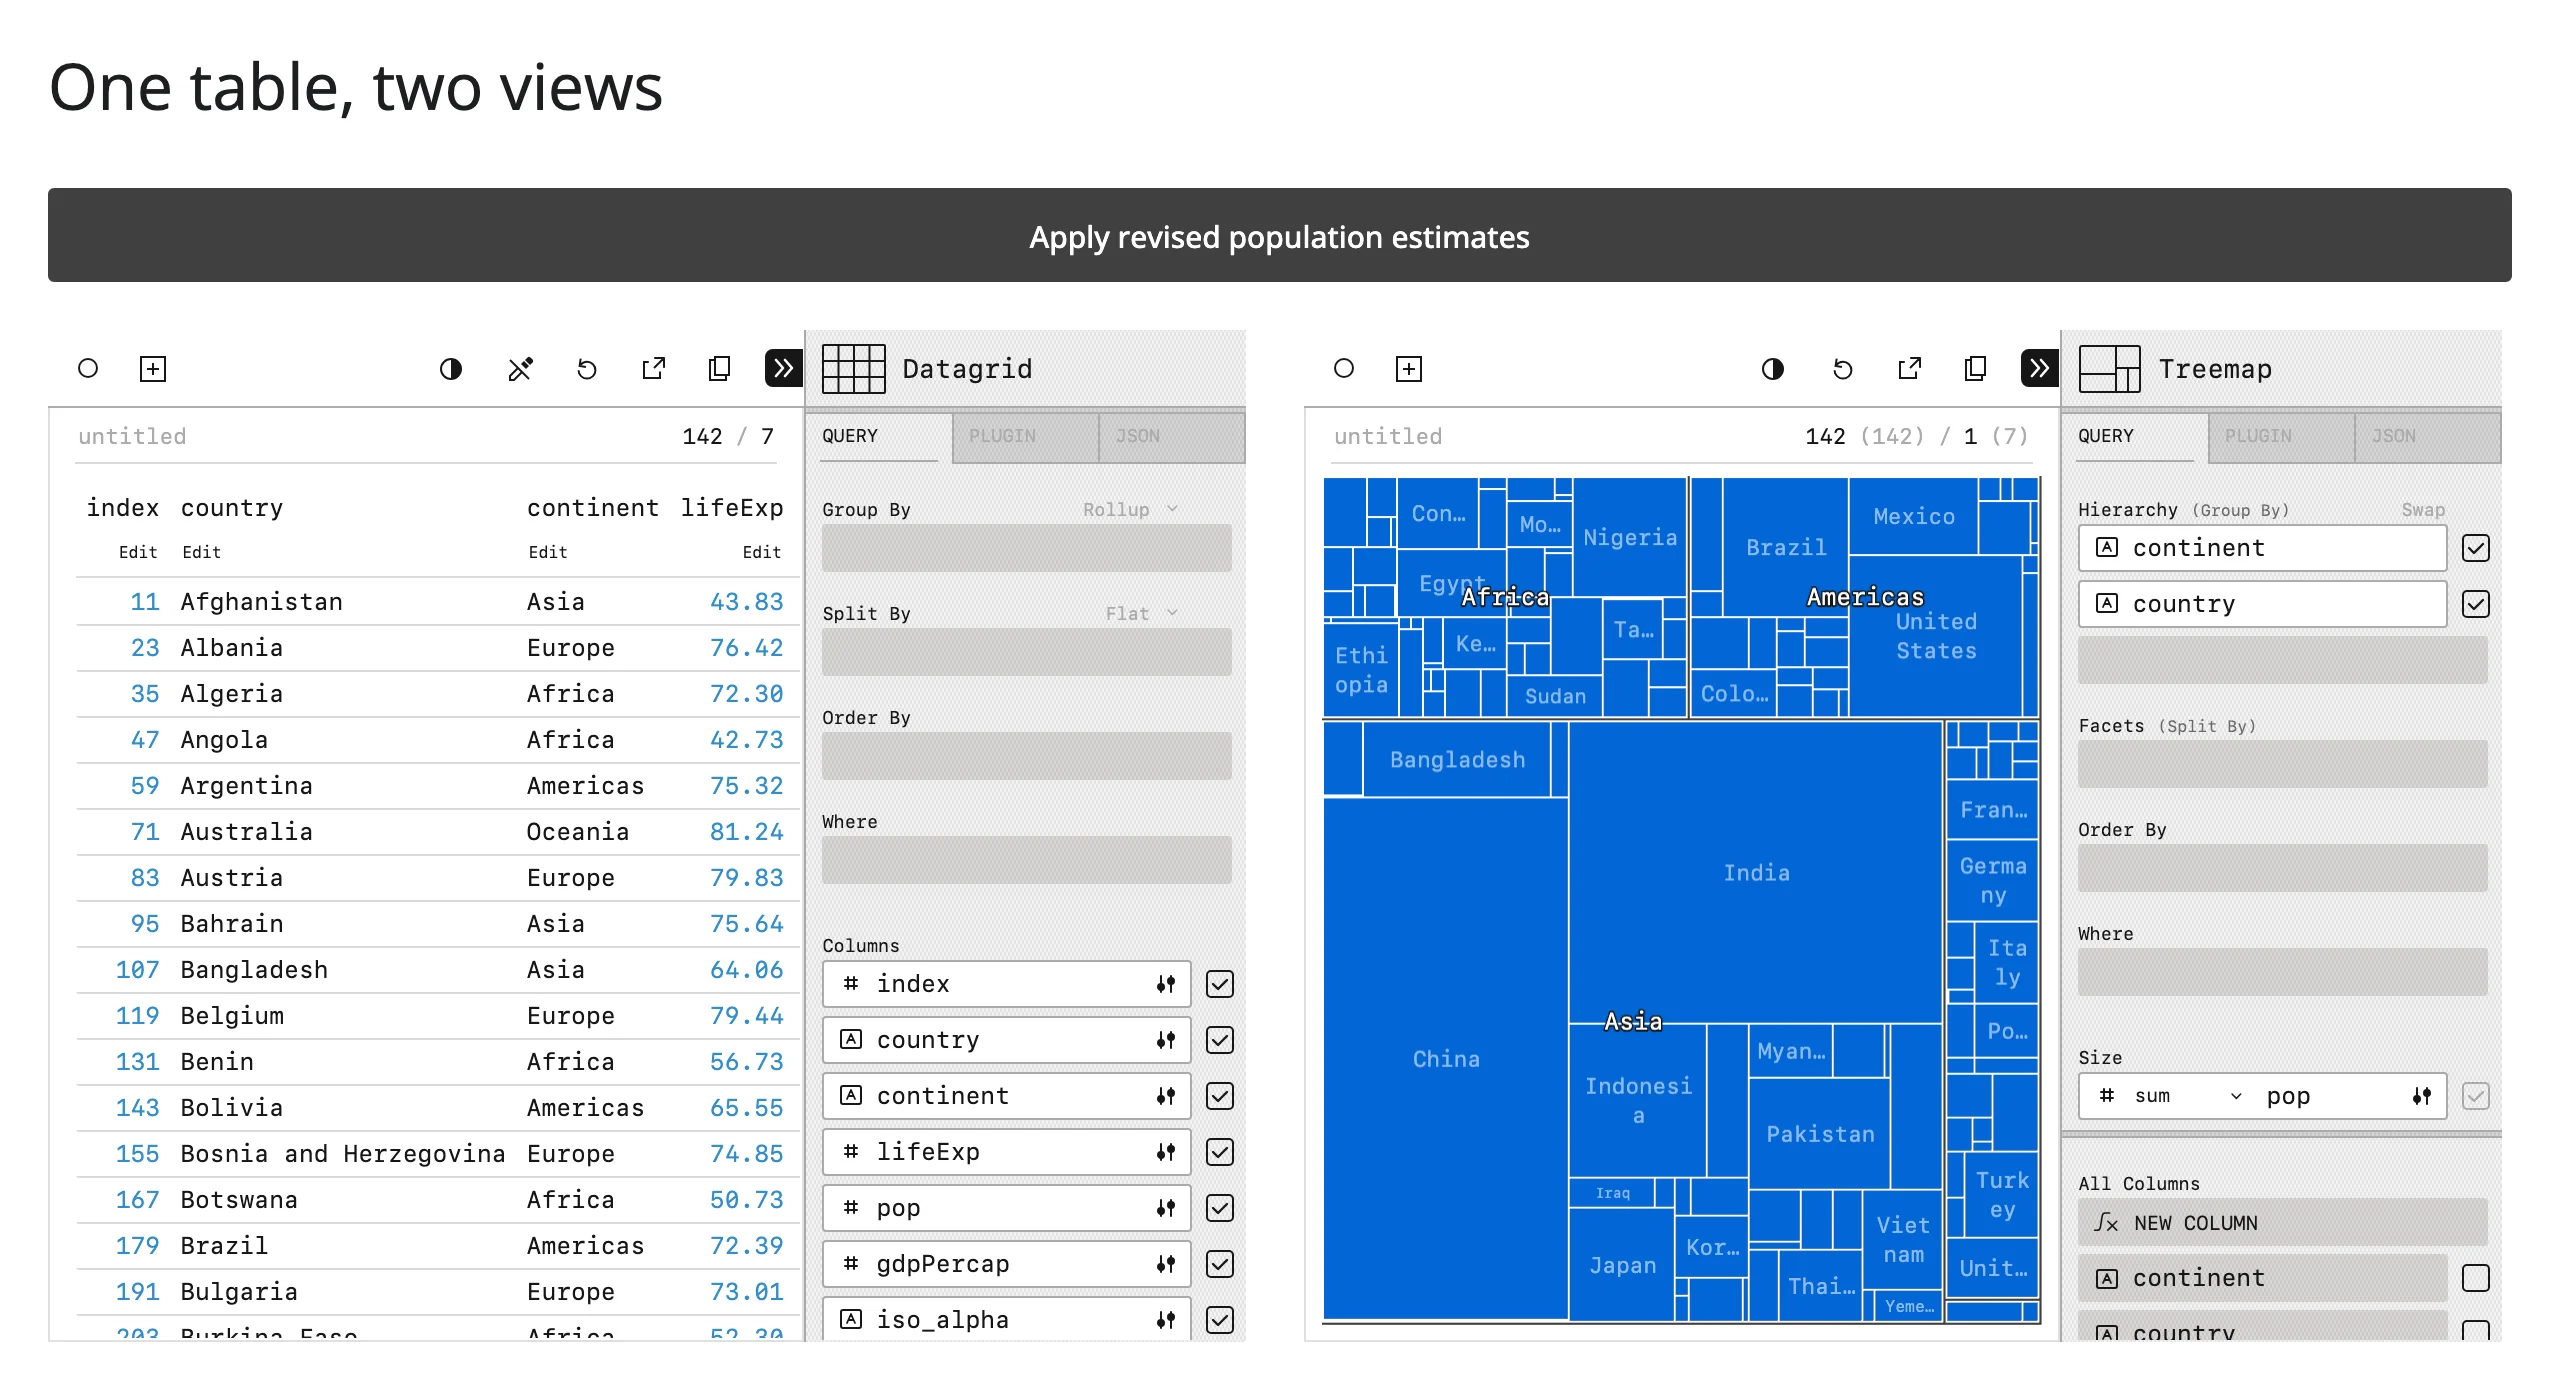
Clicking “Apply revised population estimates” updates China/India/Nigeria’s figures once; reading the table through the treemap’s own connection immediately shows China’s revised number, confirming the two viewers share one table, not just the same starting data:
Saving and restoring a view
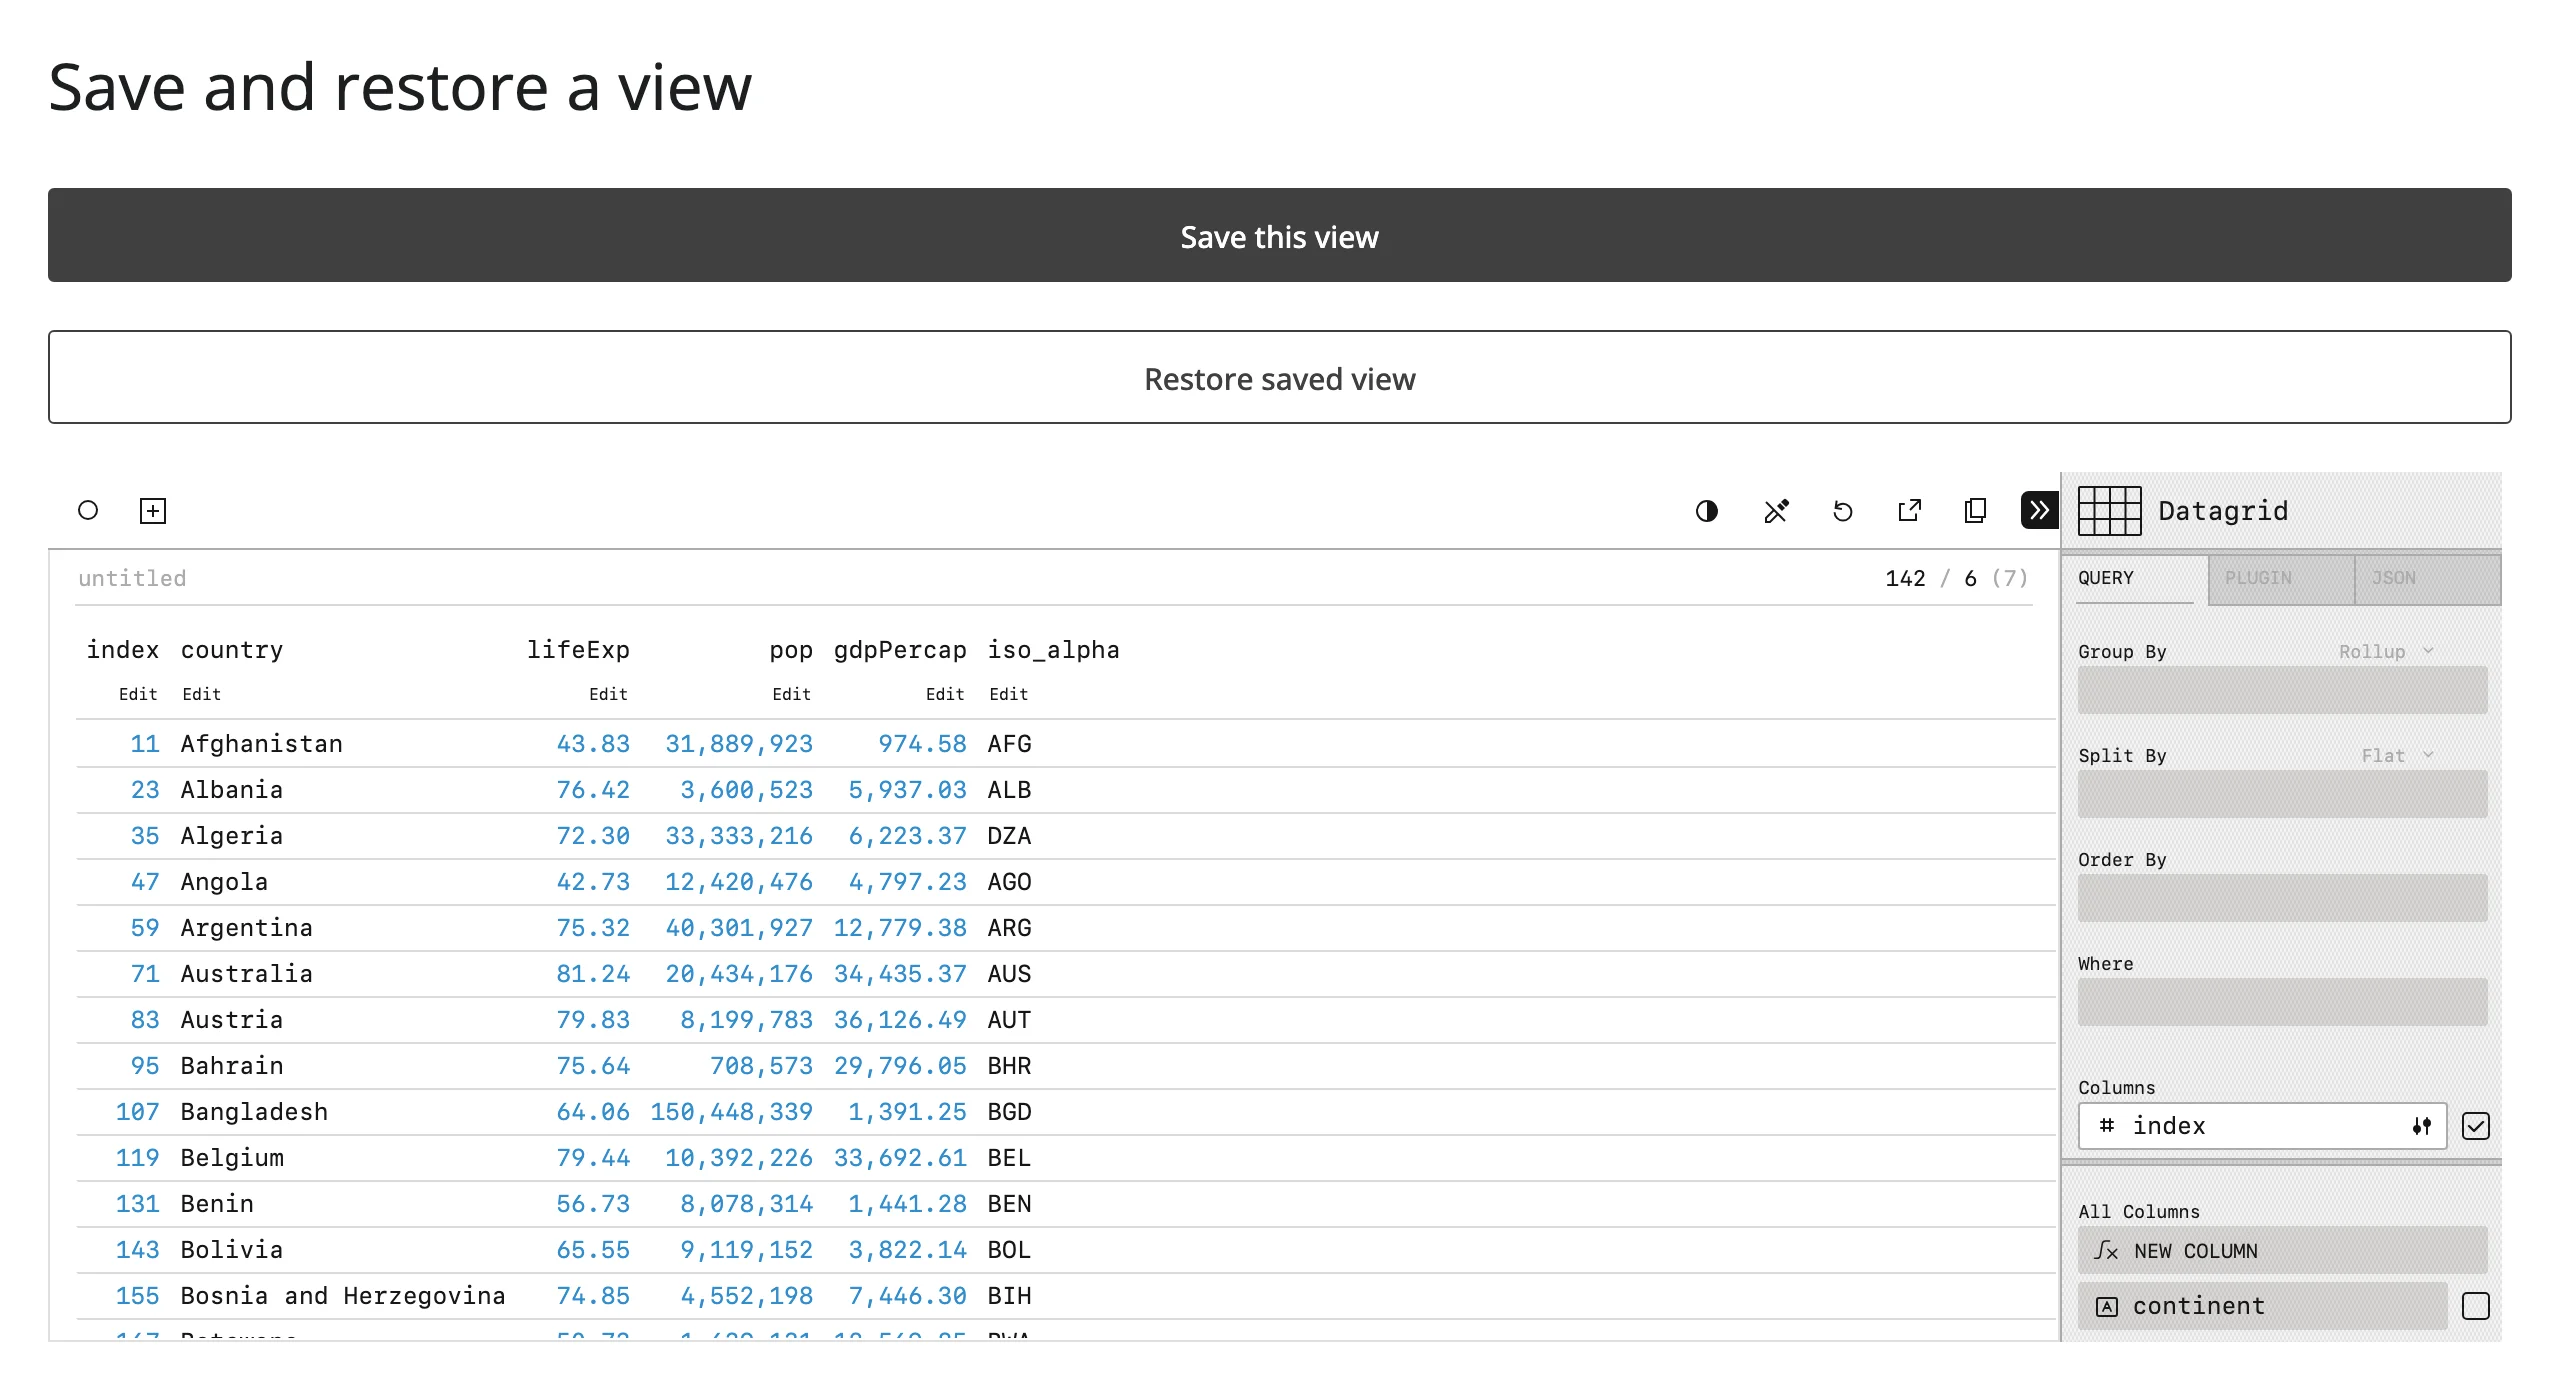
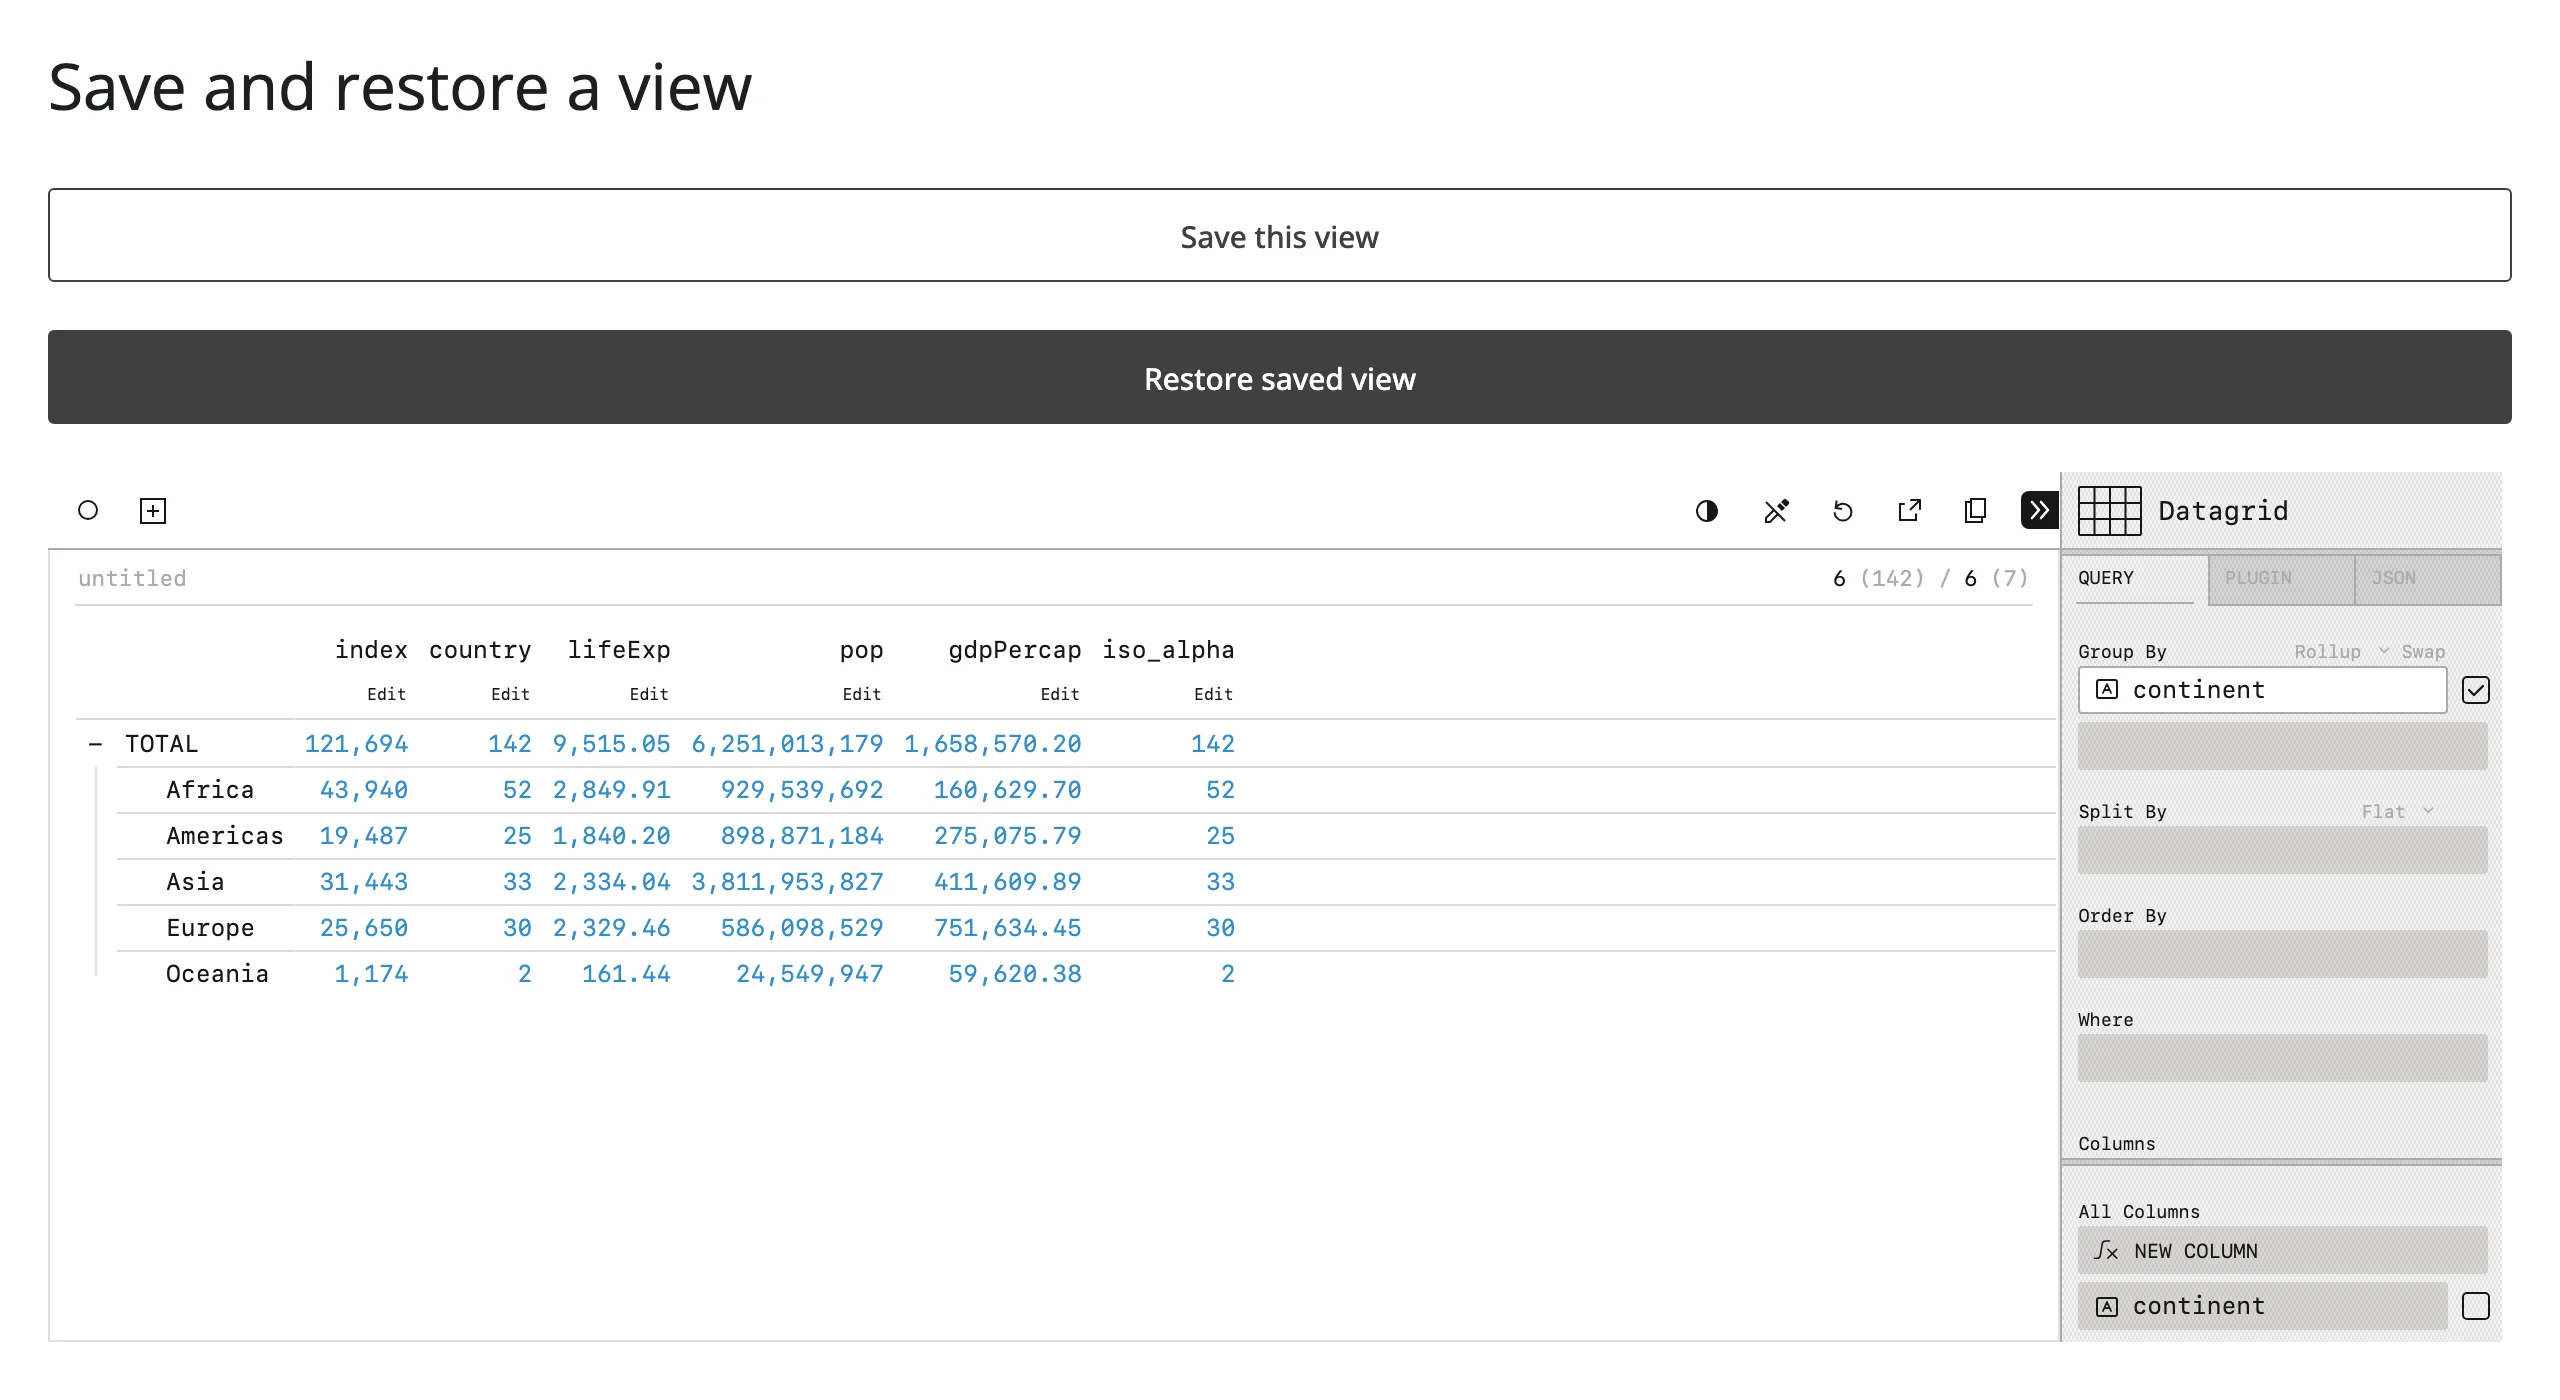
PerspectiveWidget.save() captures the entire config – pivot, sort, filter, plugin, theme, columns_config, everything – as a plain dict; restore(**cfg) puts it back. Unlike view_config(), this round-trip includes the cosmetic keys, so it’s the right tool for a “save my view” / “load my view” feature rather than for driving a computation.
from __future__ import annotations

from typing import Any, Dict, Optional

import plotly.express as px
from shiny import reactive
from shiny.express import input, ui
from shinywidgets import render_perspective

ui.page_opts(title="Save and restore a view", fillable=True)
ui.input_action_button("save", "Save this view")
ui.input_action_button("restore", "Restore saved view")

countries = px.data.gapminder().query("year == 2007").drop(columns=["year", "iso_num"])

saved_view: reactive.Value[Optional[Dict[str, Any]]] = reactive.value(None)


@render_perspective
def grid():
    return countries


@reactive.effect
@reactive.event(input.save)
def _():
    # .widget.save() captures the full viewer config -- pivot, sort, filter,
    # plugin, theme, columns_config, everything -- as a plain dict. Store it
    # anywhere: a reactive.value, a file, a database row.
    saved_view.set(grid.widget.save())


@reactive.effect
@reactive.event(input.restore)
def _():
    cfg = saved_view.get()
    if cfg is not None:
        grid.widget.restore(**cfg)
Pivoting by continent, saving, resetting back to a flat grid, then clicking “Restore saved view” returns exactly the saved pivot:
A Perspective filter driving a plotly chart (pairs with: plotly)
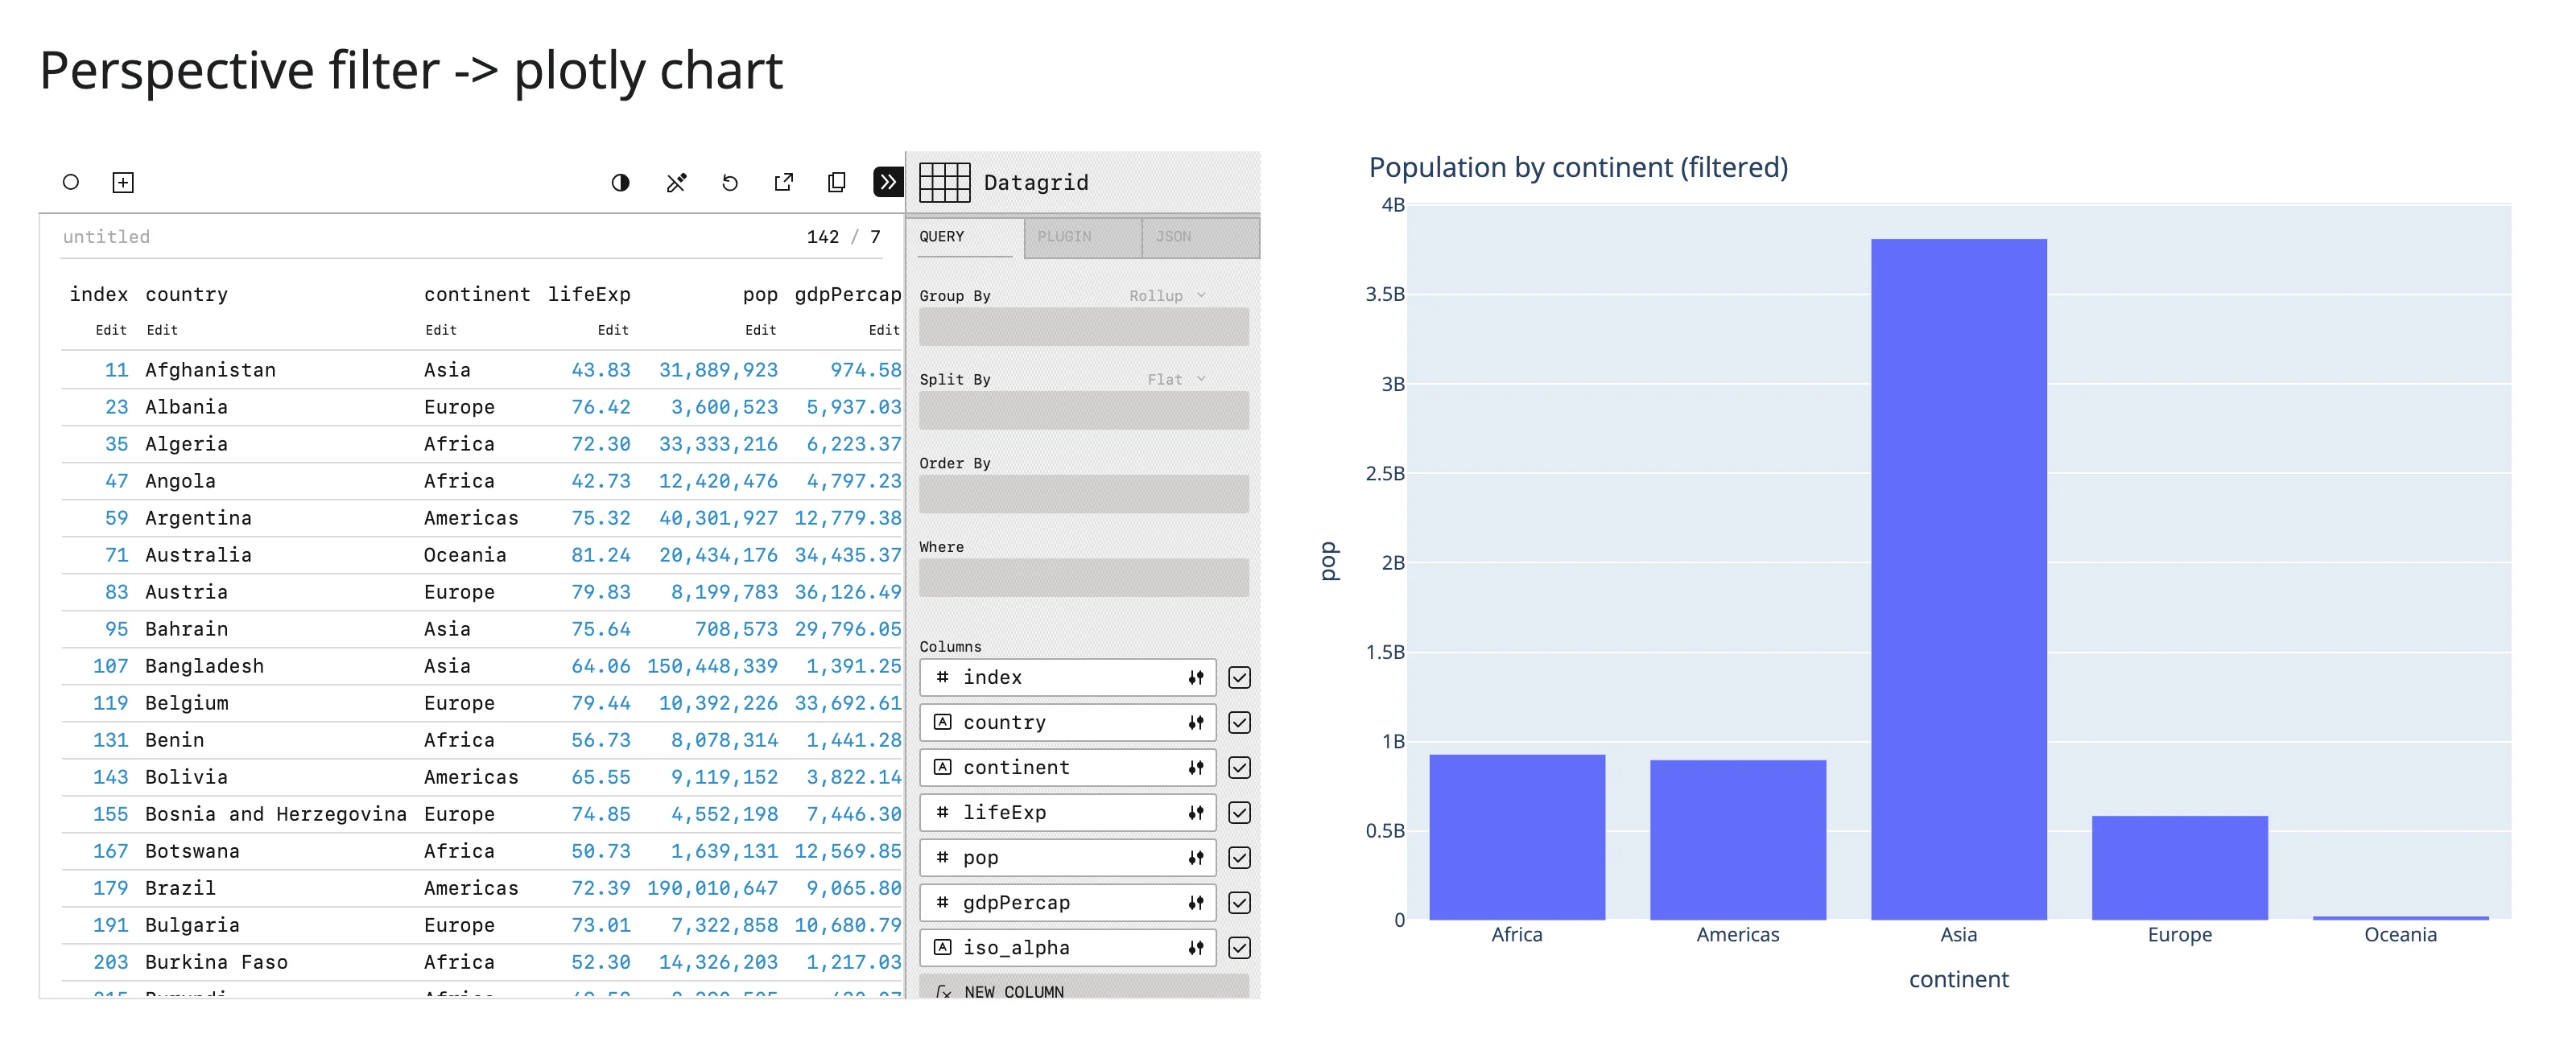
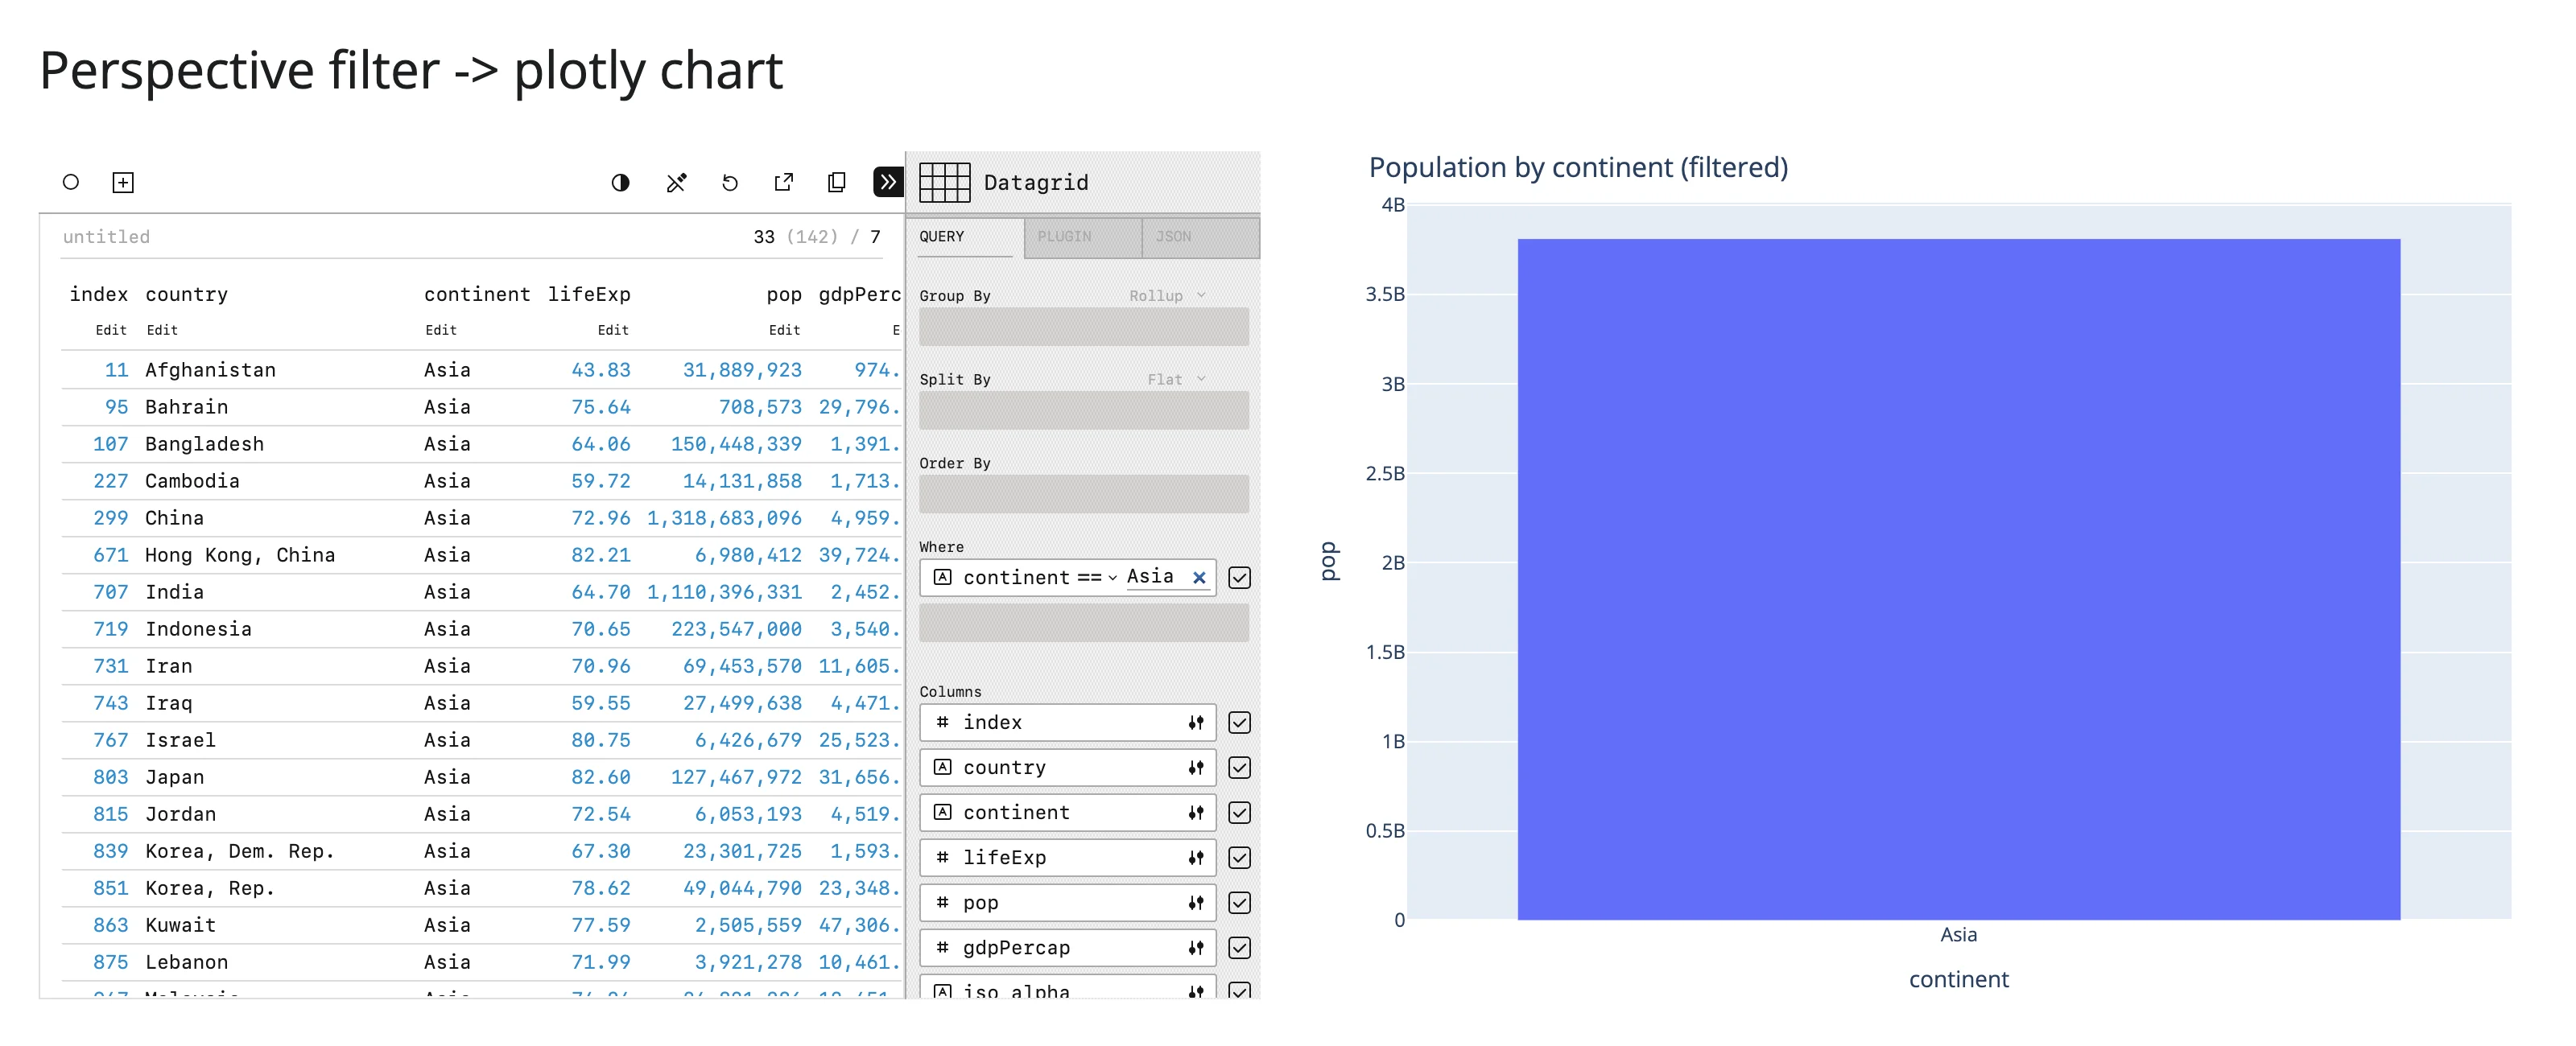
view_config()/filter() aren’t limited to driving other Perspective views – replay them against the table from any other output. Here a plotly bar chart re-aggregates exactly the rows the user’s filter leaves visible in the grid.
from __future__ import annotations

import pandas as pd
import plotly.express as px
from shiny.express import ui
from shinywidgets import render_perspective, render_plotly

ui.page_opts(title="Perspective filter -> plotly chart", fillable=True)

countries = px.data.gapminder().query("year == 2007").drop(columns=["year", "iso_num"])

with ui.layout_columns():

    @render_perspective
    def grid():
        return countries

    @render_plotly
    def chart():
        # Replay the user's filter (set in the viewer's settings panel)
        # server-side and chart exactly those rows by continent. Drop
        # "group_by": the raw rows are re-aggregated here in pandas instead.
        cfg = {
            k: v
            for k, v in grid.view_config().items()
            if k not in ("plugin", "group_by")
        }
        view = grid.widget.table.view(**cfg)
        cols = view.to_columns()
        view.delete()
        df = pd.DataFrame({"continent": cols["continent"], "pop": cols["pop"]})
        totals = df.groupby("continent", as_index=False)["pop"].sum()
        return px.bar(
            totals, x="continent", y="pop", title="Population by continent (filtered)"
        )
Filtering the grid to Asia updates the plotly chart to a single bar at Asia’s 2007 population (~3.8 billion):
Large data
Perspective’s whole design is built for this: your DataFrame crosses the wire once, as Arrow (not JSON), into the browser’s own WebAssembly query engine; every pivot, filter, and group-by after that runs instantly client-side with no further round trip. table.update() (see “Streaming updates” above) pushes only new rows for a live feed, not a full resend. We didn’t measure a specific row ceiling this pass; Perspective’s own docs describe multi-million row datasets as the normal case for its WASM engine. It’s a loose fit for “only send what’s visible” (the view you interact with is cheap because it’s local, not because less data was shipped) – see Large data & performance for the three approaches this roster uses.
Layout and sizing
Perspective fills its container out of the box; a ui.card(full_screen=True, height=...) or an explicit output_widget(height=...) both work with no extra configuration. The viewer sits a few pixels inside its container (Perspective’s own padding), which is visible at small sizes but not worth fighting.
from __future__ import annotations

import plotly.express as px
from shiny.express import ui
from shinywidgets import render_perspective

ui.page_opts(title="Layout and sizing", fillable=True)

countries = px.data.gapminder().query("year == 2007").drop(columns=["year", "iso_num"])

with ui.card(full_screen=True, height="400px"):

    @render_perspective
    def grid():
        return countries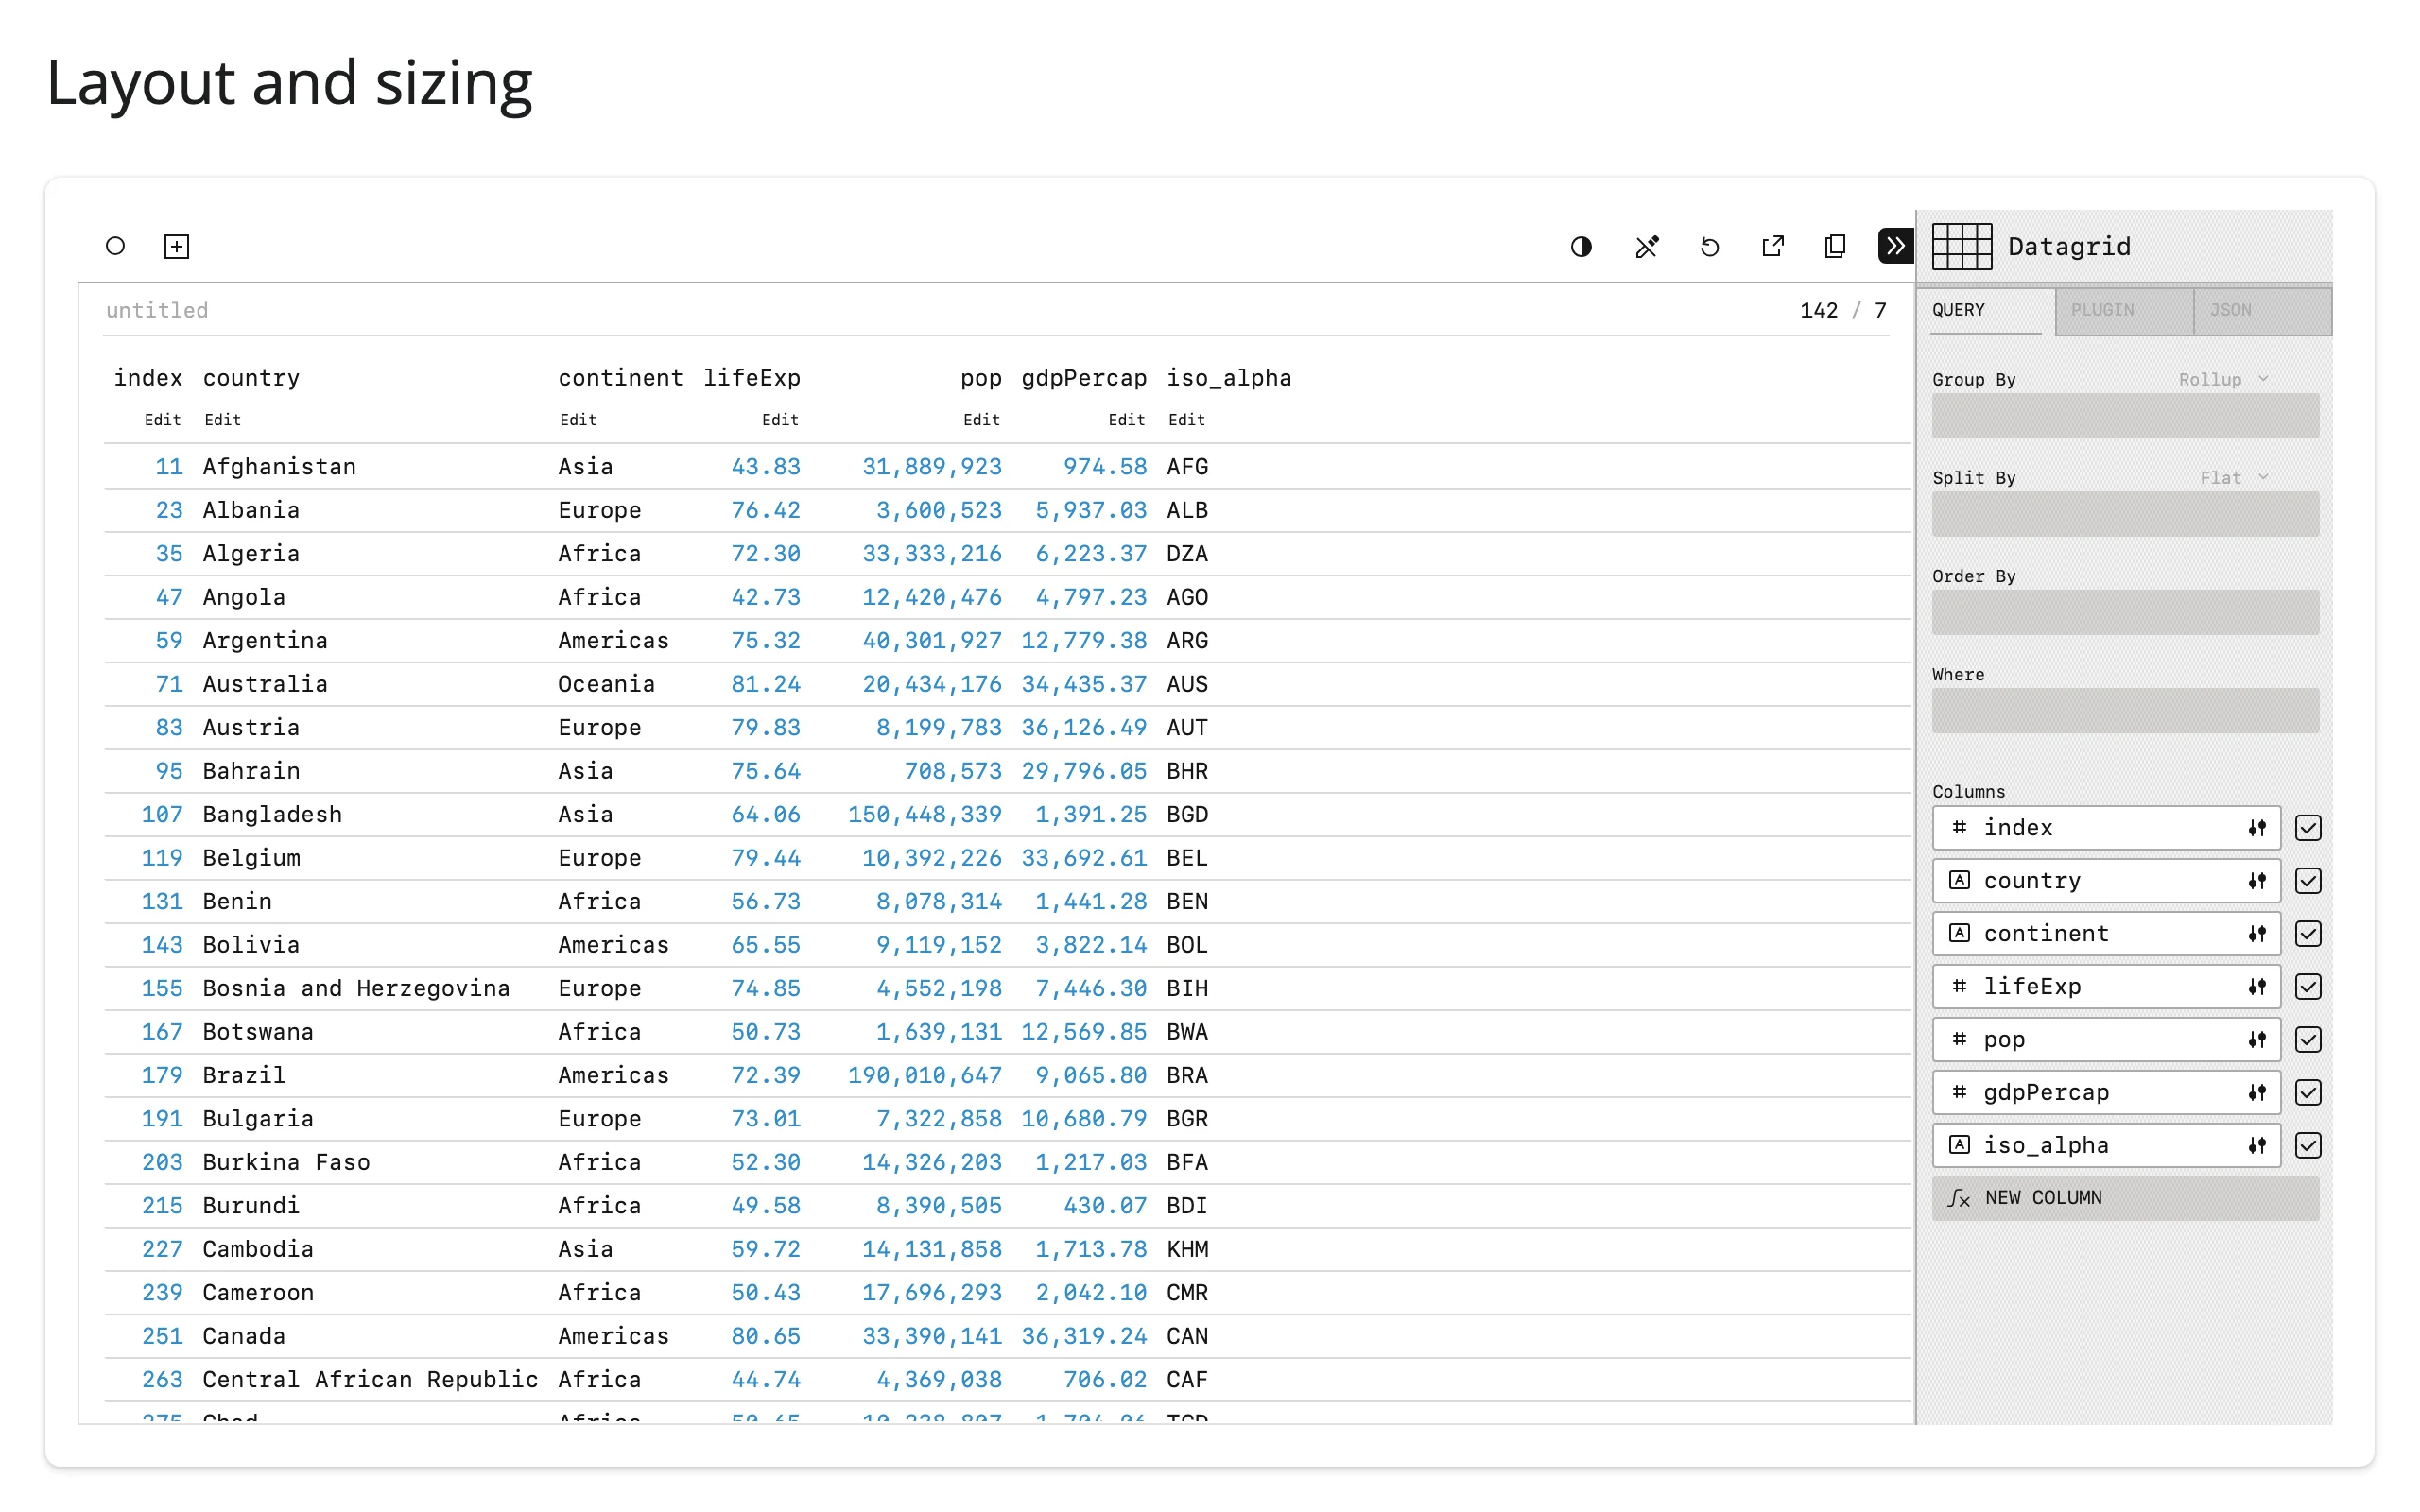
Gotchas and limitations
- A pandas index becomes a visible
"index"column. Every DataFrame coerced to a table gets anindexcolumn (even for a defaultRangeIndex), and it shows up in the grid and, if you don’t restrictcolumns=, as a spurious numeric series in bar/treemap/etc. plugins (its sum or size has no meaning). Passcolumns=[...]naming only the columns you want, or build the table from a DataFrame withpreserve_index=Falsevia pyarrow. Polars DataFrames don’t have this problem. - Grouped views include a grand-total row.
table.view(group_by=[...])returns a first row with__ROW_PATH__ == []holding the total across every group. Summing every row into_columns()double-counts it – read that first row directly for a grand total, or skip it when you want per-group values only. Seeexamples/10_linked_filtered_summary.pyfor the check ("__ROW_PATH__" in cols). .widget.replace()doesn’t accept a DataFrame (upstream, perspective-python 5.6, reproduced on current main).table.replace(df)raisesValueError: Unknown input type ...for pandas, polars, and pyarrow; only records, a dict of columns, or Arrow IPC bytes work. Use.widget.clear()followed by.widget.update(df)to swap out all rows instead.grid.read("theme")(orreactive_read(widget, "theme")) can readNoneimmediately after render (verified). The trait has no value until the browser’s first sync; the two accessors don’t have this problem because they seed synchronously at attach. If you read a cosmetic trait at startup (rather than through an accessor), handleNone.- Setting
columns_configfrom Python replaces it outright; restoring it from the browser merges per column (verified).widget.columns_config = {...}overwrites the whole dict. But a user editing column formatting through the settings panel merges their change into the existing dict column-by-column, and there’s no way to remove a column’s config that way –restore(columns_config={})does nothing if a column already has settings. Reset a column’s styling by setting it to an explicit new value, not an empty dict. - The settings panel’s filter value field is a combobox, not a free-text field. Typing a value that matches an existing category and pressing Enter commits whichever option the combobox highlights, which may not be the text you typed; typing something that matches nothing commits that literal text (and matches zero rows). If you’re scripting a filter from the browser (tests, demos), setting it via
el.restore({filter: [...]})is more predictable than typing into the UI. - The settings panel opens by default. DataFrame- and Table-coerced widgets both default to
settings=True, which can cover most of a small card. Passsettings=Falseto thePerspectiveWidgetconstructor if you want it to start closed. - Perspective’s own memory/leak behavior is unchanged by shinywidgets and out of scope here. Hosting tables and views for the life of a process is an upstream characteristic, not something the current renderer changed. If your app renders many large per-session tables over a long-running server process, budget for it independently of anything in this guide.
Gallery candidates
template_live_feed.py (template)
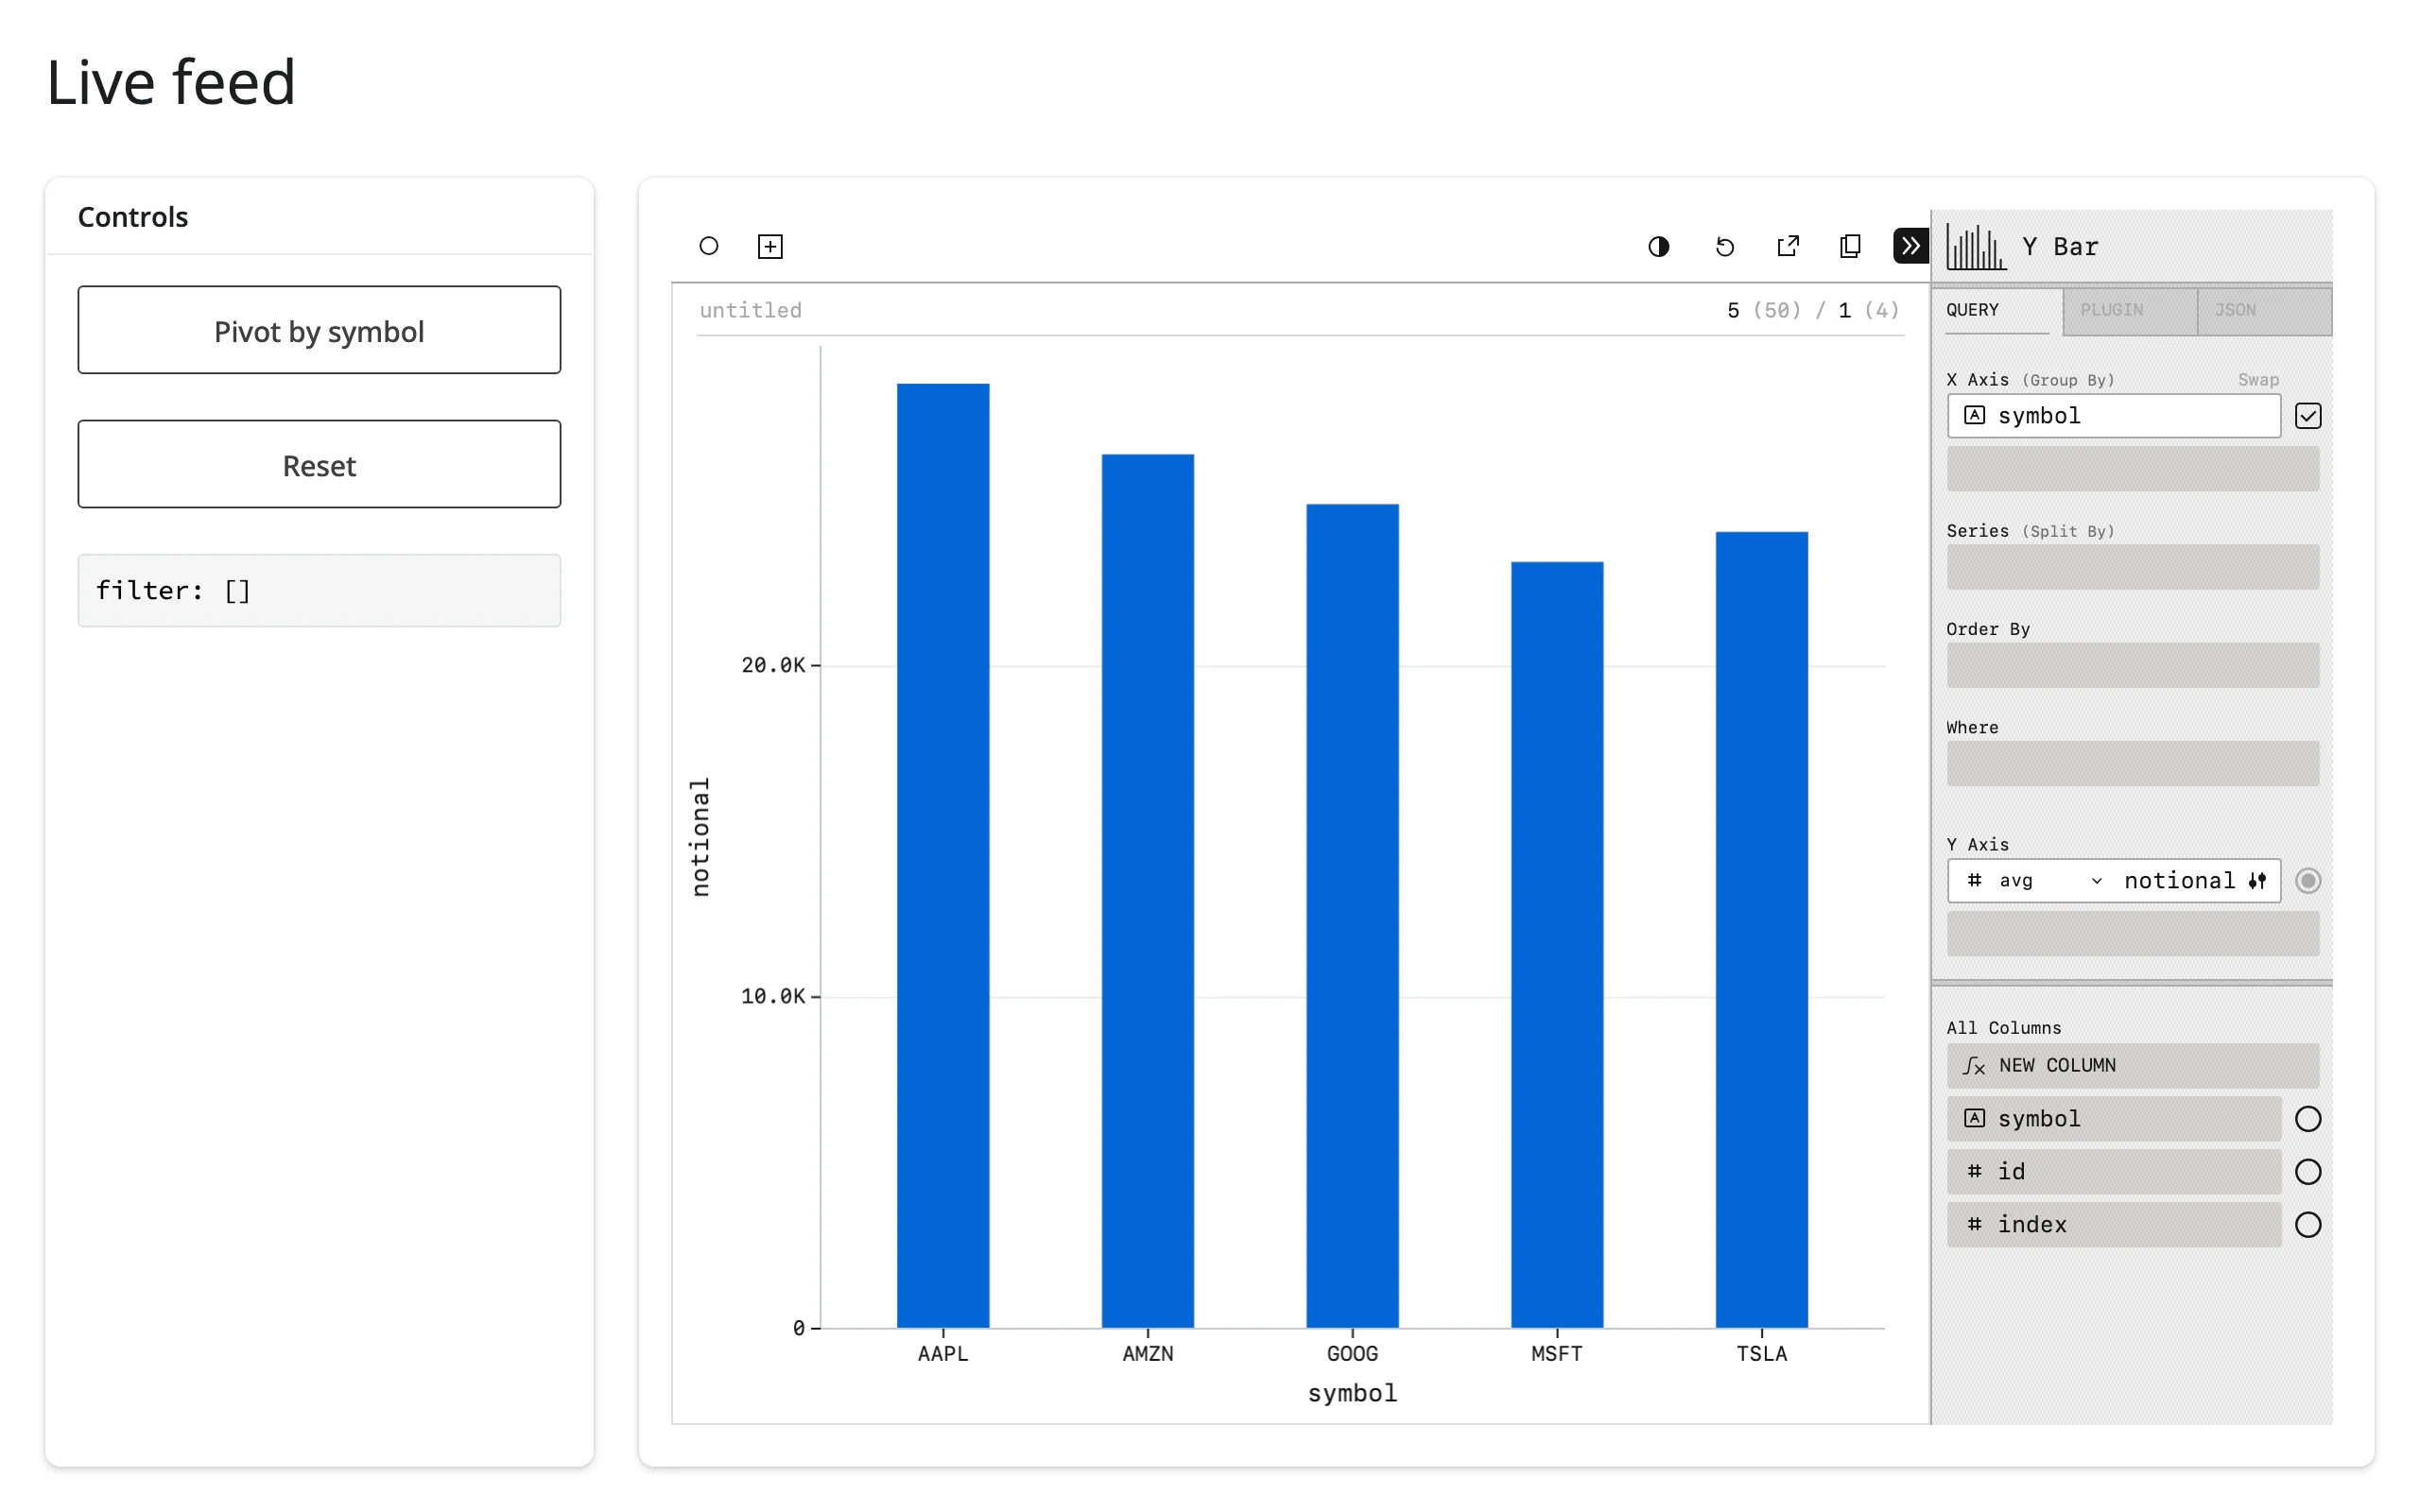
A streaming grid of five recognizable tickers with two one-click presets (pivot / reset) and a live filter() readout – a minimal starting point for a “rows arrive continuously, the user pivots or filters them” app.
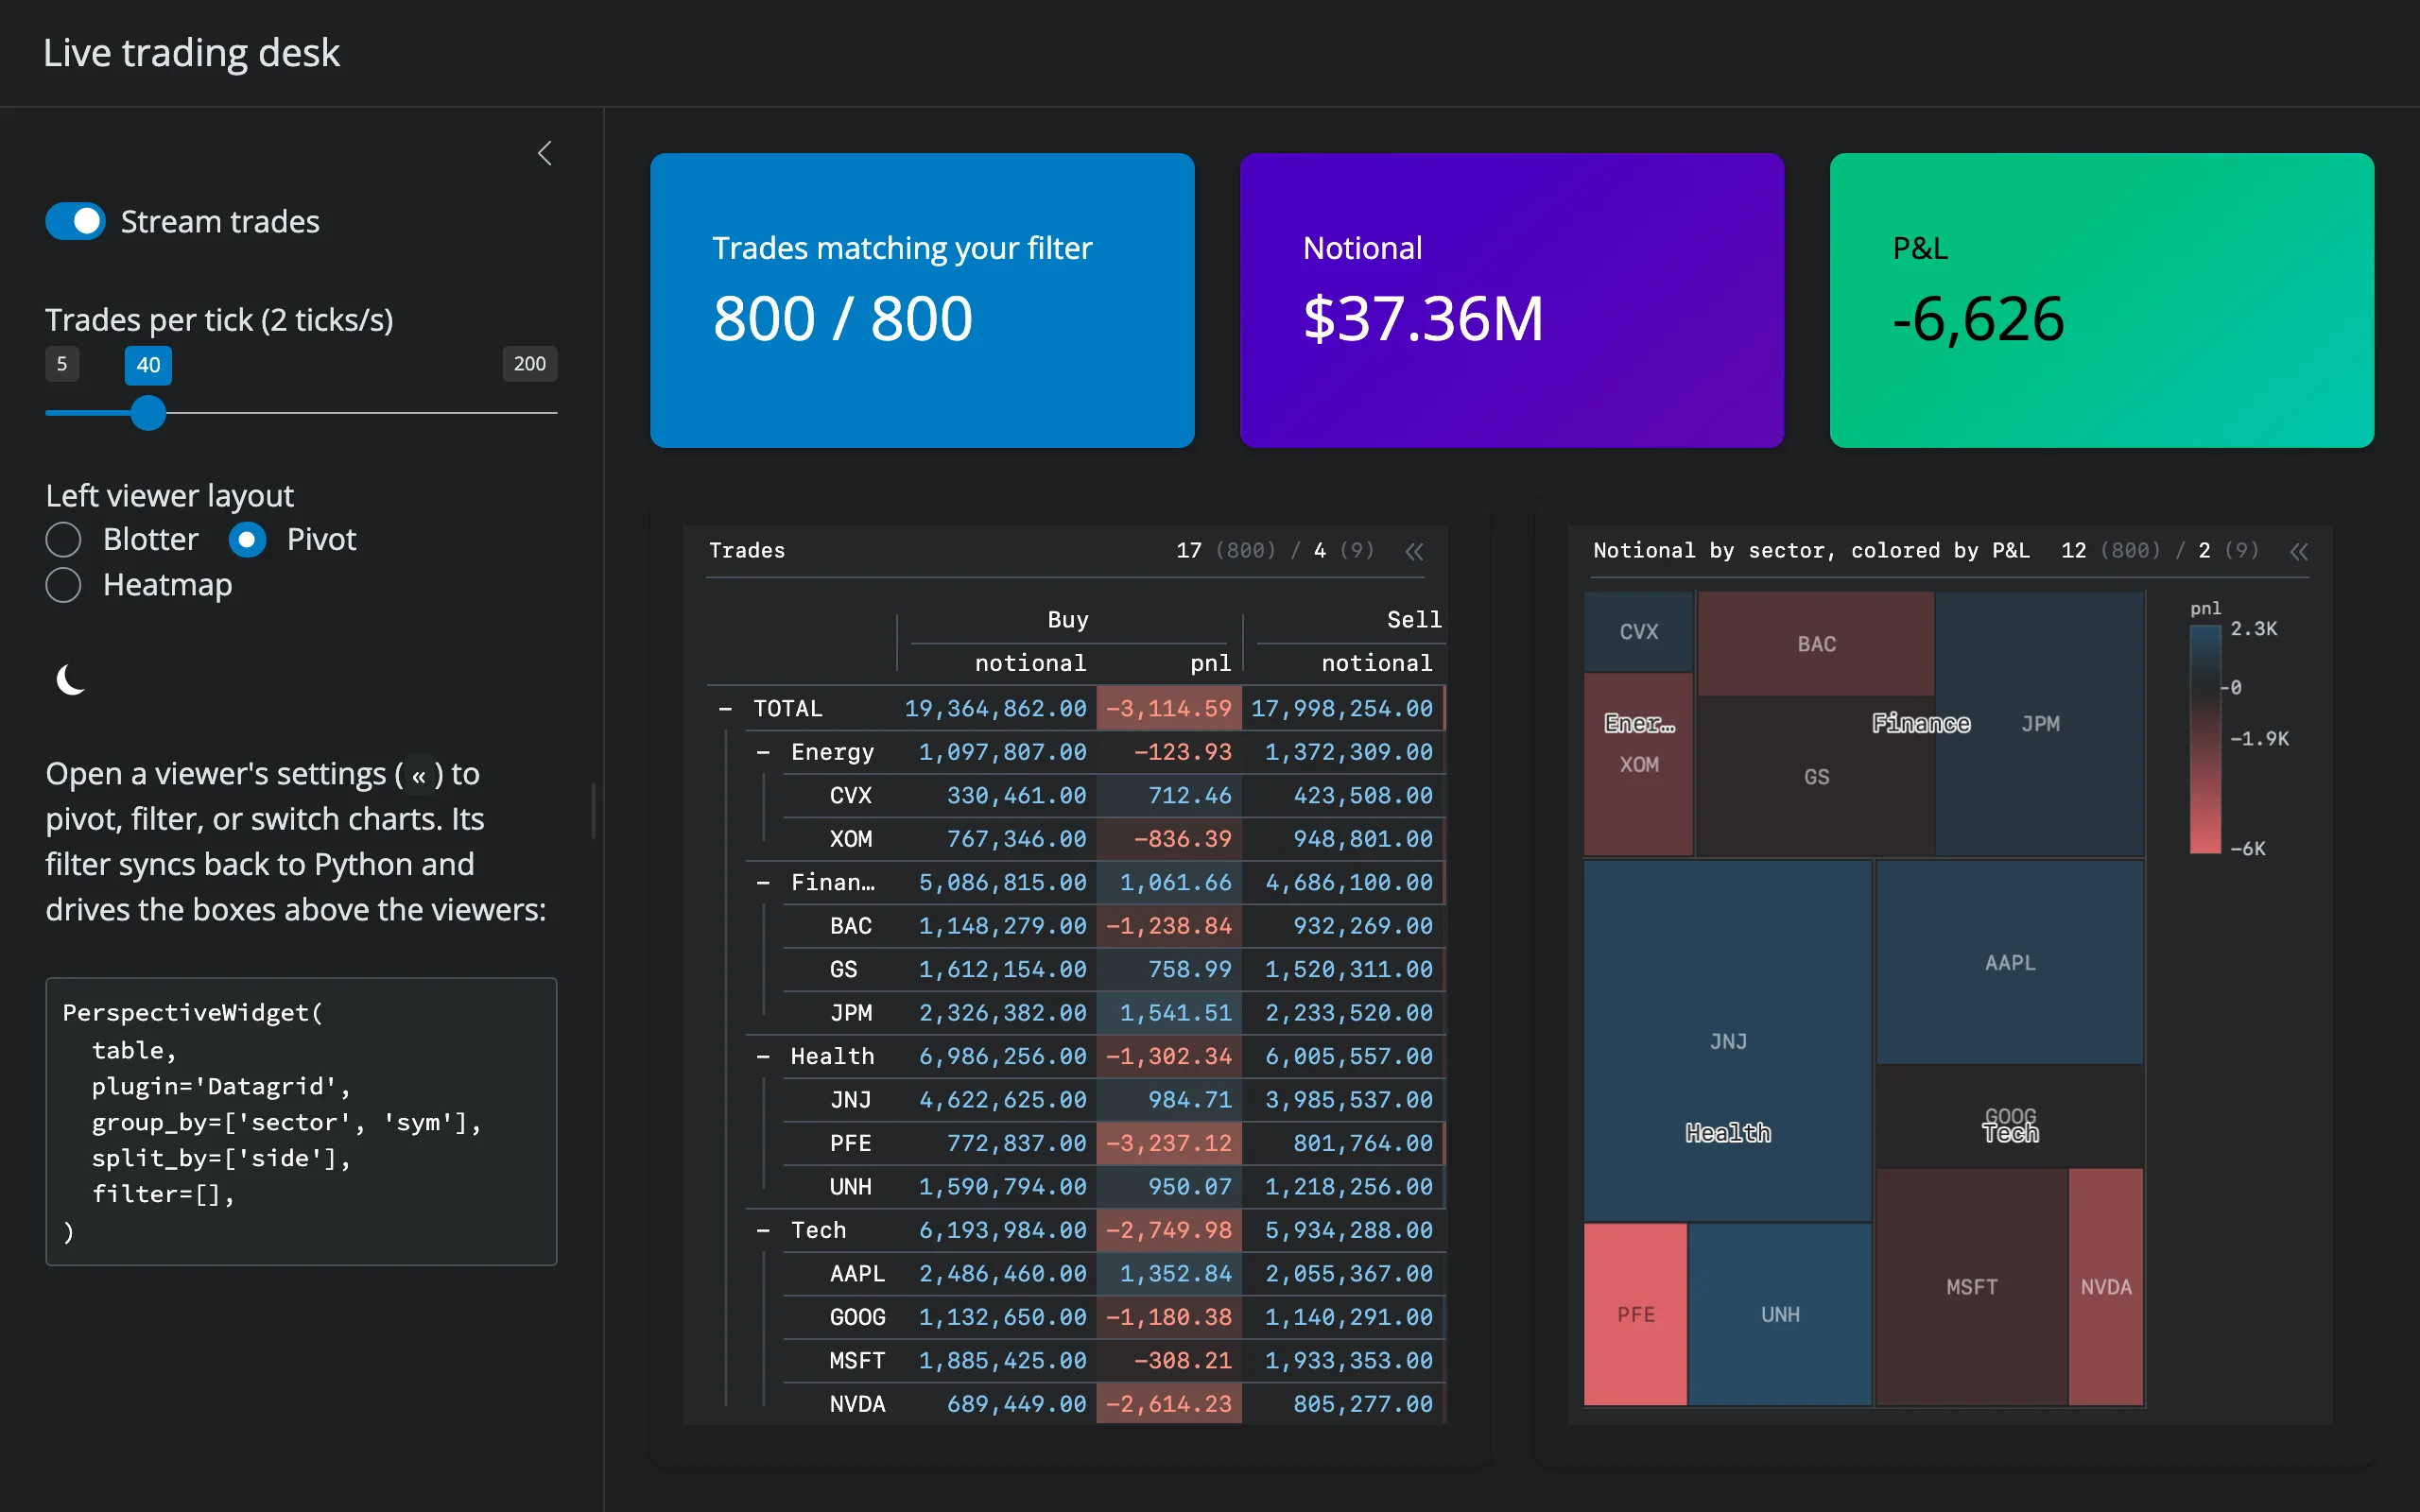
showcase_trading_desk.py (showcase)
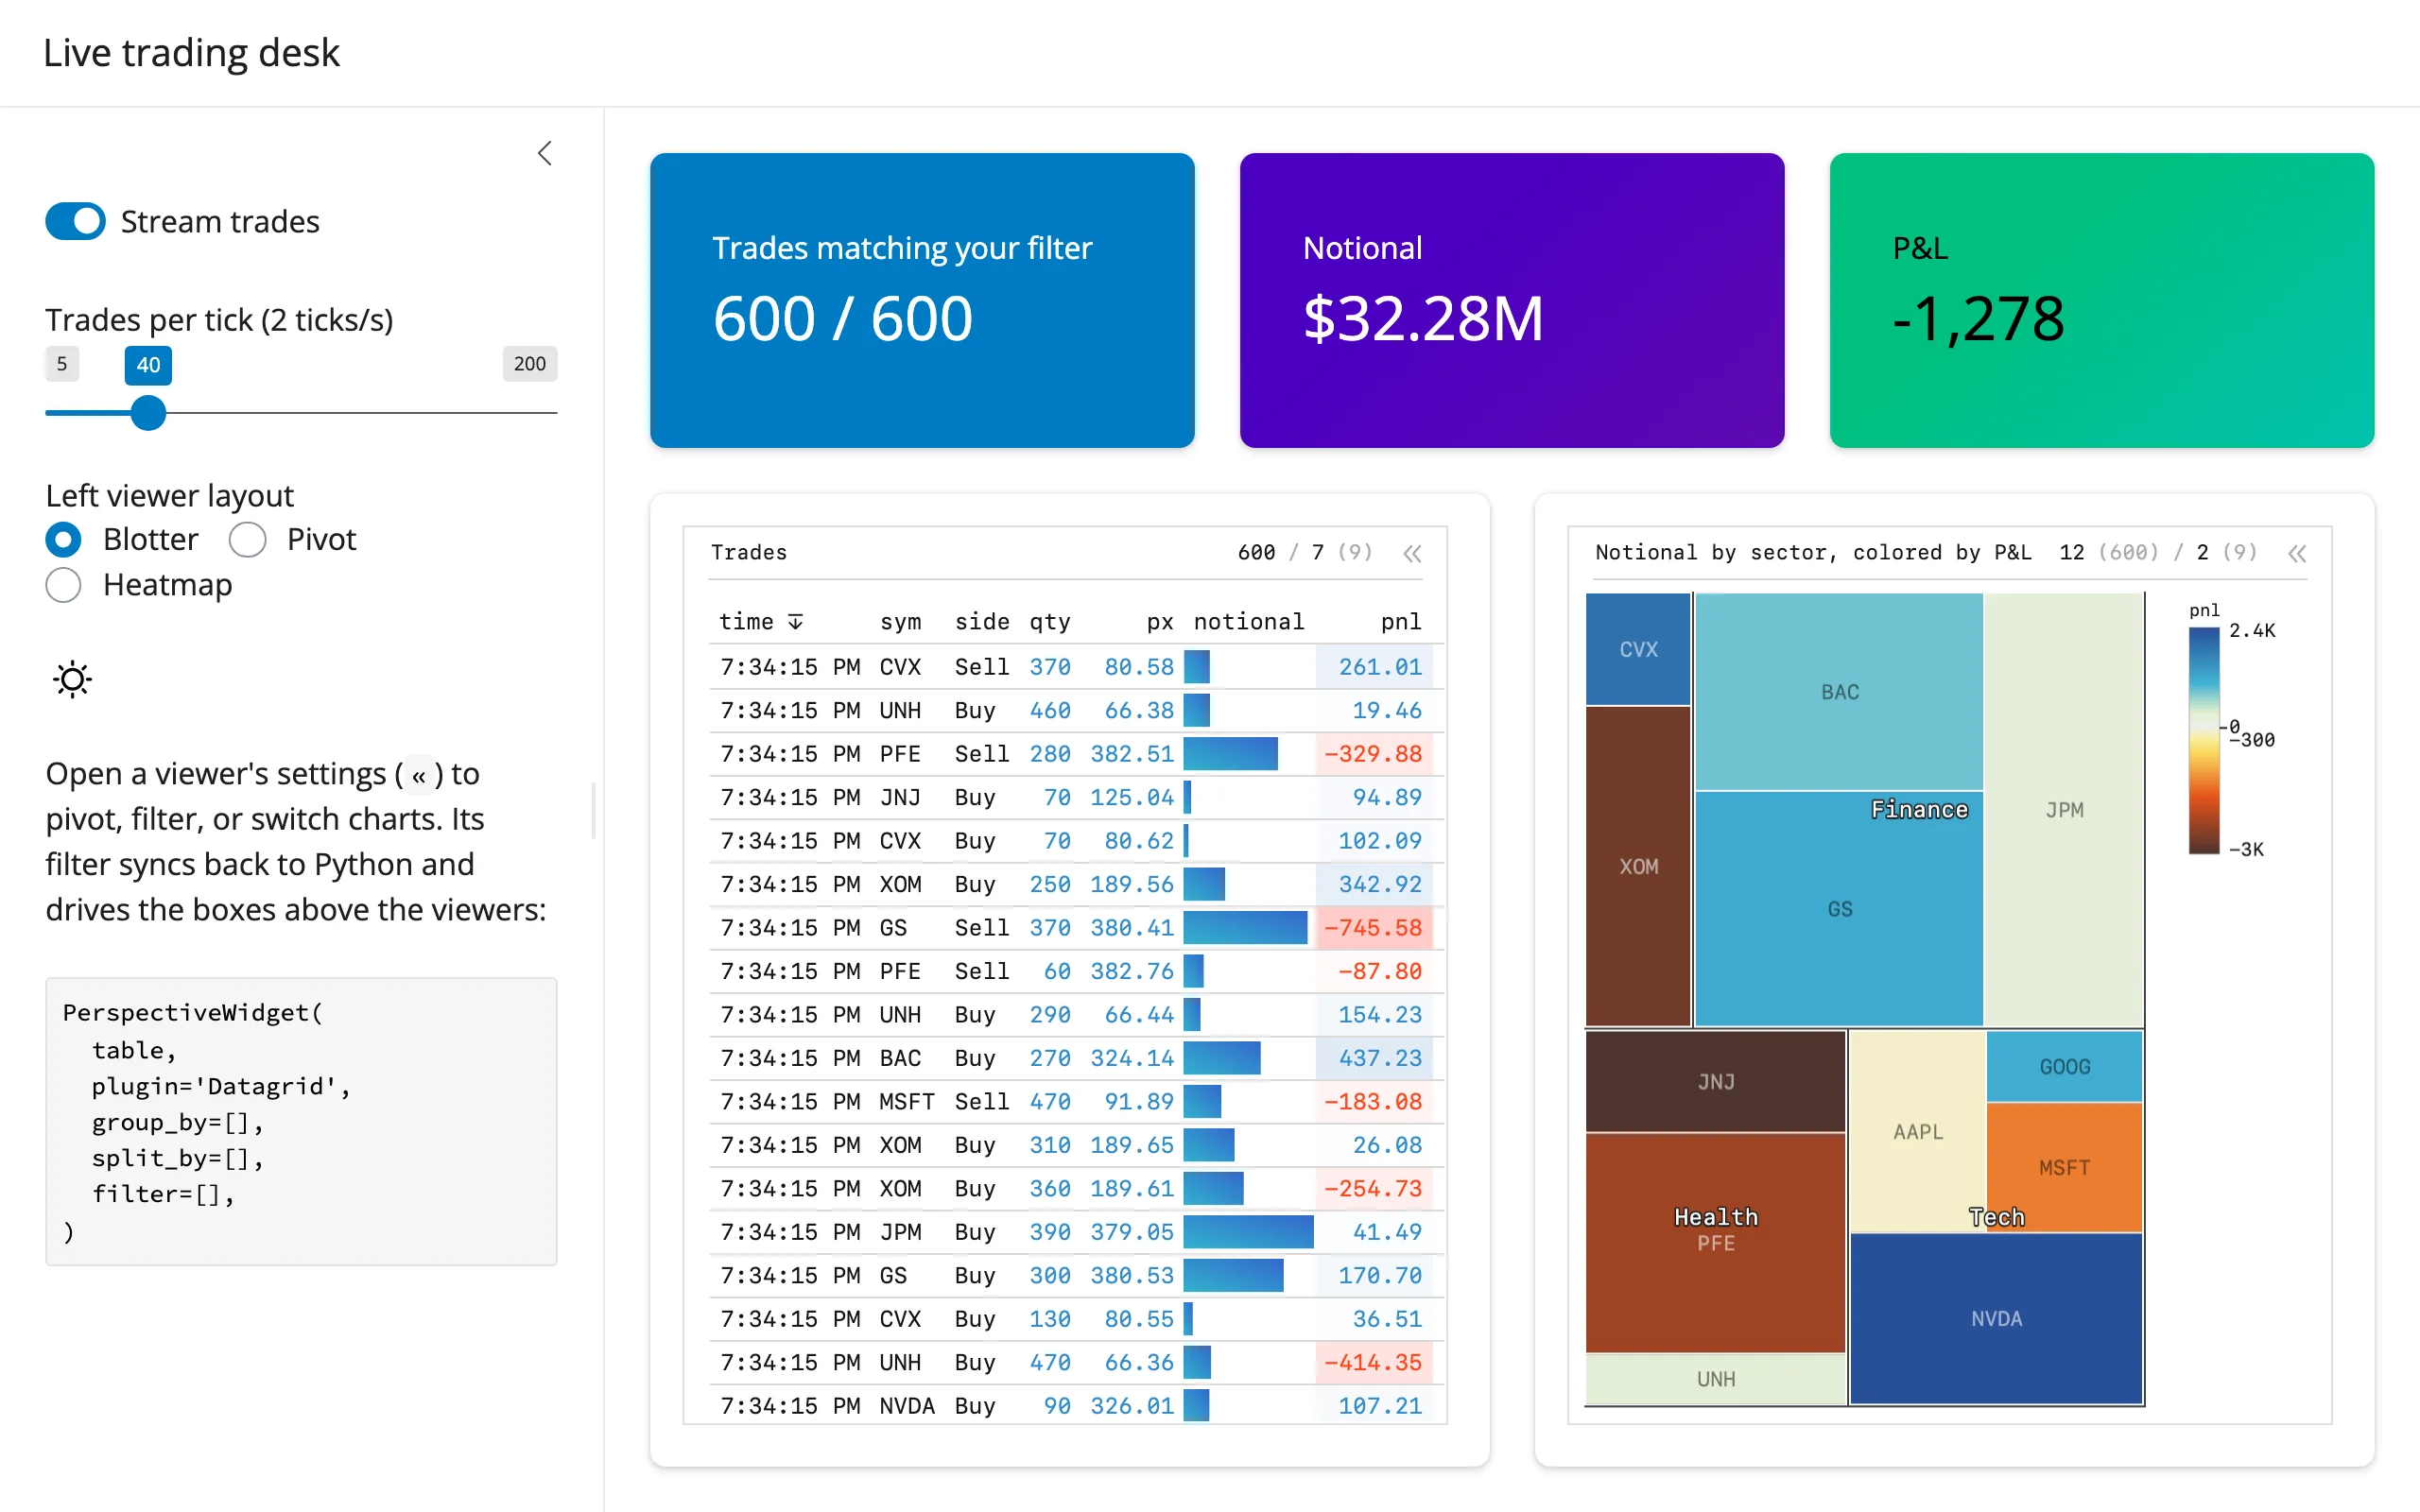
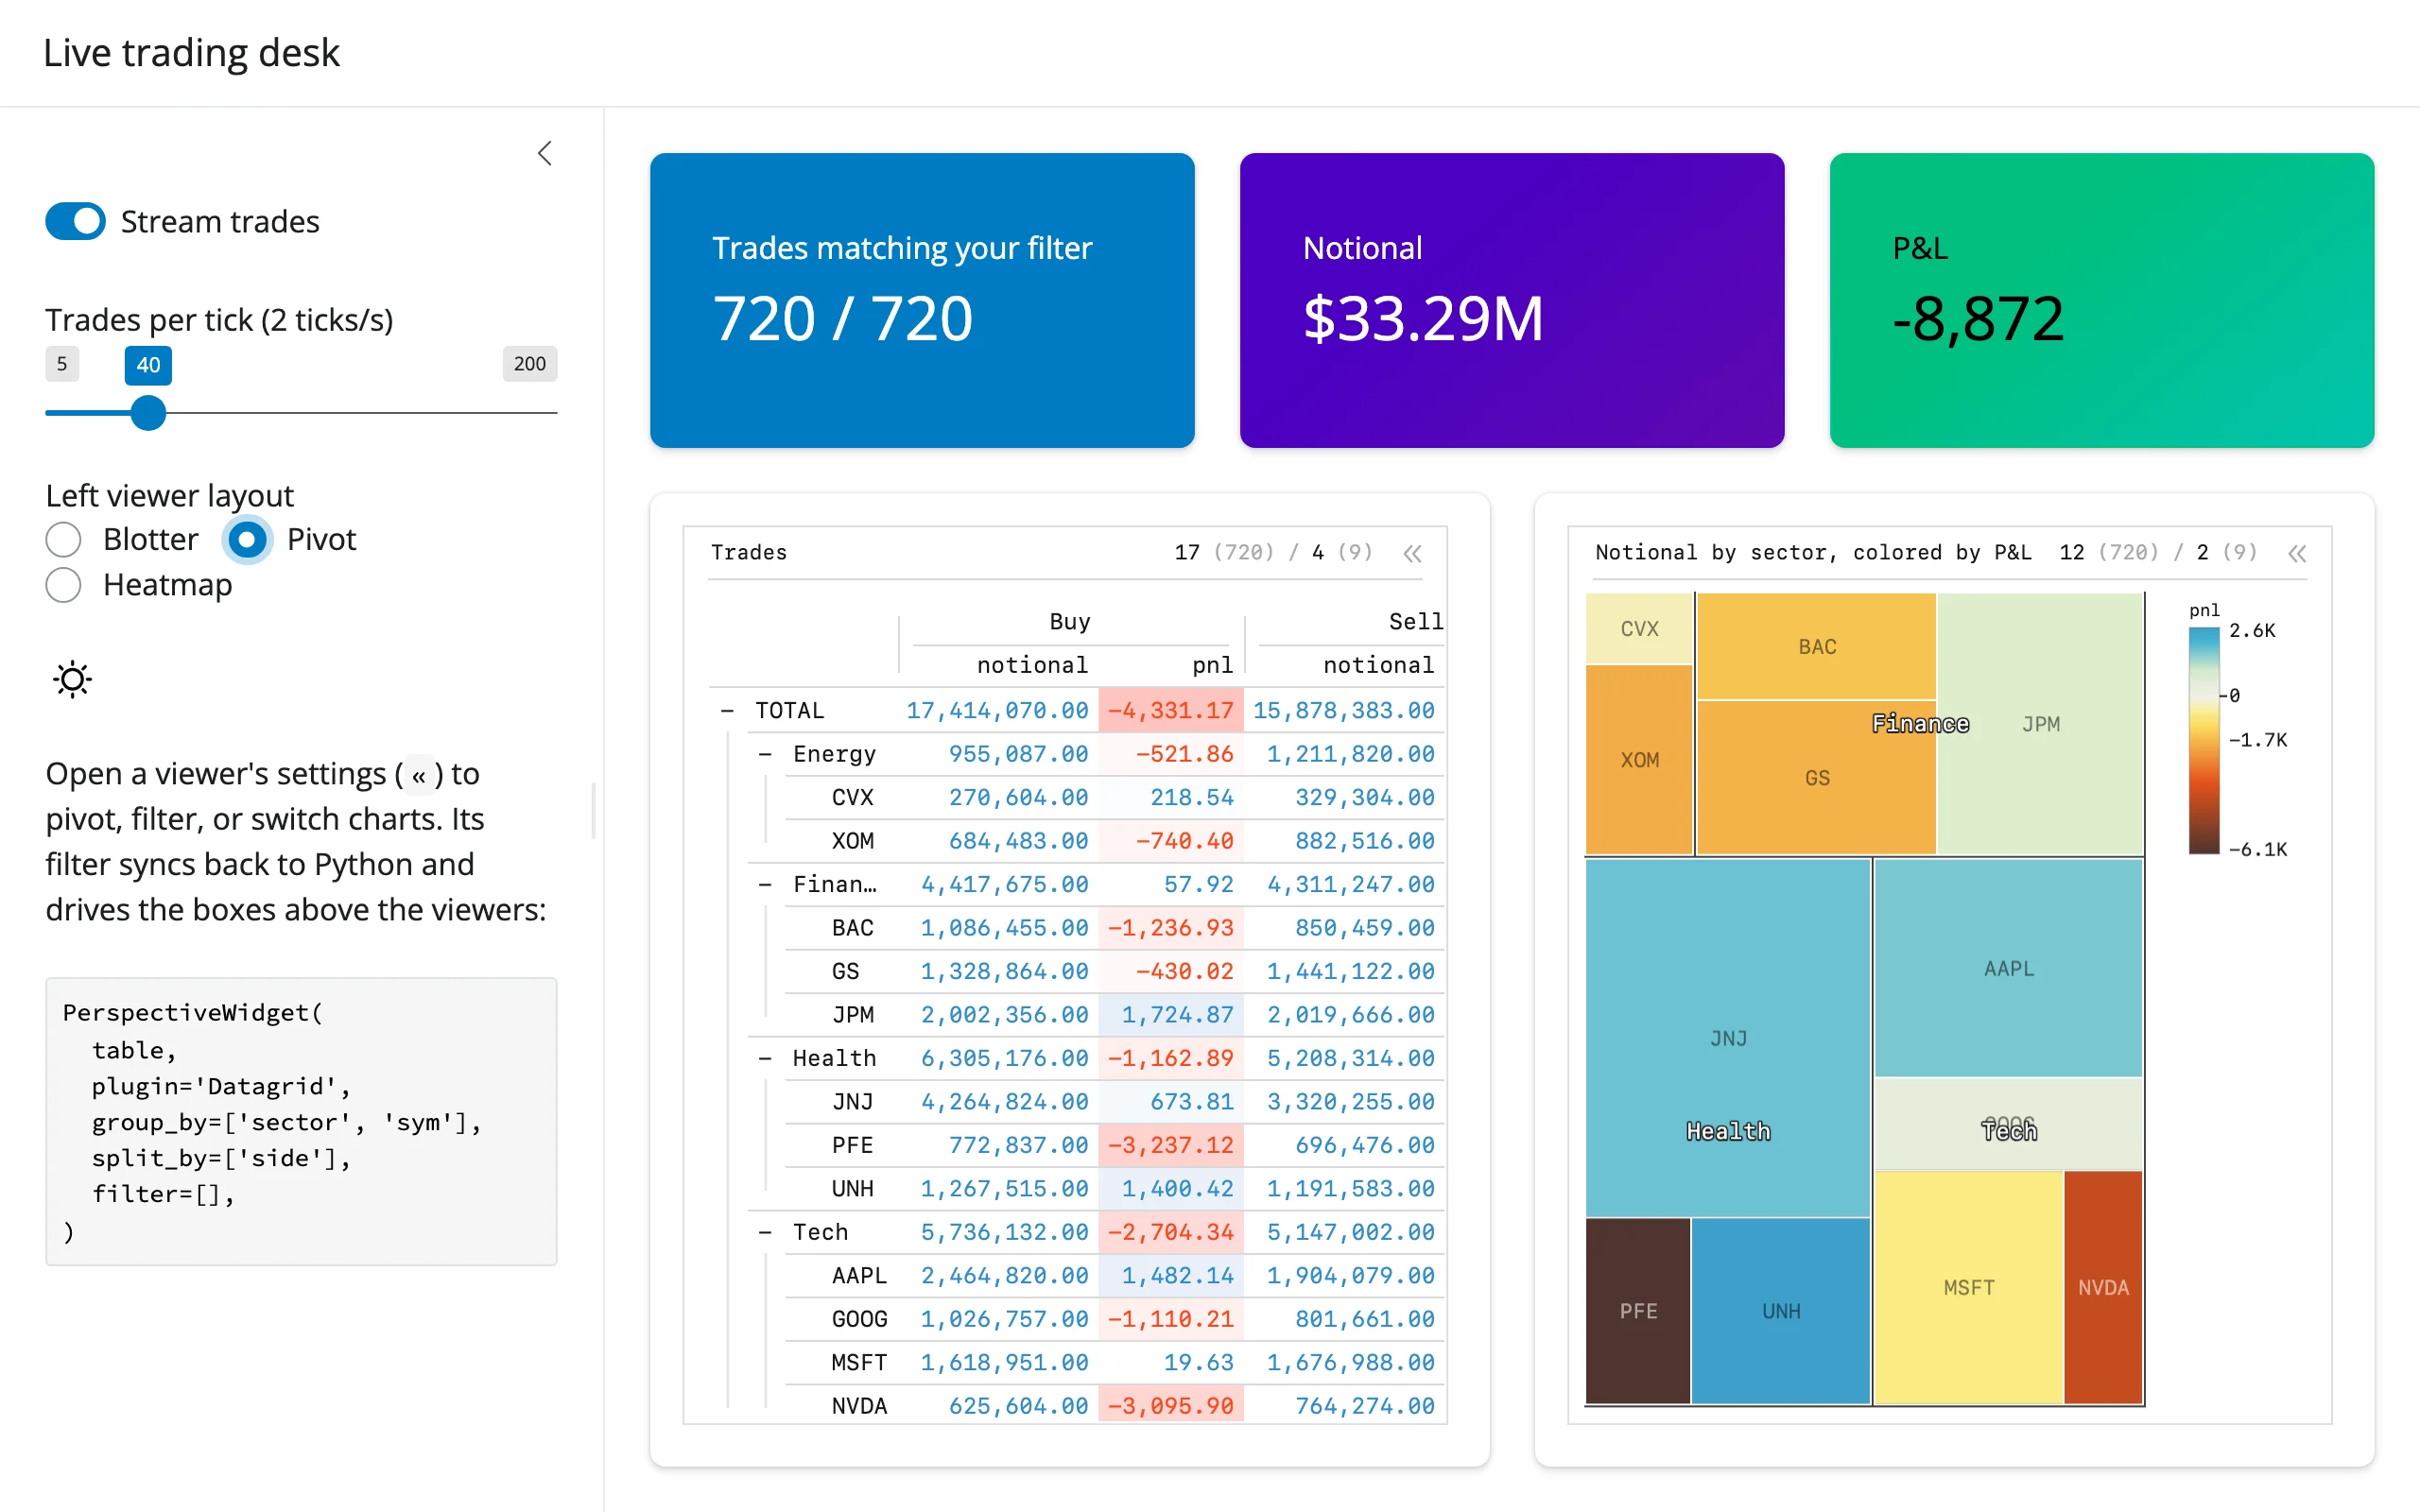
A live trading desk, streaming real tickers (AAPL, MSFT, NVDA, JPM, XOM, JNJ, and more) across four sectors: one table feeds a blotter grid and a P&L-colored treemap at once; three value boxes recompute server-side from exactly the blotter’s current filter(); a radio group swaps three hold_sync() viewer presets; dark mode updates both viewers’ themes in place.
Learn more
- Perspective user guide
- Perspective Python API reference
- Perspective viewer attributes (plugins,
columns_config, themes) - Related guides in this roster: itables, reactable, ipydatagrid, mosaic, quak, plotly