Explore Your Data
Posit Assistant turns exploratory data analysis into a conversation. Load a dataset, ask questions about it, and get visualizations — without writing a single line of code yourself.
How It Works
- Load your data — Open a dataset in your R or Python session. Posit Assistant automatically sees what’s in your environment.
- Ask questions — Type questions like “What does this data look like?” or “Show me the relationship between flipper length and body mass.”
- Iterate — Refine your analysis by asking follow-up questions. Request different chart types, filter subsets, or drill into specific variables.
What You Can Do
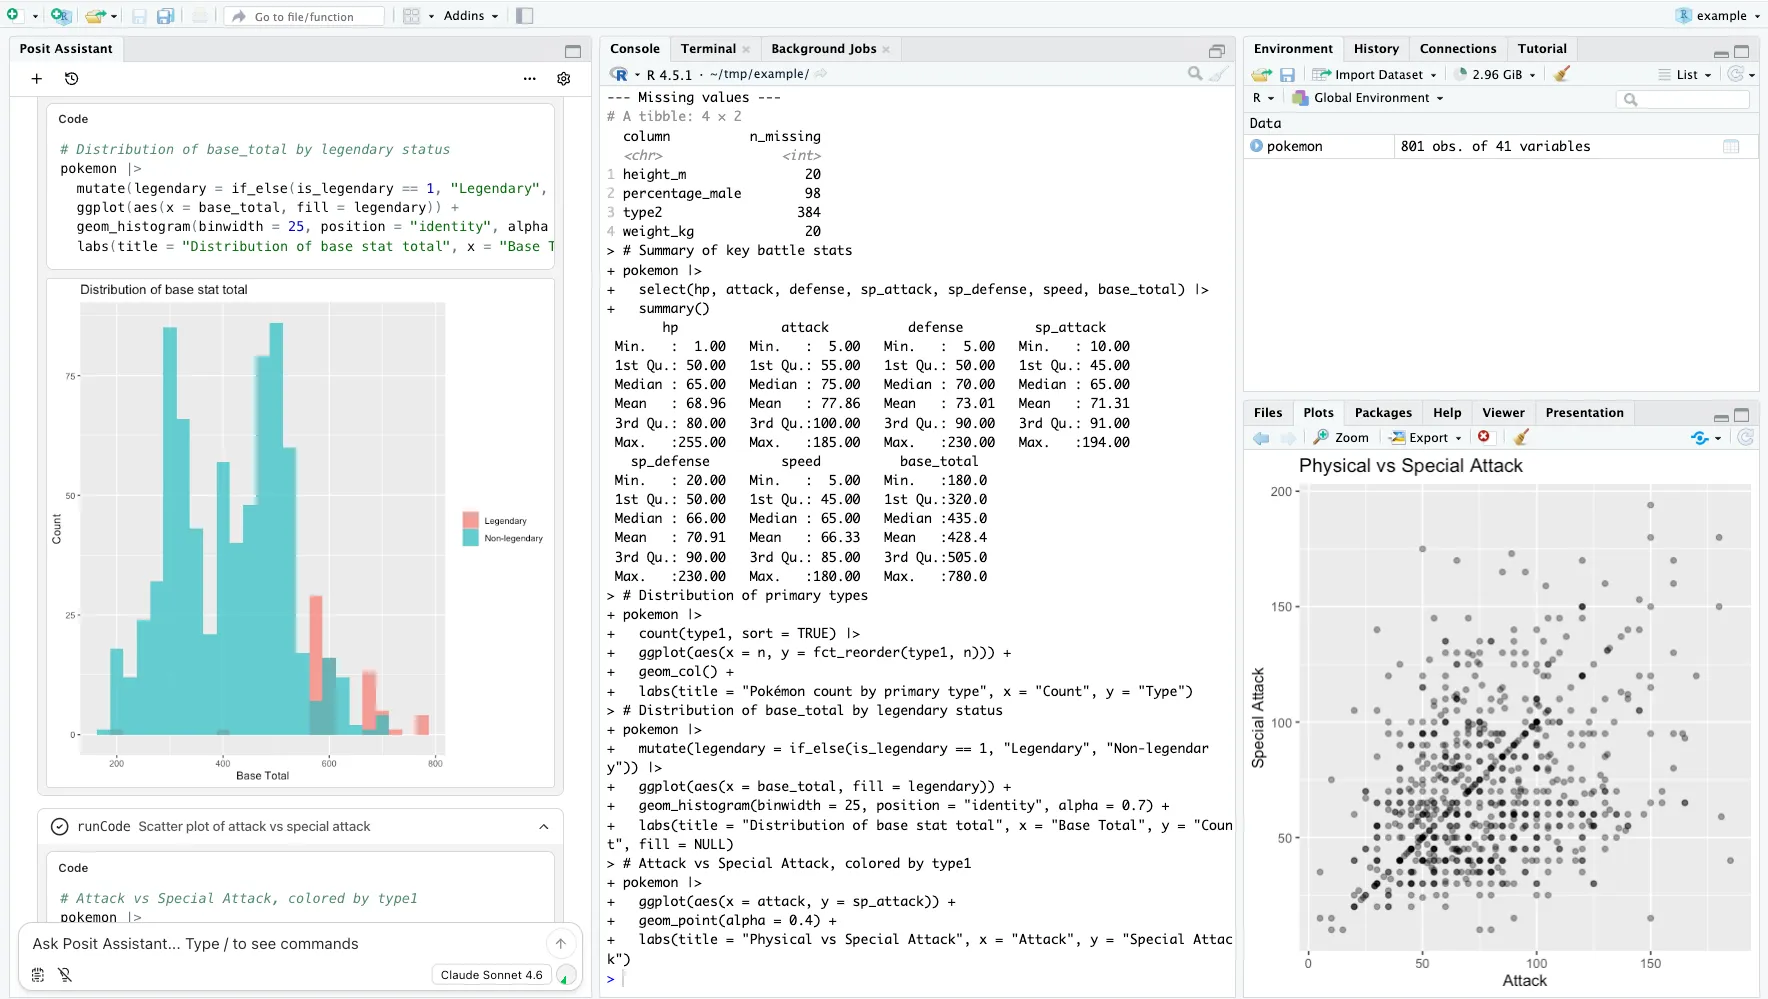
- Summarize datasets — Get structure, distributions, missing values, and key statistics at a glance.
- Spot patterns — Ask about correlations, clusters, or outliers and get visualizations that highlight them.
- Generate publication-ready plots — Request polished ggplot2 or matplotlib figures with titles, labels, and themes.
- Compare groups — Break down metrics by category, species, department, or any grouping variable.
Tips
- The more specific your question, the more targeted the output. “Show me a histogram” works, but “Show me the distribution of salary by department, with median lines” gets you further.
- Posit Assistant reads your session context, so you can reference objects you’ve already created: “Use the
clean_dfI just made.” - Ask for suggestions — “What patterns should I look at next?” — and Posit Assistant will propose follow-up analyses.