Crossfilter starter
Data exploration
A two-chart Mosaic crossfilter with a linked summary table.
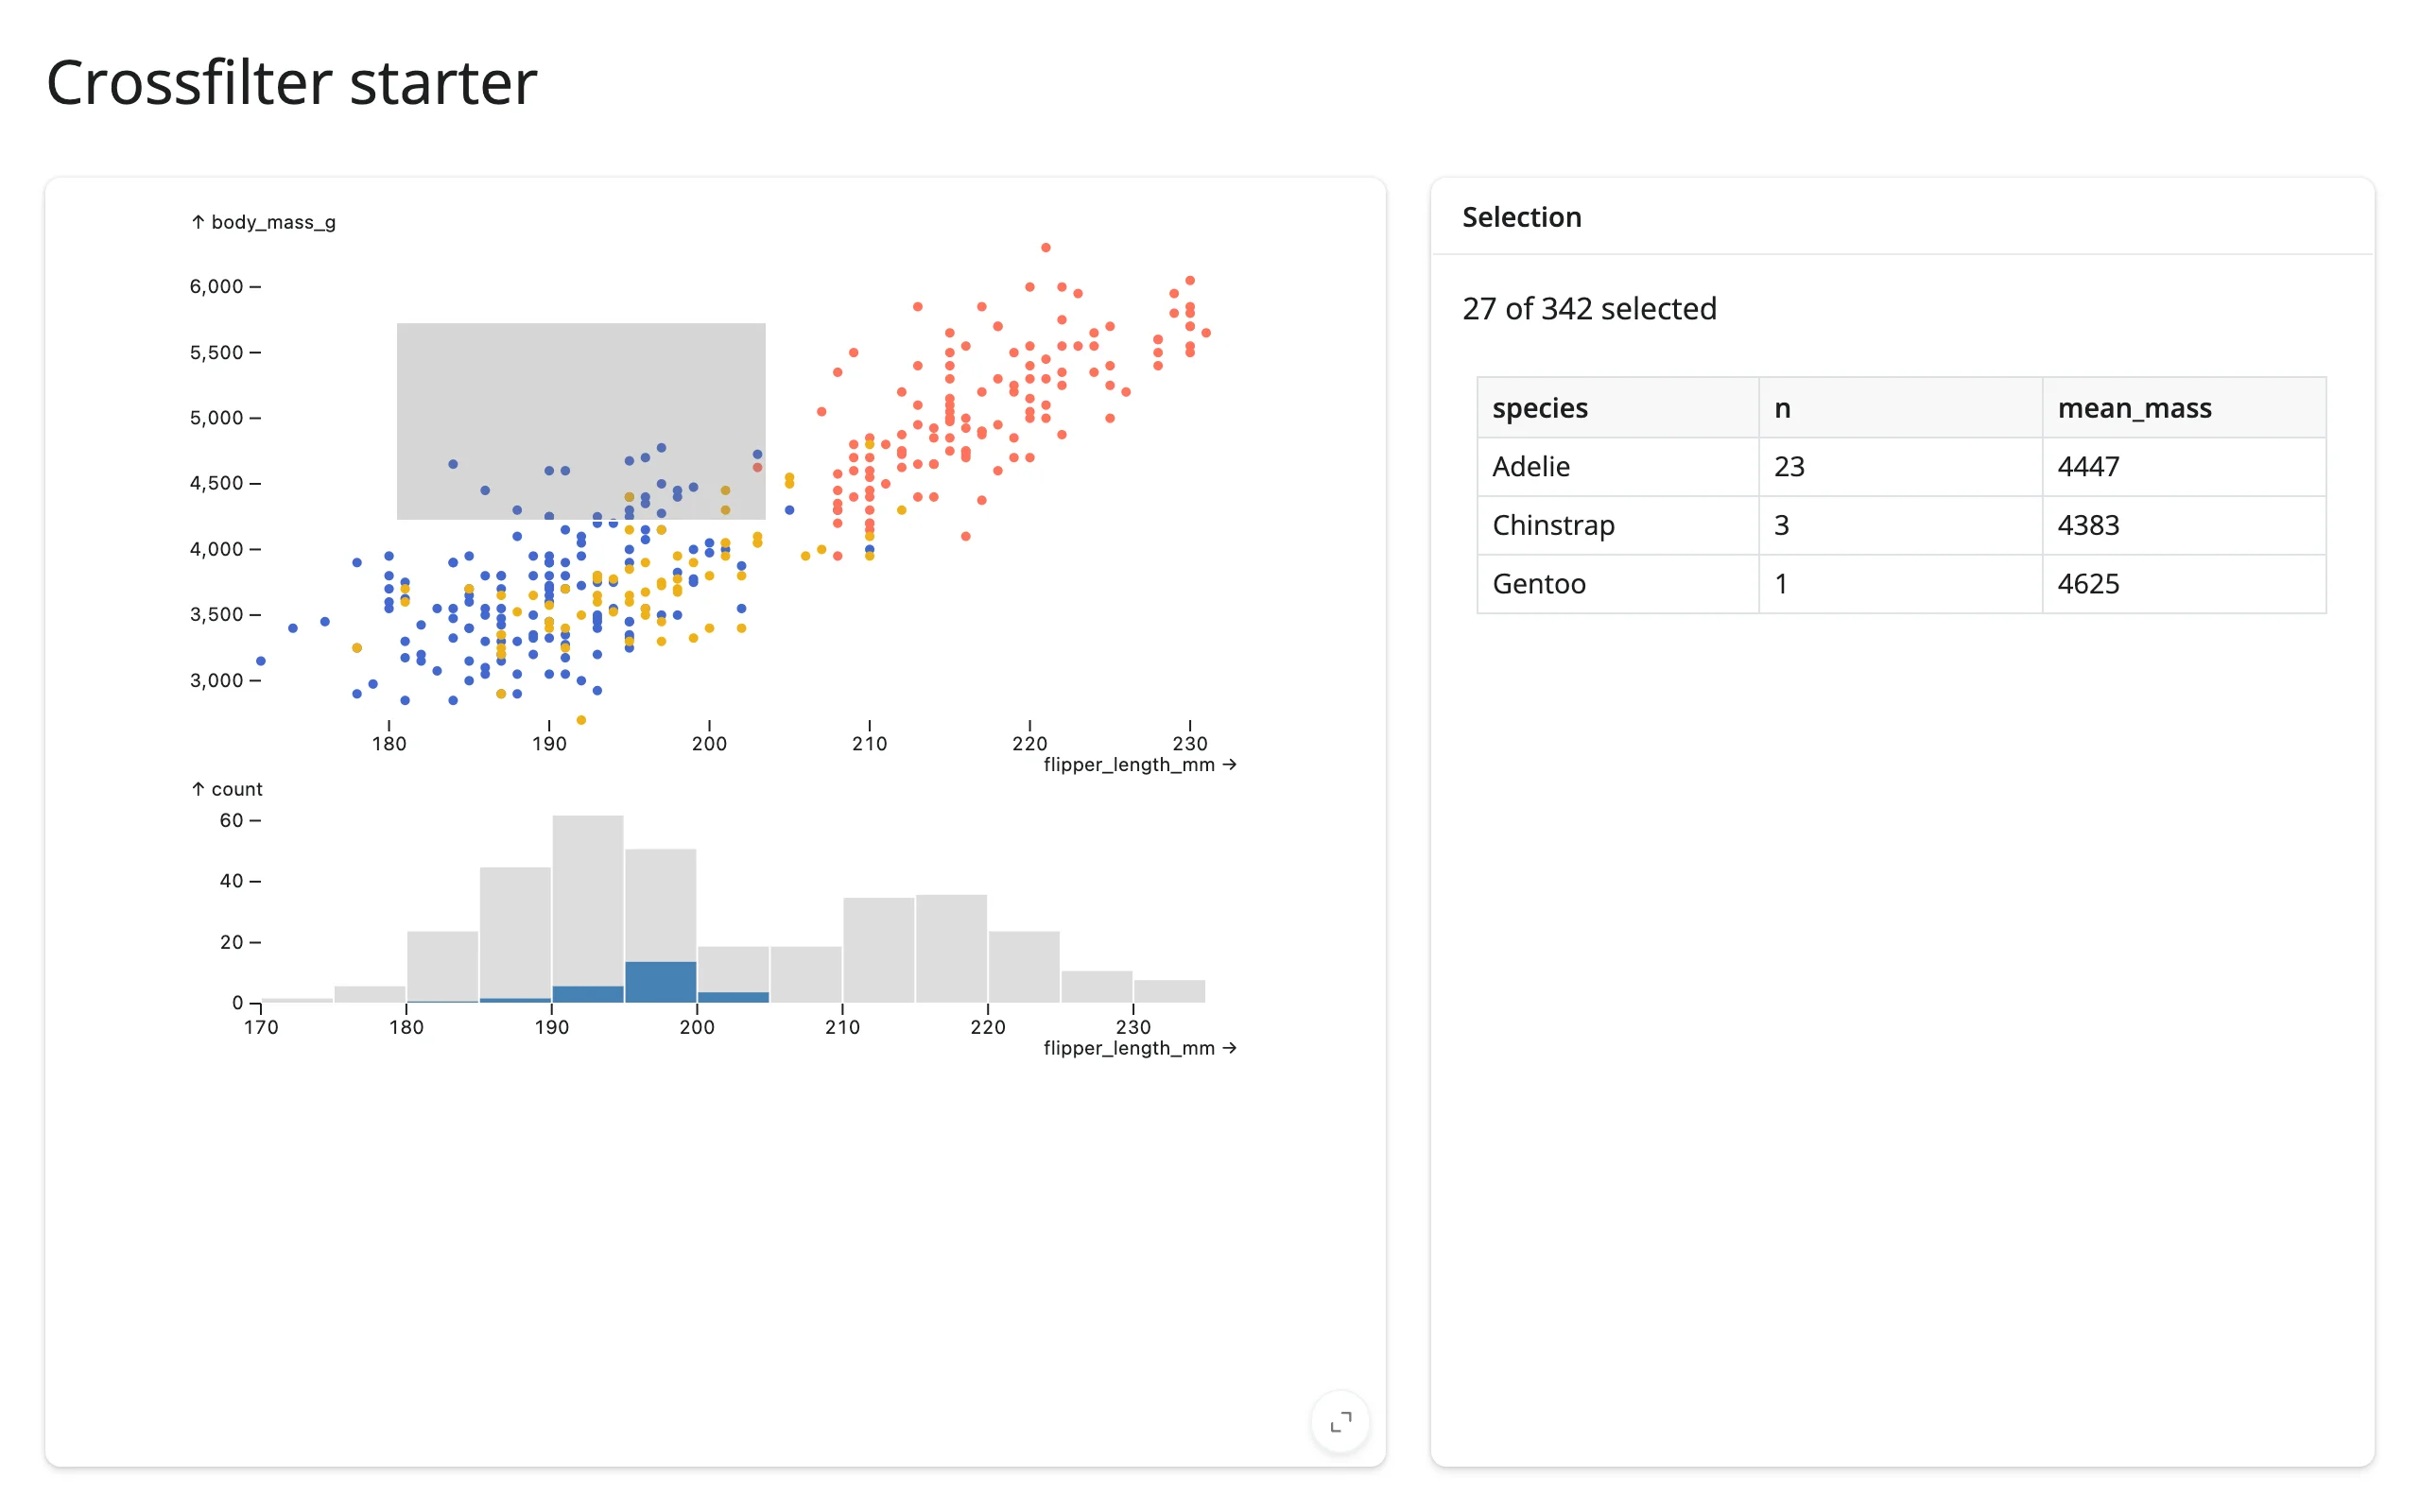
The canonical Mosaic crossfilter: a scatter plot and a histogram share one intervalXY/intervalX selection ($brush), so brushing either one filters both in the browser – no round trip to Python needed for the charts themselves. A @reactive.calc reads the same selection back into Python for a linked summary table.
Run it
git clone --depth 1 https://github.com/posit-dev/py-shinywidgets
cd py-shinywidgets/website/gallery/templates/mosaic-crossfilter
uv run shiny run app.py
Source: app.py · Open in Shinylive
Try it
- Drag a rectangle on the scatter plot (flipper length vs. body mass).
- Watch the histogram below highlight the matching bin counts in blue, and “N of 342 selected” plus the per-species table update.
Habits worth copying
- Fixed domains (
xDomain/yDomain: "Fixed") keep the axes stable as the selection changes – without this, Mosaic would otherwise rescale and make the before/after harder to read. - A background context layer (the gray bars behind the blue ones in the histogram) shows the full distribution behind the filtered one, so you can see what you’ve excluded.
- One shared
@reactive.calc(selected()) for the filtered data avoids recomputing the same DuckDB query twice for the count and the table.
Accessors demonstrated
dashboard.params()– the current parameter values (here, the brush interval); reading it is what makesselected()reactive to brush changes.dashboard.data()– an Ibis/DuckDB relation already filtered by every active Mosaic selection, ready to.aggregate()or.df().
What to change for your own data
- Replace the
penguinsDataFrame and the spec’s"from": "penguins"references with your own table name and columns. - Add more linked charts to the
vconcatlist; they all share the same$brushparameter.