Atlas explorer
Data exploration
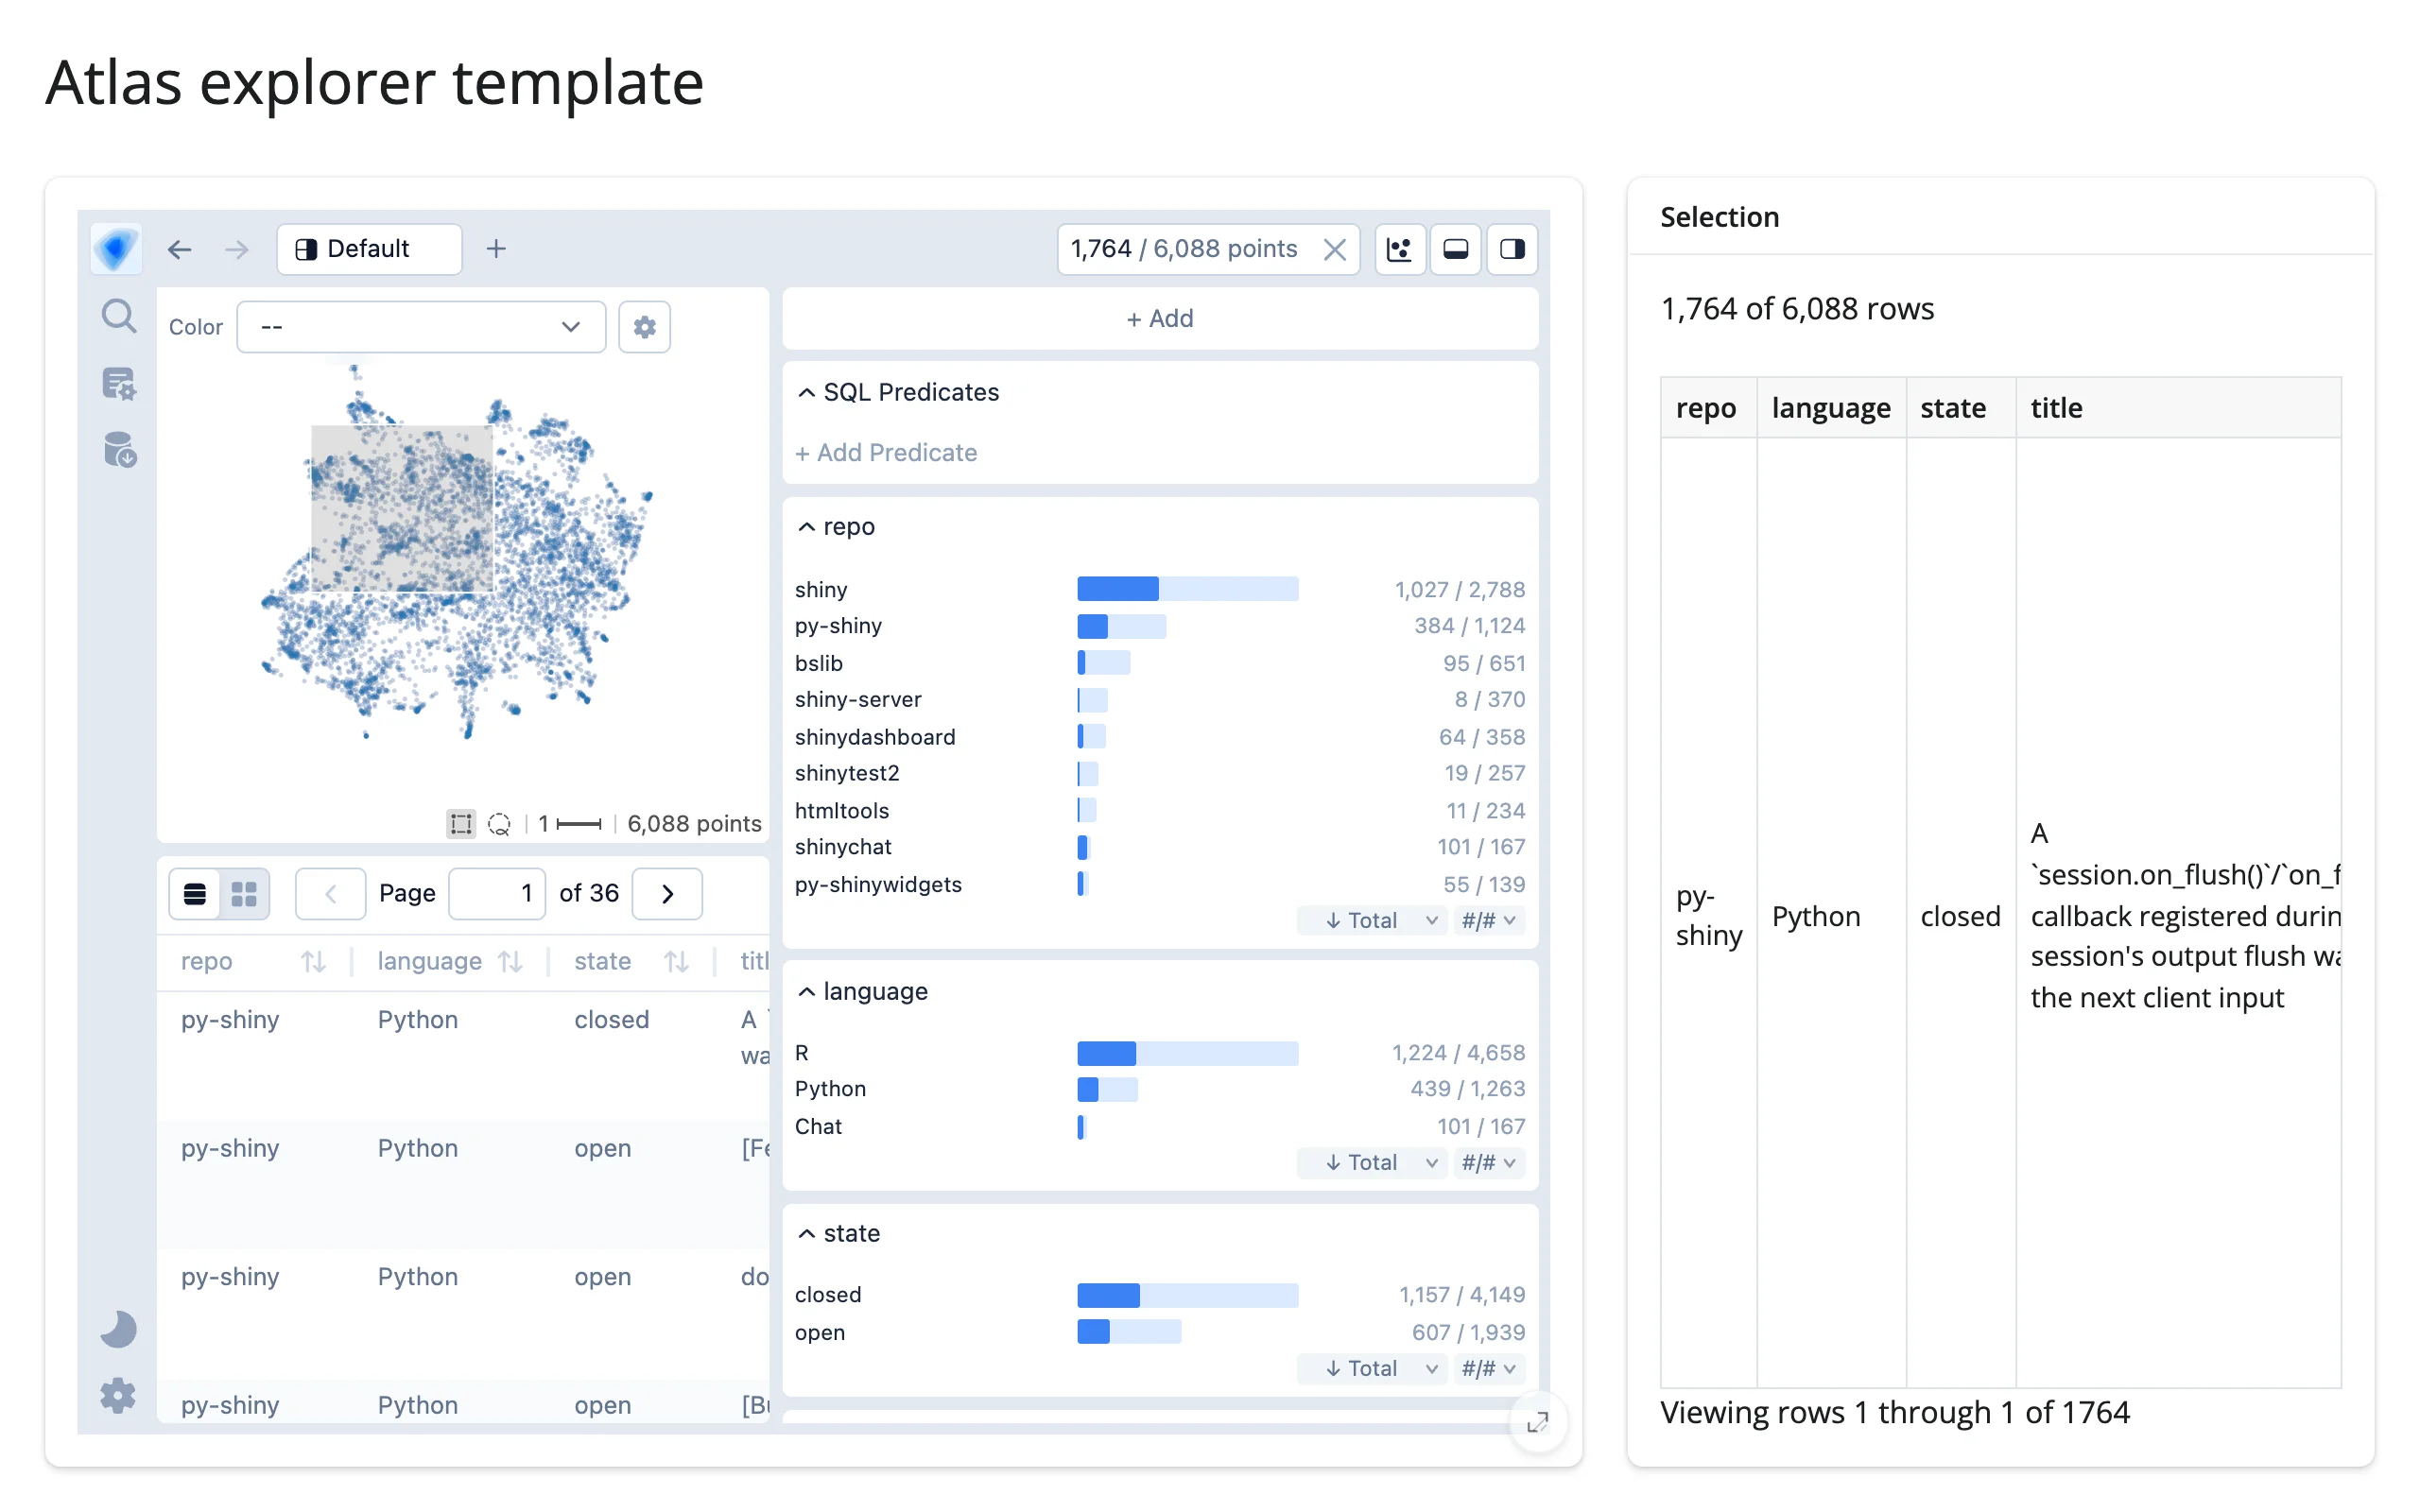
An embedding atlas next to a live stat line and a detail table, both driven by the current brush selection.
An embedding_atlas scatter view of a precomputed 2D projection, paired with a live row count (computed via a direct DuckDB query using the brush’s SQL predicate) and a detail table of the selected rows.
Run it
git clone --depth 1 https://github.com/posit-dev/py-shinywidgets
cd py-shinywidgets/website/gallery/templates/embedding-atlas-explorer
uv run shiny run app.py
Source: app.py · Open in Shinylive
Try it
- Click the box-select icon in the canvas toolbar (a plain drag pans the view instead).
- Drag a rectangle over a cluster of points.
- Watch “N of 6,088 rows” update, and the detail table on the right fill with the matching issues (repo, language, state, title).
Accessors demonstrated
atlas.predicate()– a SQLWHERE-clause fragment (as a string) describing the current brush, orNonewhen nothing is selected. Used here directly in a DuckDB query for a fast count.atlas.selected()– the selected rows as a DataFrame (minus the projection/internal-index columns), ready to display or export.
What to change for your own data
- Swap
DATA/COLUMNS/X/Y/TEXTfor your own parquet file and projection columns. The projection (projection_x/projection_y) must be precomputed offline –embedding_atlas.projection.compute_projection()cannot run inside Shiny’s event loop. predicate()composes with any DuckDB query against the same registered table, not justcount(*)– use it for any other live aggregate.
Dependency note
This project’s DuckDB connection (con) is a private, in-process connection created at module load and used read-only by this app’s own query – it is not the same connection render_embedding_atlas locks down against browser-sent SQL, and is not shared across sessions.