Classifier playground
Charts
Input & drawing
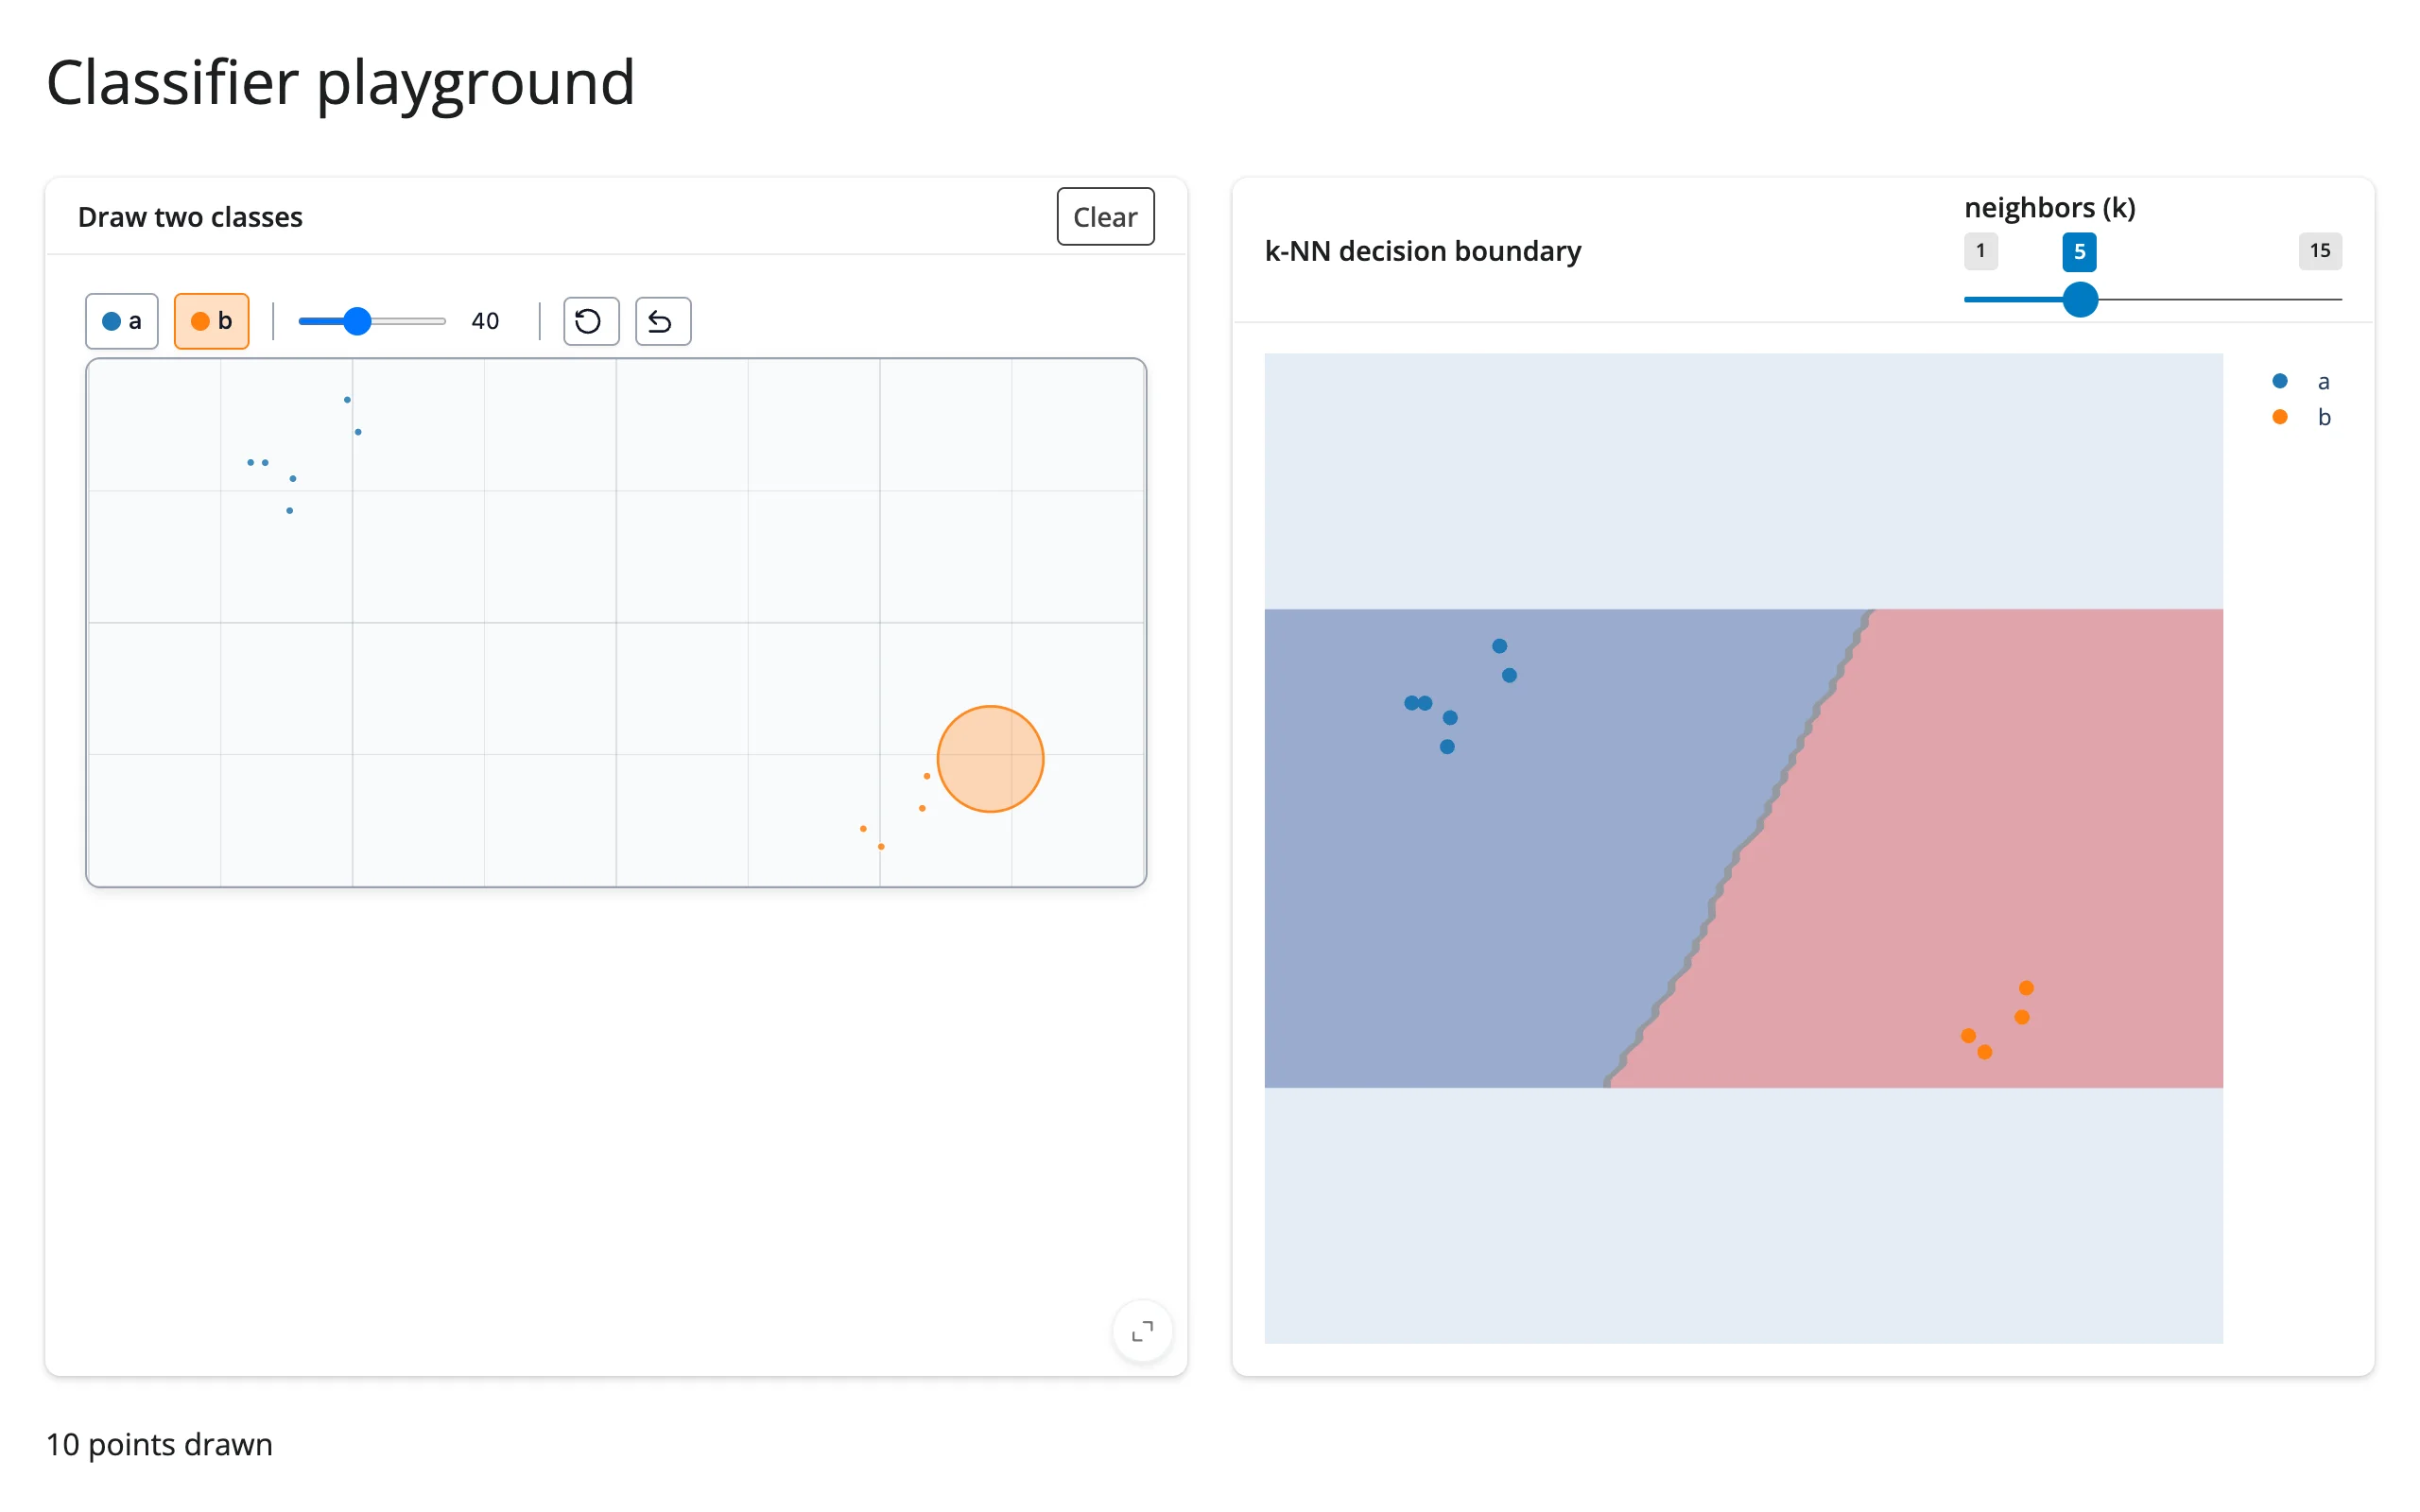
Draw two classes by hand and watch a k-NN decision boundary refit live, next to a point count and a clear button.
A hands-on way to build intuition for classifiers: draw points of two classes on a drawdata canvas, and a plotly contour plot refits a k-NN model and redraws the decision boundary on every change, live.
Run it
git clone --depth 1 https://github.com/posit-dev/py-shinywidgets
cd py-shinywidgets/website/gallery/templates/drawdata-classifier-playground
uv run --with scikit-learn shiny run app.py
Source: app.py · Open in Shinylive
Try it
- Draw a handful of points for class “a” (default).
- Click “b” in the class switcher, then draw points for class “b” elsewhere on the canvas.
- Watch the decision boundary appear once both classes have at least one point.
- Drag the “neighbors (k)” slider to see how the boundary smooths out as k grows.
- Click “Clear” to reset.
Accessors demonstrated
drawdata has no dedicated accessors; this template uses canvas.read("data") – the taught fallback for a renderer output’s bare synced traits, replacing reactive_read(x.widget, ...) – to read the drawn points as a list of dicts (x, y, label, color), converted to a DataFrame.
What to change for your own data
- Swap
KNeighborsClassifierfor any other scikit-learn classifier (LogisticRegression,SVC, a smallMLPClassifier, …) – the contour-plotting code is classifier-agnostic as long as.fit()/.predict()work the same way. ScatterWidget(n_classes=2)can go up to more classes; thegroupby("label")loop already handles any number of classes.