World development dashboard
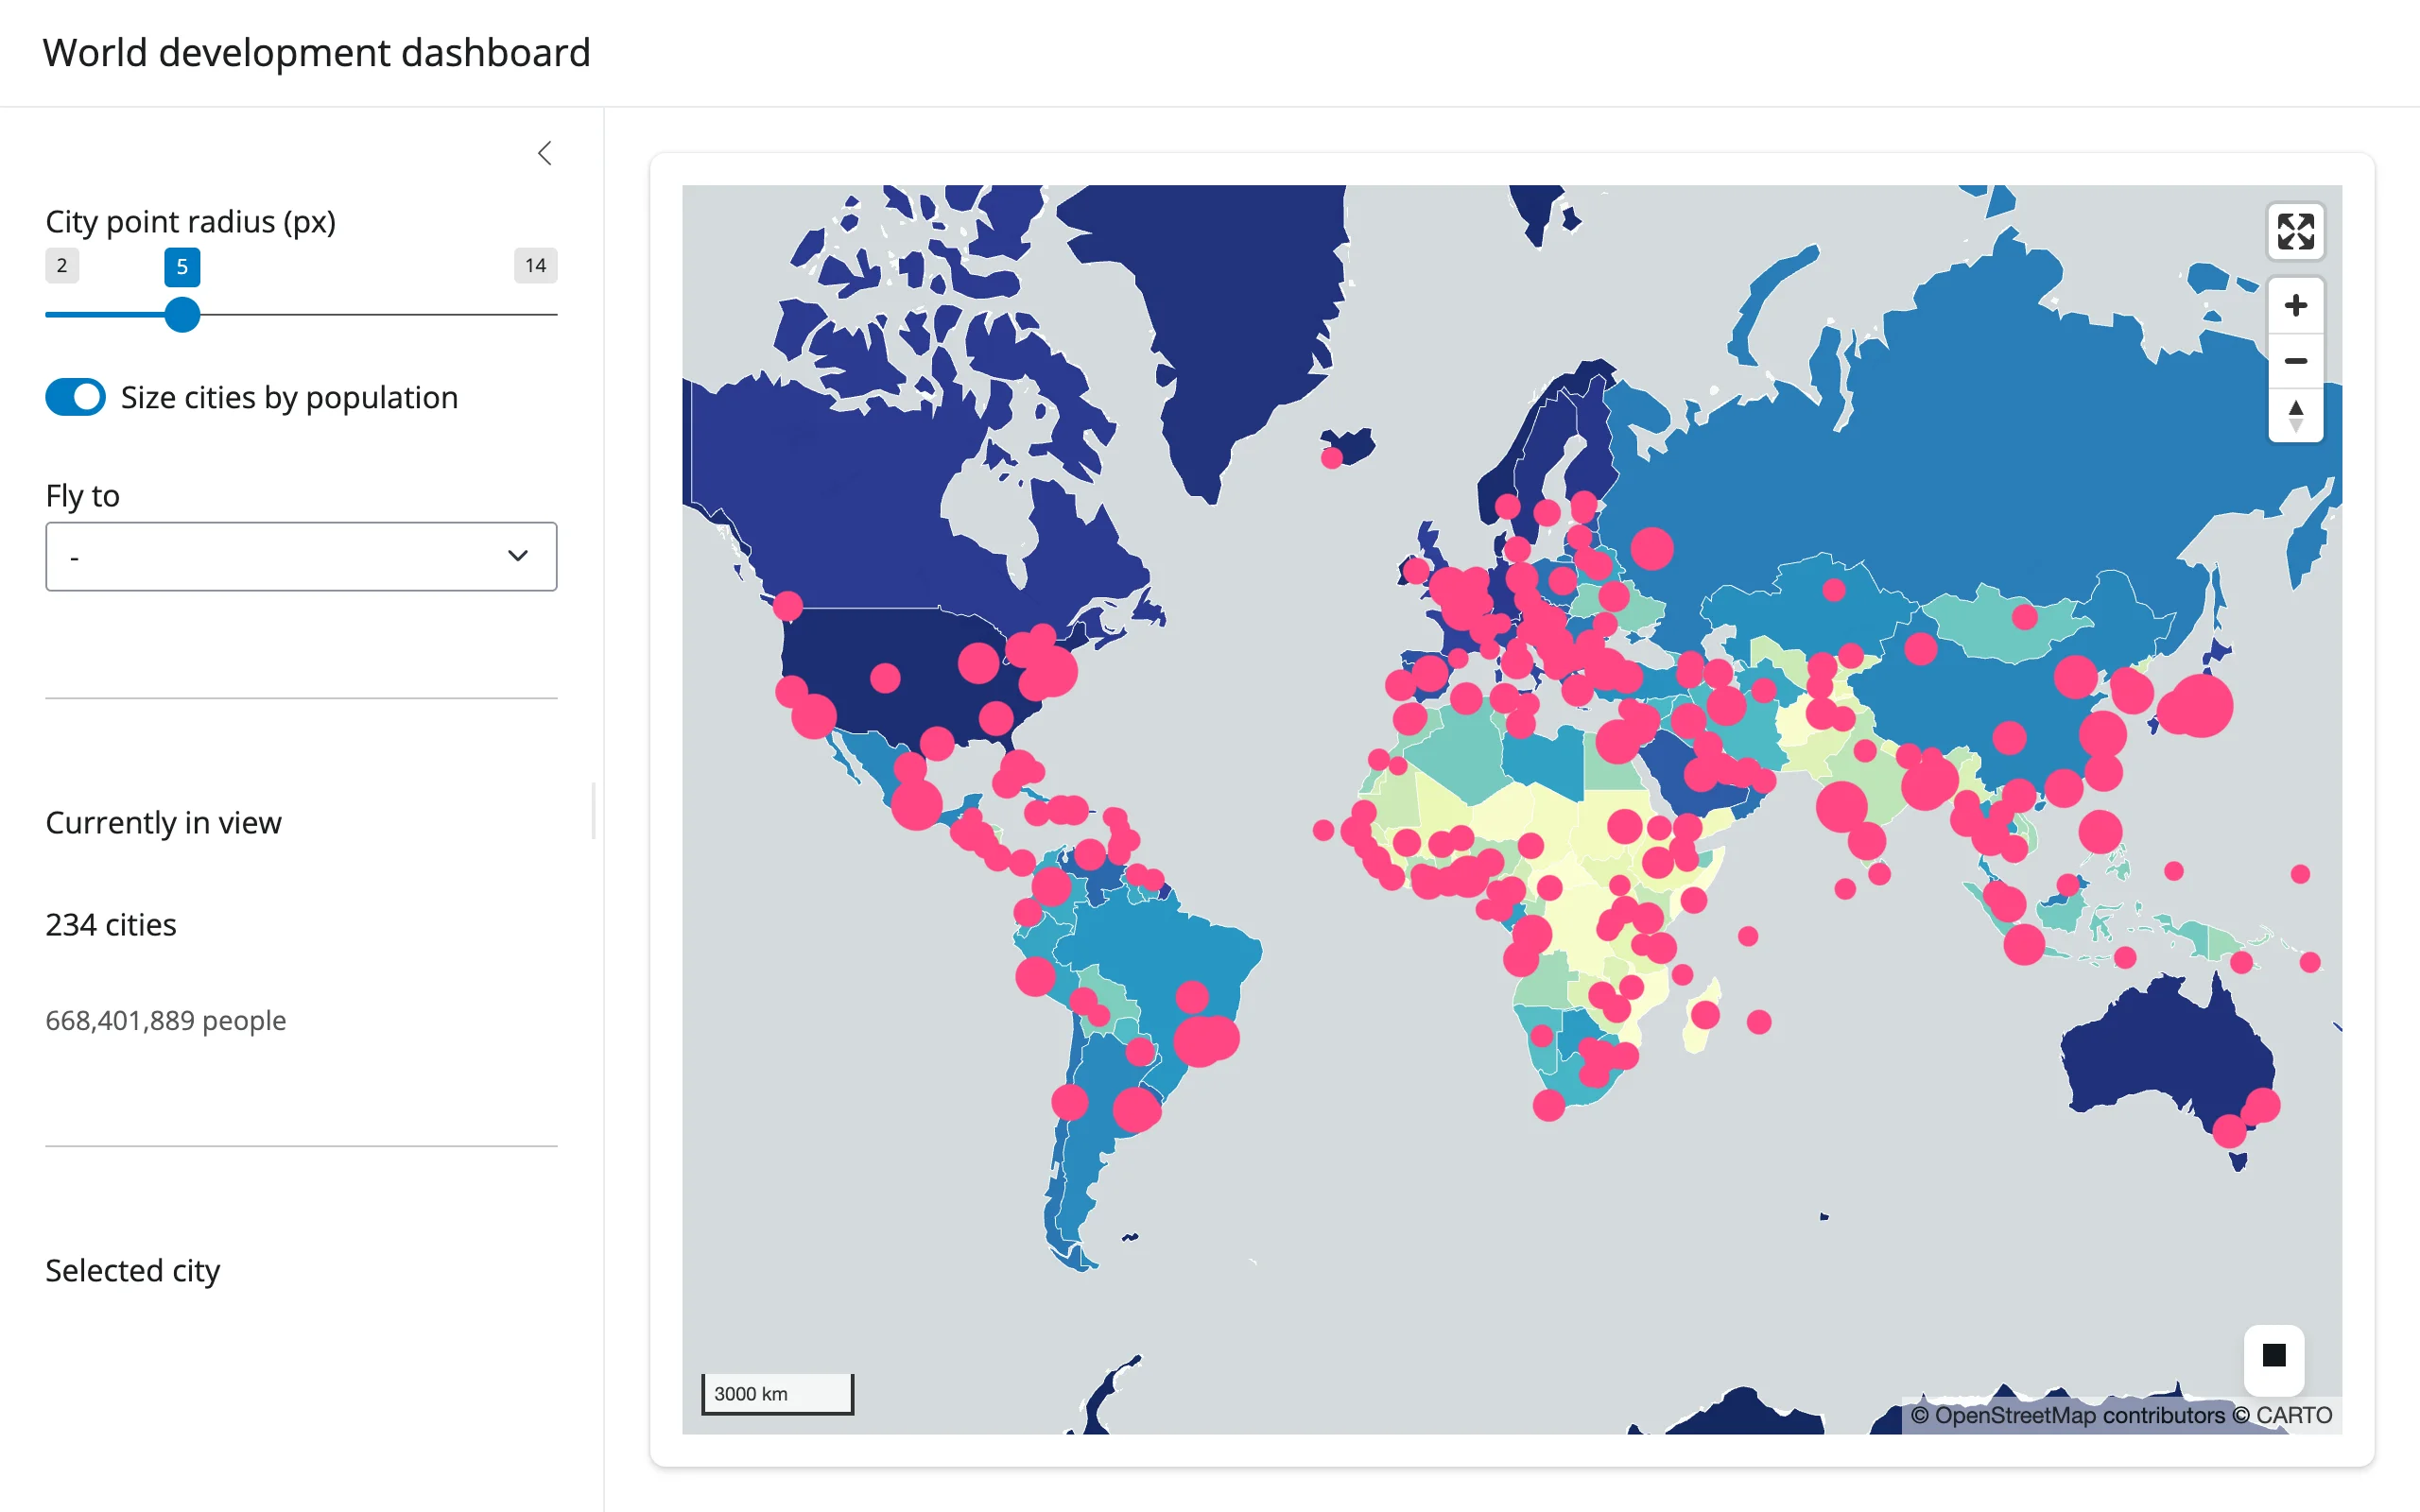
177 country polygons, colored by GDP per capita, with a 243-point city layer sized by population on top. Everything you can do to the city layer – resize the dots, switch between a fixed radius and a population-scaled one, fly to a city – restyles the existing lonboard Map in place, so the 420 features backing it only cross the wire once.
Run it
git clone --depth 1 https://github.com/posit-dev/py-shinywidgets
cd py-shinywidgets/website/gallery/showcases/world-development-dashboard
uv run shiny run app.py
Source: app.py · Open in Shinylive
Try this
- Drag the City point radius slider, or flip Size cities by population: the dots resize in place (
layer.get_radius = ...), no re-render. - Pick a city from Fly to: the map flies there (
map.widget.fly_to(...)) while a small client-sideResizeObserver+ ad hoc JS keeps reporting the canvas’s pixel size, so Python can convertview_state()(center + zoom) into an exact lng/lat viewport box. - Click any pink dot: the sidebar’s Selected city card uses
map.selected()to look up the clicked city’s name and country. - Watch Currently in view: it recomputes from
view_state()on every pan/zoom, filtering the full city GeoDataFrame against the current viewport box.
Accessors demonstrated
map.view_state()– center/zoom, read continuously to compute a viewport-filtered stat (paired with a tiny client-sideShiny.setInputValuefor the canvas’s pixel size, since lonboard has no bounds trait).map.selected()– the clicked feature’s row position in whichever GeoDataFrame was passed to the layer that was hit; used here to show a detail card.
Verification
Smoke-tested in this environment: server boots clean, map and choropleth render over a real network fetch of the Natural Earth GeoJSON (confirmed reachable), and a real Playwright click on a city dot updates the “Selected city” card from selected() (verified against the rendered DOM text, not just a screenshot) – see img/hero.webp and img/after_click.webp.
Source: promoted from docs/widget-guides/lonboard/gallery/showcase_world_dashboard.py.