Rhodopsin in motion
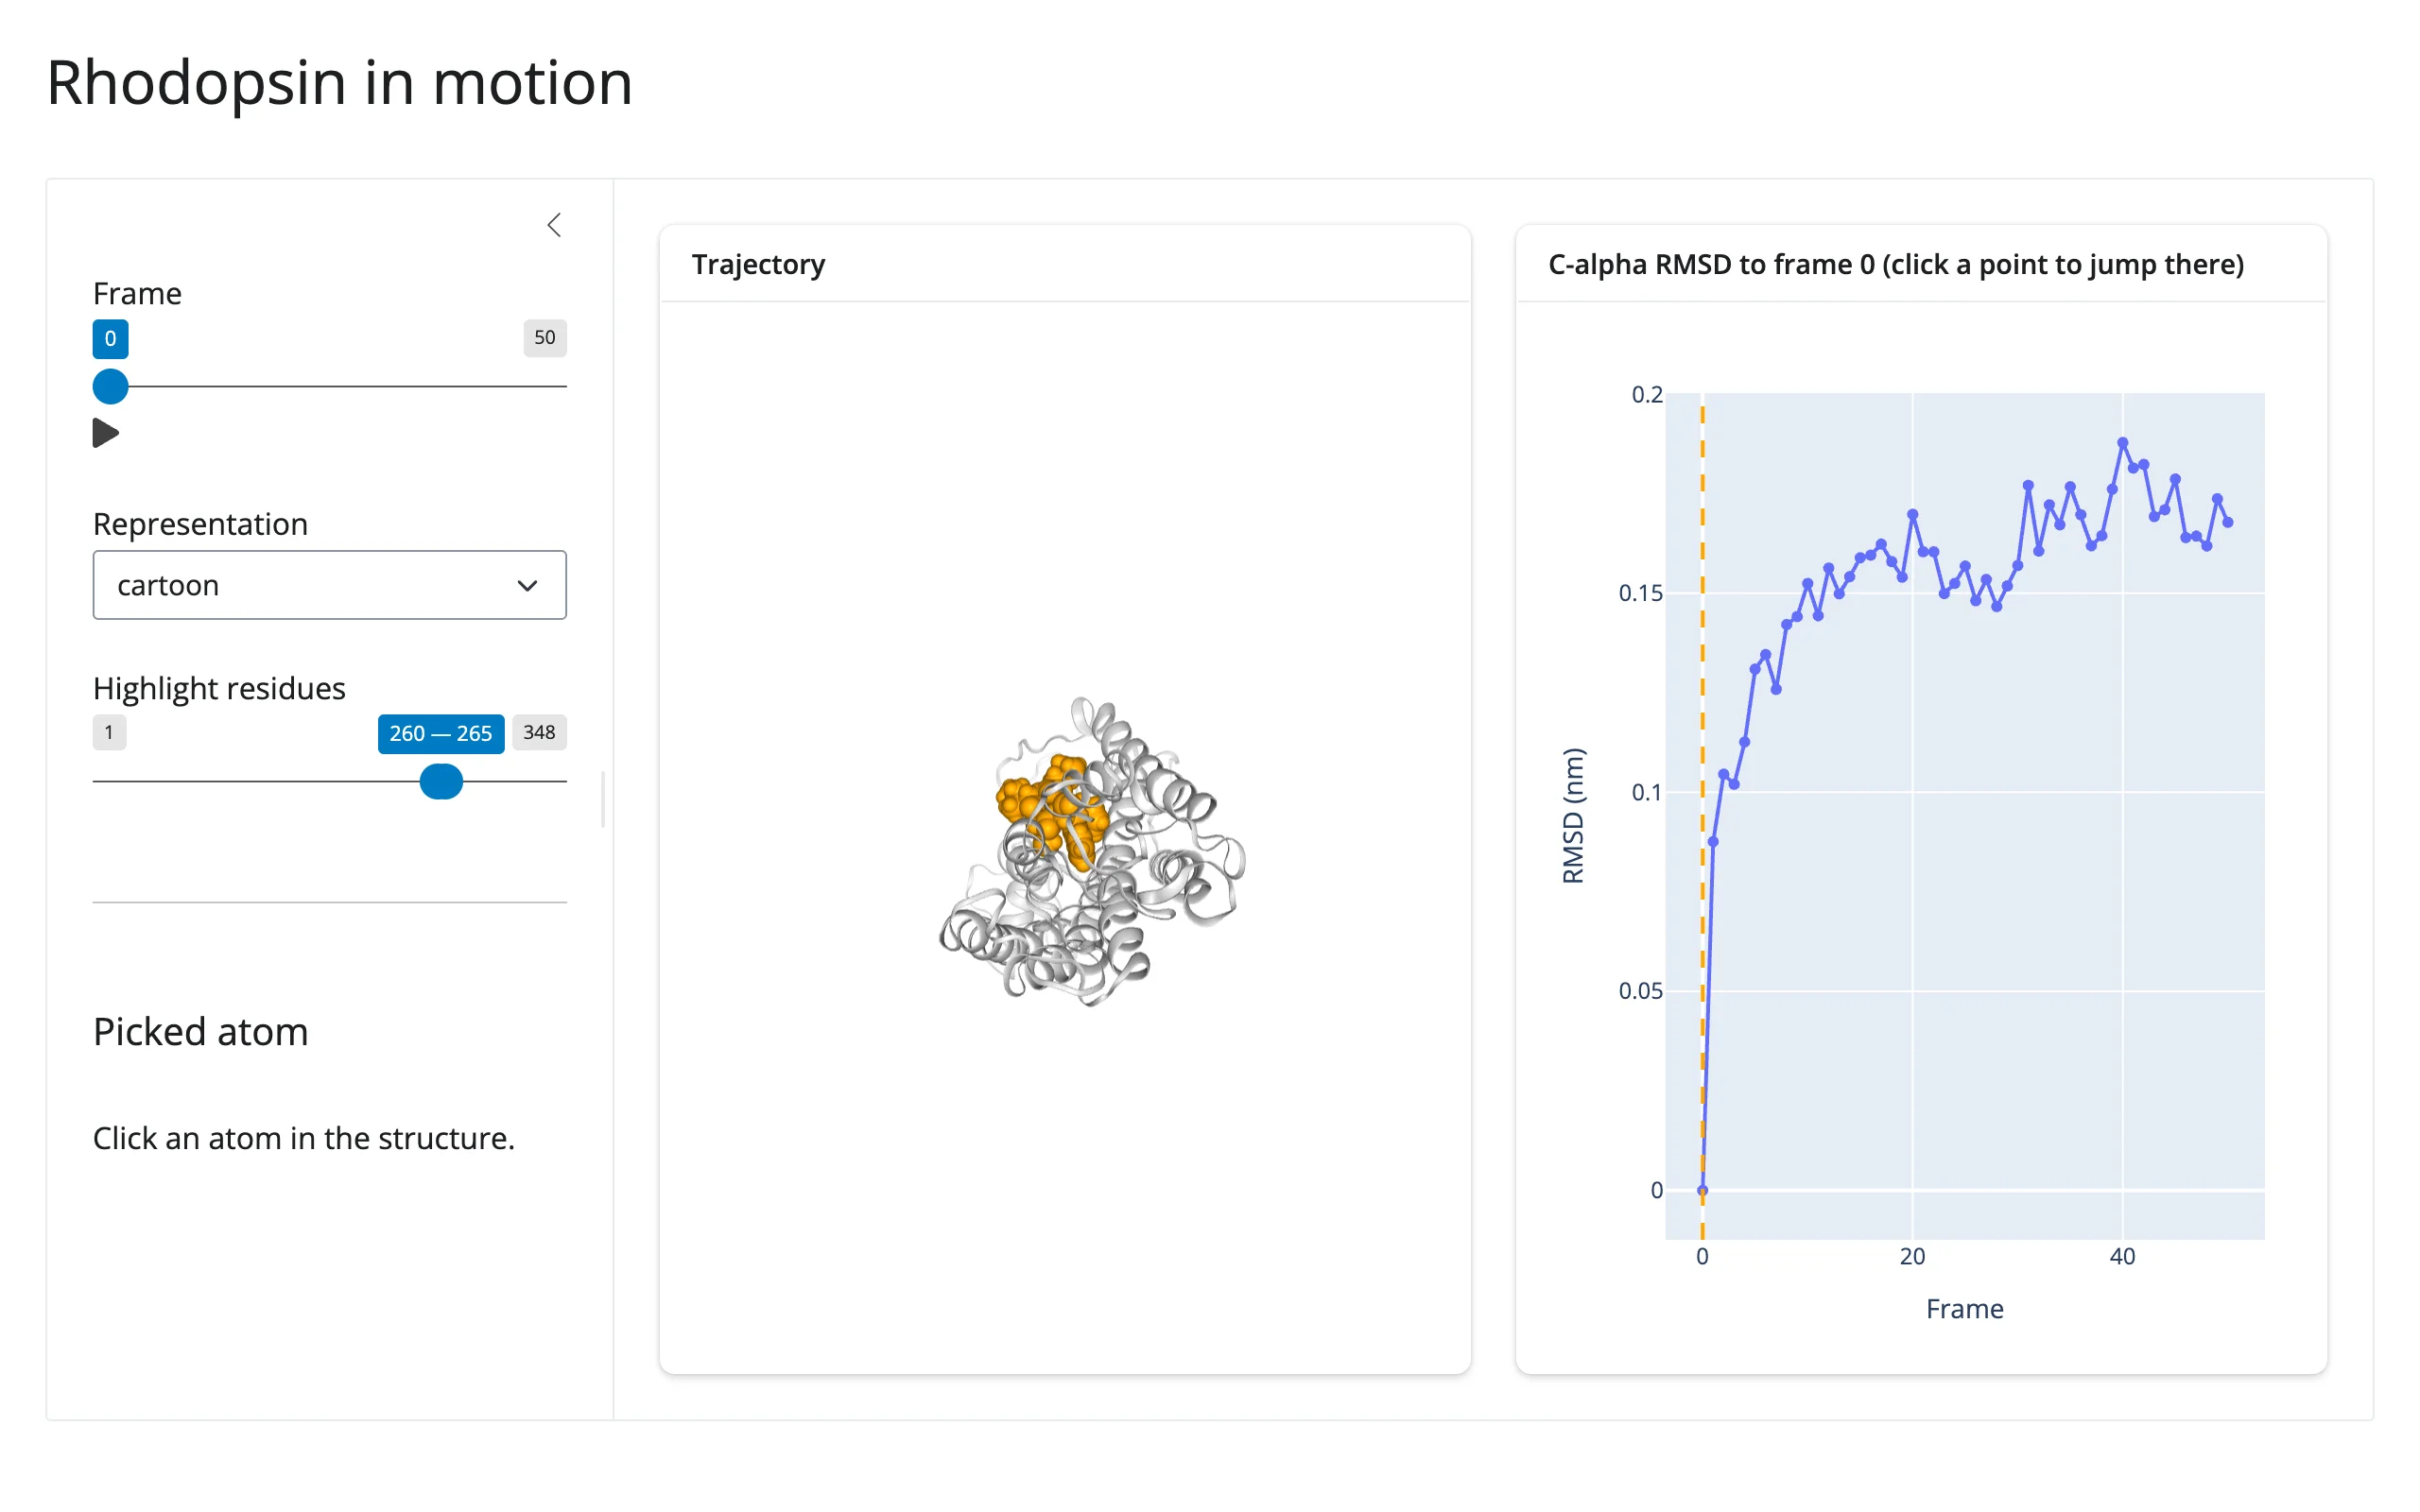
A bundled 1 ns molecular dynamics trajectory of rhodopsin (51 frames), loaded with mdtraj and displayed with nglview. A single shared reactive.value (current_frame) is the one source of truth for “what frame are we on”: the frame slider, a click anywhere on the RMSD chart, and playback (animate=True) all write to it, and three separate effects read it to move the 3D viewer, the chart’s reference line, and nothing else – every update is in place, so the camera and the chart’s zoom are untouched.
Run it
git clone --depth 1 https://github.com/posit-dev/py-shinywidgets
cd py-shinywidgets/website/gallery/showcases/rhodopsin-in-motion
uv run --with mdtraj shiny run app.py
Source: app.py · Open in Shinylive
Try this
- Drag the Frame slider (or press its play button): the structure and the chart’s dashed reference line move together.
- Click anywhere on the RMSD chart: the frame jumps there, in both the viewer and the slider.
- Switch Representation (cartoon/licorice/spacefill/surface), or drag Highlight residues: the structure restyles without resetting the frame or the camera.
- Click an atom in the 3D structure: the sidebar’s Picked atom card identifies it (residue name, number, chain).
Accessors demonstrated
rmsd_plot.clicked()– the clicked point’s(x, y)on the RMSD chart;xis used directly as a frame number.structure.read("picked")– nglview’s ownpickedtrait, read via.read()(the taught fallback for any synced trait on a renderer output, replacingreactive_read(x.widget, ...)) sincerender_nglviewhas no dedicated accessors;Nonethen an atom record once something has been clicked.
Verification
Needs one ephemeral package (mdtraj, not in the project’s locked venv; harmless to overlay since nothing else in the venv depends on a specific mdtraj version). A real Playwright click on the RMSD chart’s line-plot markers moved the frame slider from 0 to 20 and visibly shifted both the chart’s reference line and the highlighted residue range in the 3D view – confirmed against the slider’s actual value, not just a screenshot. A real click on the 3D structure itself identified TRP 265 chain B in the Picked atom card. See img/hero.webp, img/after_click.webp (chart click), img/after_atom_click.webp (structure click).
Source: promoted from docs/widget-guides/nglview/gallery/showcase_md_explorer.py.