Table row to highlight
Charts
Tables & grids
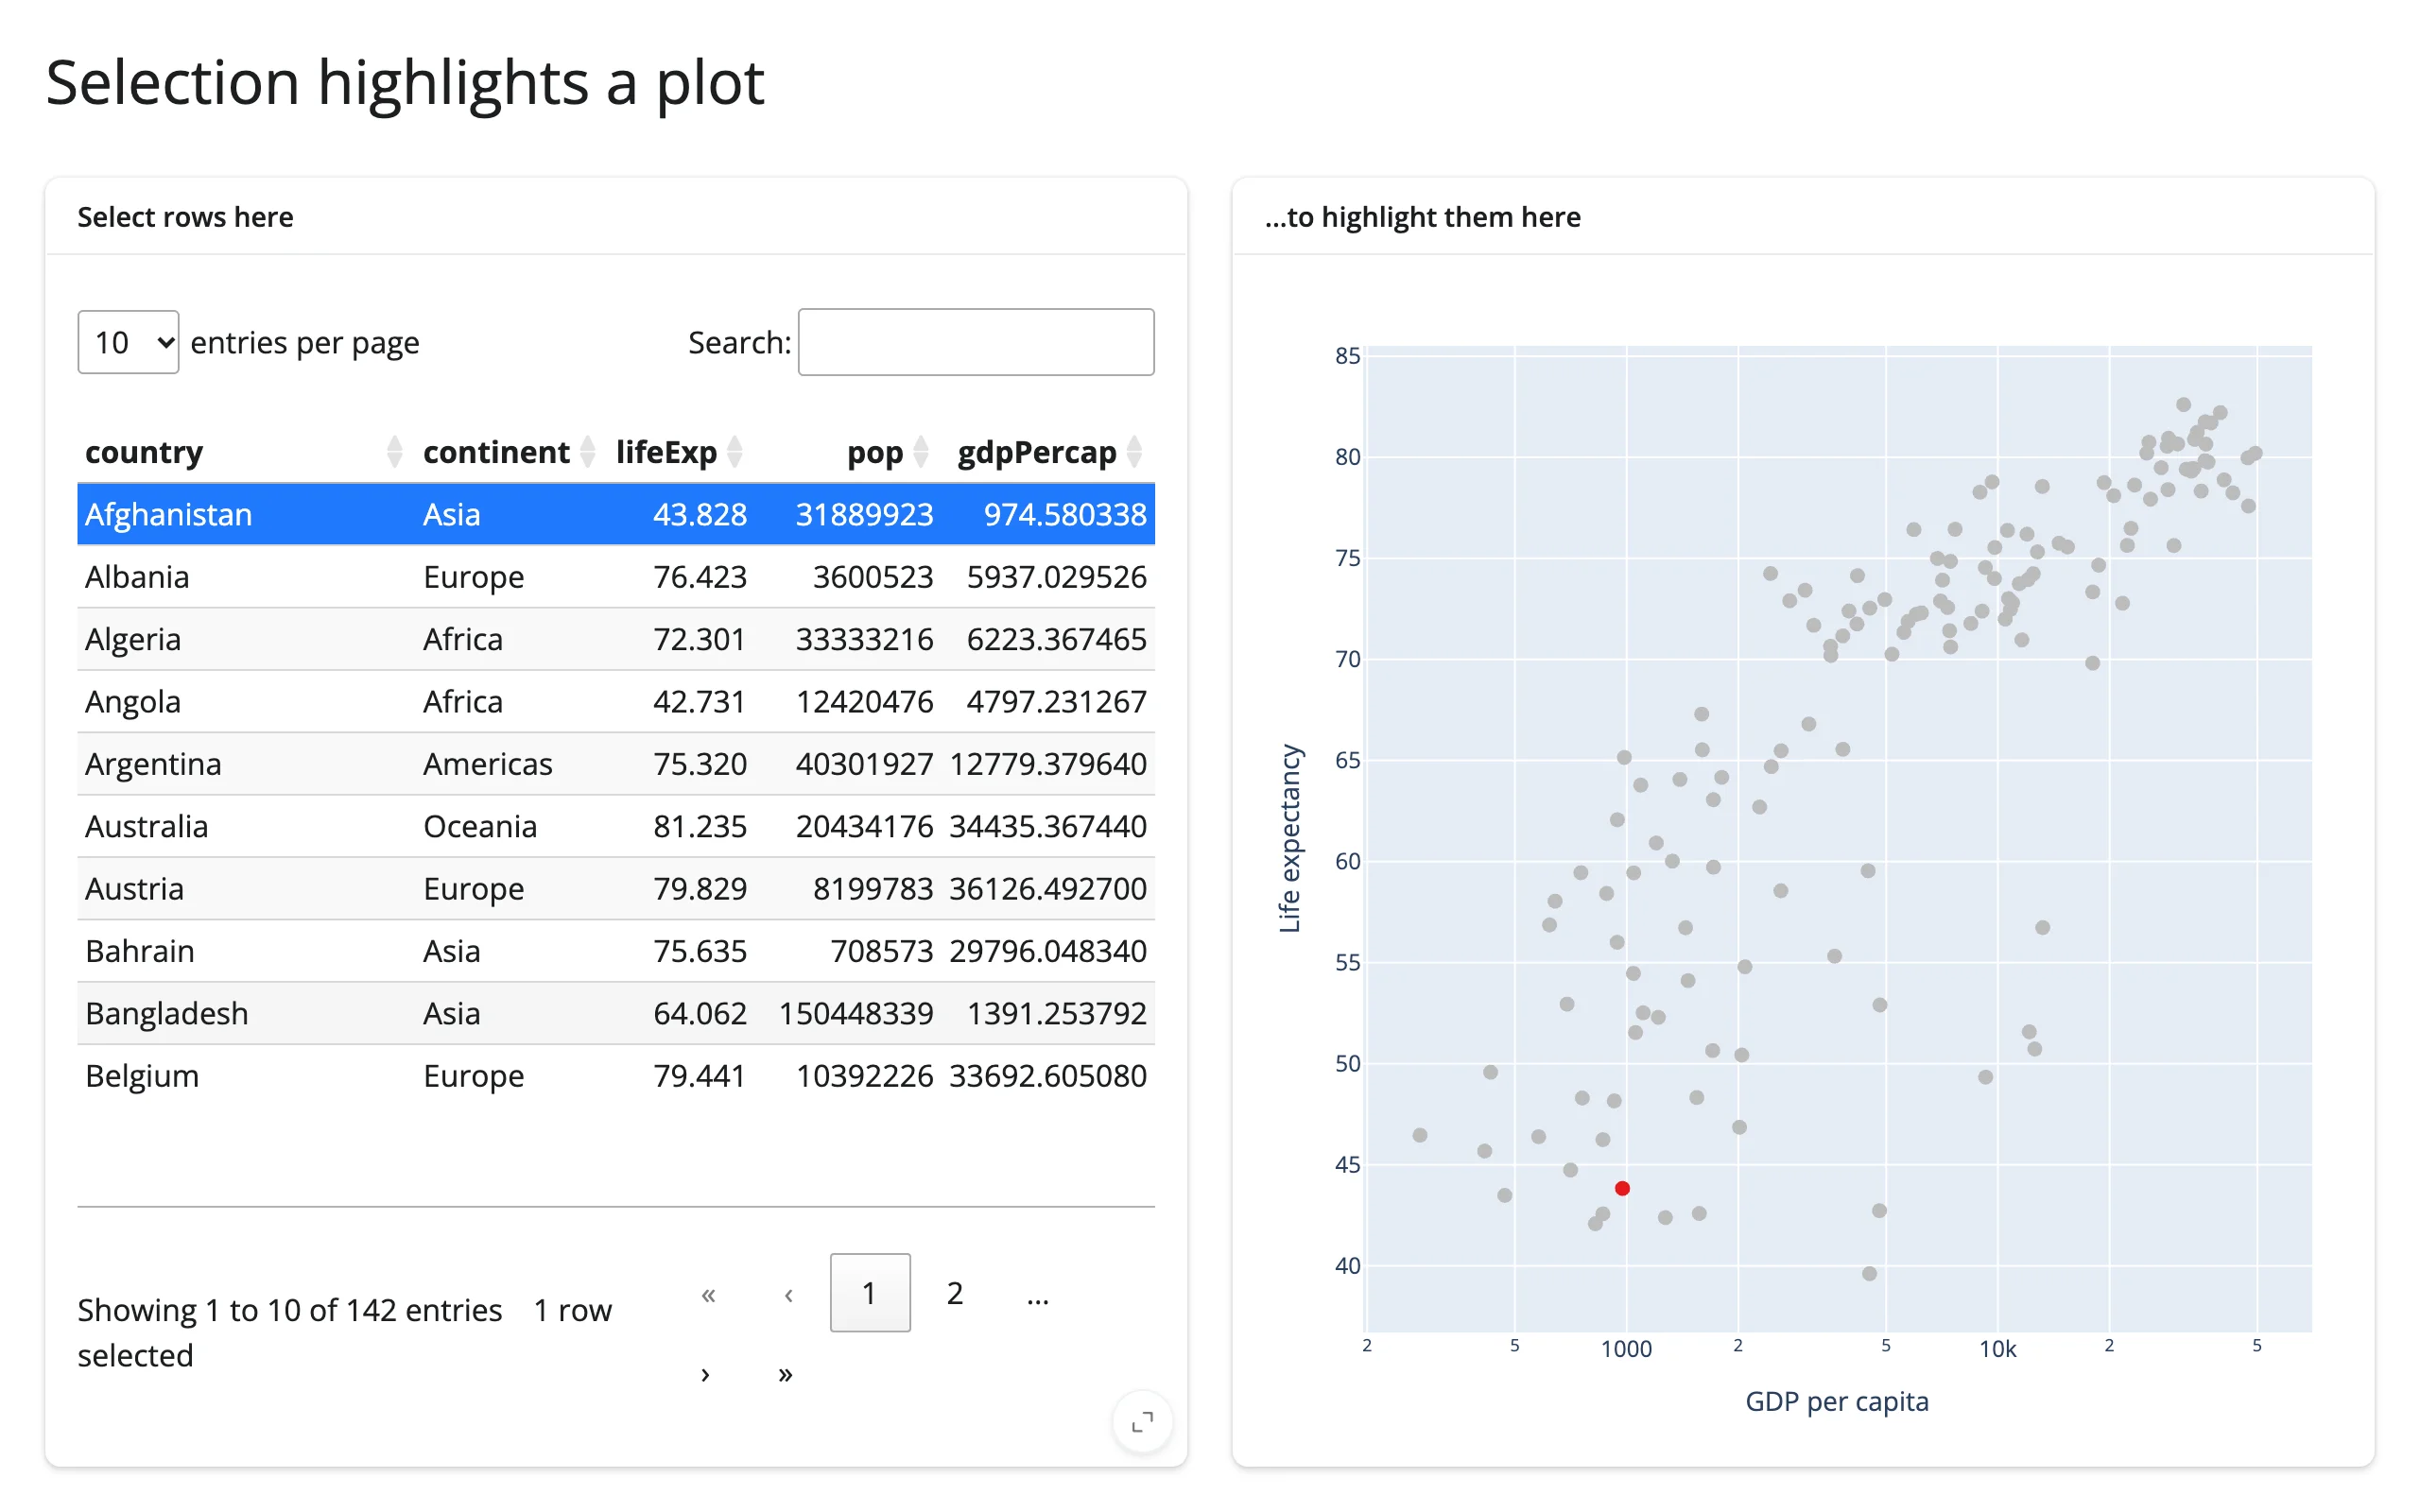
Select rows in a table and the matching points light up in a scatter plot, updated in place so pan/zoom state is preserved.
The “table row drives a plot highlight” cross-widget pattern, done the efficient way: instead of rebuilding the scatter plot on every selection change, an effect writes directly to scatter.widget.data[0].marker.color inside reactive.isolate(). The plot keeps its zoom/pan state across selections, and only a small trace update is sent to the browser – not the whole figure.
Run it
git clone --depth 1 https://github.com/posit-dev/py-shinywidgets
cd py-shinywidgets/website/gallery/templates/table-row-to-highlight
uv run shiny run app.py
Source: app.py · Open in Shinylive
Try it
- Select a row (or Ctrl/Cmd-click several) in the table on the left.
- Watch the matching point(s) turn red in the scatter plot on the right.
- Zoom or pan the plot first, then change the selection – the view doesn’t reset.
Accessors demonstrated
table.selected_rows()– the list of currently selected row positions in the itables table.
What to change for your own data
- Swap
countriesfor your own DataFrame and thex/ycolumns on the scatter. - The in-place color-array rewrite (
scatter.widget.data[0].marker.color = [...]) is the pattern to copy for any other per-point visual encoding (size, opacity, border) driven by a selection elsewhere on the page.
Credit
Promoted from docs/widget-guides/articles/linked-views/examples/09_itables_selection_to_plotly_inplace.py (the cross-cutting linked-views article), with a comment header added for gallery consistency; no logic changes (both cards already used full_screen=True).