import plotly.express as px
from querychat.data import titanic
from querychat.streamlit import QueryChat
import streamlit as st
qc = QueryChat(titanic(), "titanic")
qc.sidebar()
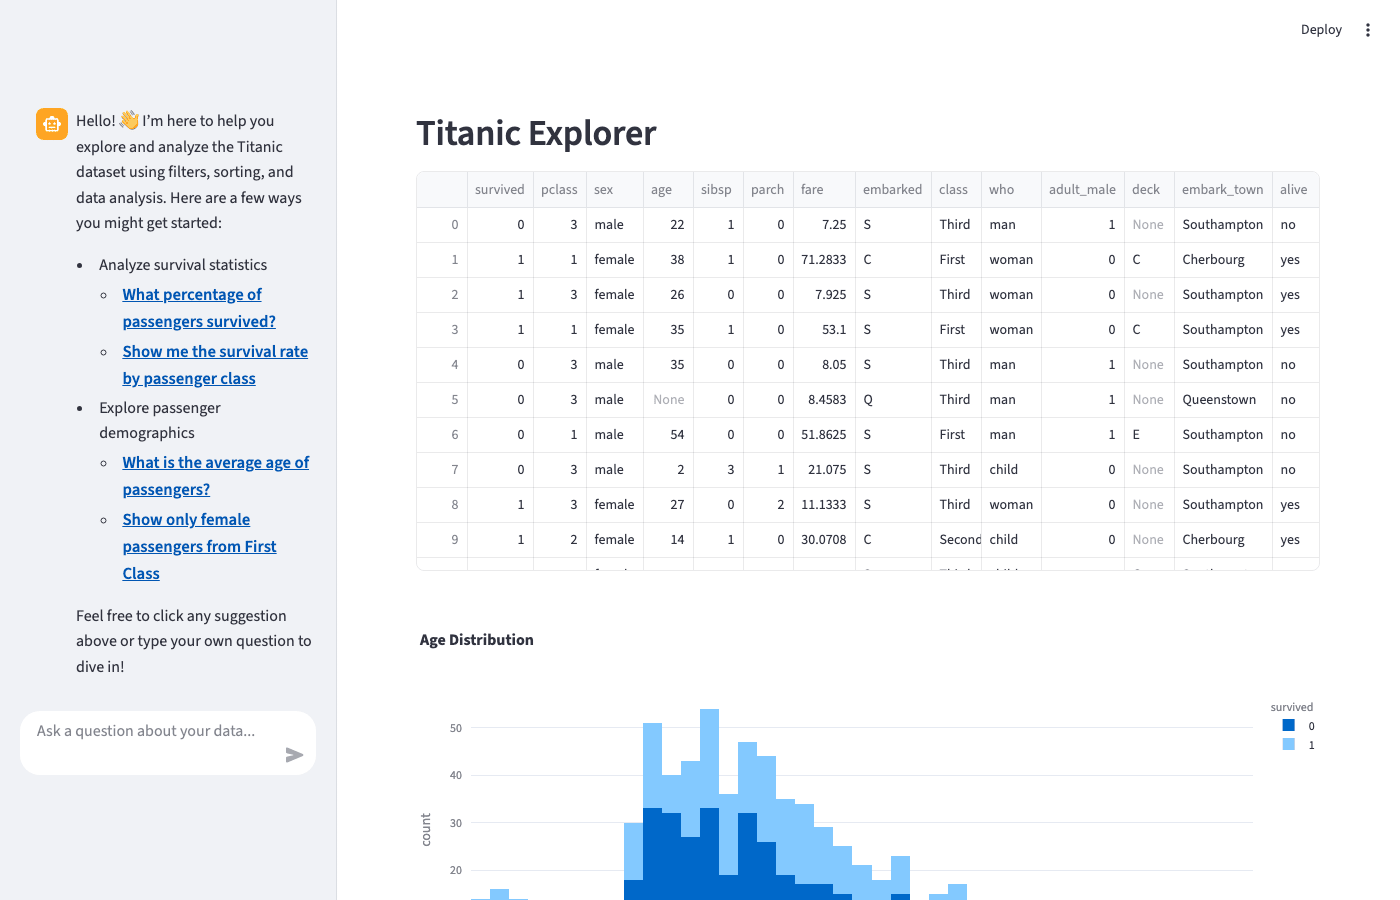
st.header(qc.title() or "Titanic Explorer")
st.dataframe(qc.df())
df = qc.df().to_pandas()
fig = px.histogram(df, x="age", color="survived", title="Age Distribution")
st.plotly_chart(fig)Streamlit
Streamlit is a web framework for interactive data/ML applications. It provides a simple scripting model that’s great for quickly assembling simple apps.
In this guide, you’ll learn how to build Streamlit apps with querychat to enable rich data exploration experiences where data views update based on natural language filters.
Initialize QueryChat
First, install querychat with Streamlit support:
pip install "querychat[streamlit]"Then import the Streamlit-specific QueryChat class:
from querychat.streamlit import QueryChatAnd initialize it with your data source:
from querychat.data import titanic

qc = QueryChat(titanic(), "titanic")
Quick start with
.app()
Remember, the simplest way to get started is with .app(), which gives a “pre-baked” Streamlit app:
streamlit-app.py
from querychat.streamlit import QueryChat
from querychat.data import titanic

qc = QueryChat(titanic(), "titanic")
qc.app()
Run with:
streamlit run streamlit-app.pyRelevant methods
After initializing QueryChat, use .sidebar() or .ui() to place the chat interface in your app. As users interact with the chat, .df(), .sql(), and .title() automatically update to reflect the current query.
| Method | Description |
|---|---|
.sidebar() |
Place the chat interface in Streamlit’s sidebar |
.ui() |
Returns just the chat component for custom placement |
.df() |
Current filtered/sorted DataFrame |
.sql() |
Current SQL query (str | None) |
.title() |
Short description of current filter (str | None) |
Custom chat UI
Use .ui() to place the chat anywhere in your layout. Here we use it to place custom content in the sidebar alongside the chat (like a reset button):
import streamlit as st
from querychat.streamlit import QueryChat
from querychat.data import titanic

qc = QueryChat(titanic(), "titanic")

with st.sidebar:
    qc.ui()
    st.divider()
    if st.button("Reset Filters"):
        qc.reset()

st.dataframe(qc.df())
Data views
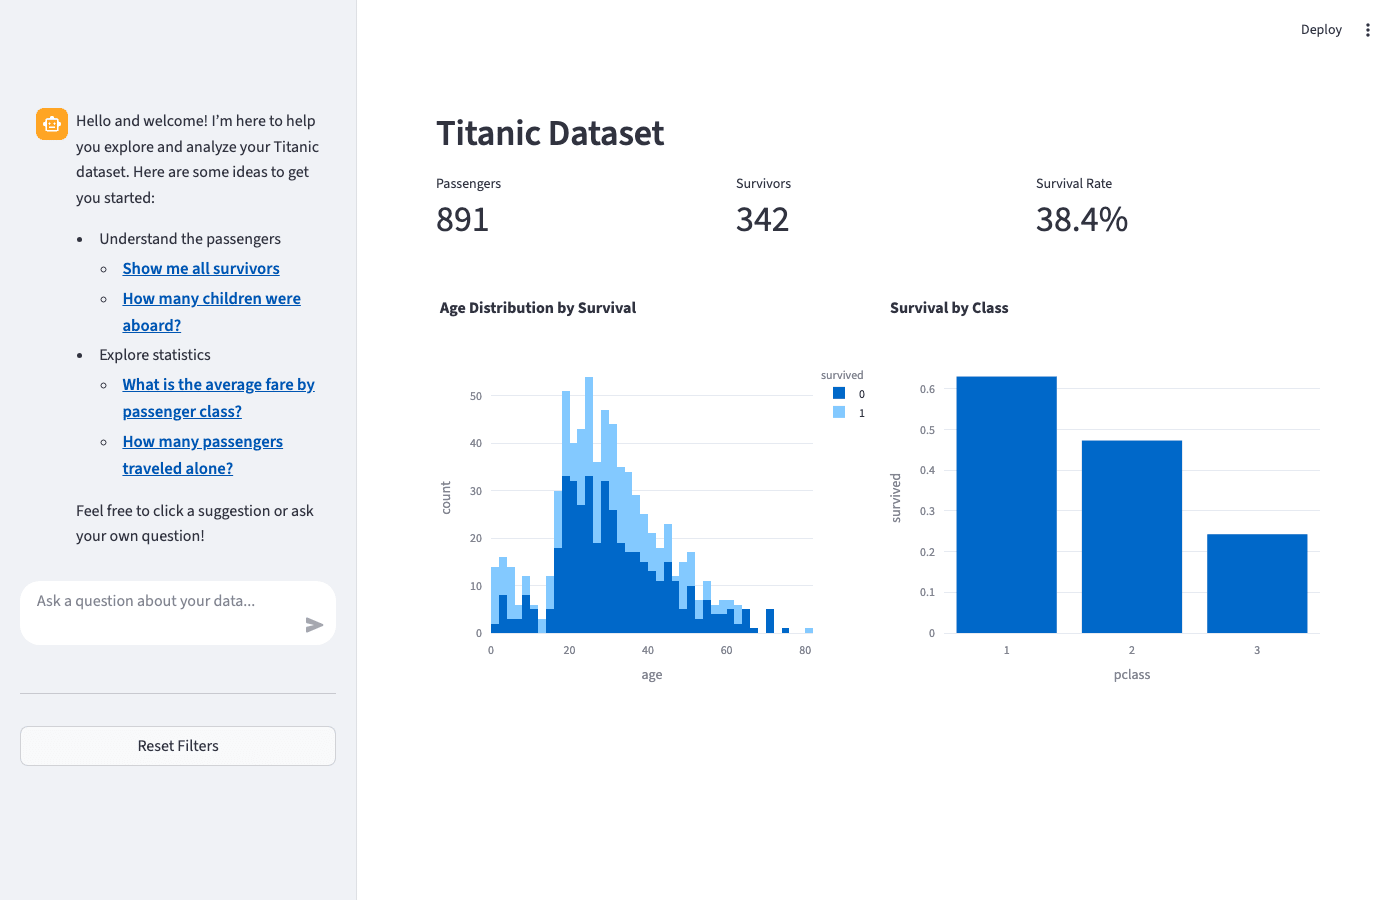
The real power of querychat comes from connecting it to visualizations. Here’s an example showing both filtered data and a chart:
When users filter data through the chat (e.g., “show only survivors”), both views update automatically.
A more complete example adds metrics:
streamlit-complete.py
import plotly.express as px
from querychat.data import titanic
from querychat.streamlit import QueryChat

import streamlit as st

st.set_page_config(page_title="Titanic Explorer", layout="wide")

qc = QueryChat(titanic(), "titanic")

# Sidebar with chat and reset
with st.sidebar:
    qc.ui()
    st.divider()
    if st.button("Reset Filters", use_container_width=True):
        qc.reset()

# Main content
st.header(qc.title() or "Titanic Dataset")

# Metrics row
df = qc.df().to_pandas()
col1, col2, col3 = st.columns(3)
col1.metric("Passengers", len(df))
col2.metric("Survivors", df["survived"].sum())
col3.metric("Survival Rate", f"{df['survived'].mean():.1%}")

# Visualizations
col1, col2 = st.columns(2)

with col1:
    fig1 = px.histogram(
        df, x="age", color="survived", title="Age Distribution by Survival"
    )
    st.plotly_chart(fig1, use_container_width=True)

with col2:
    fig2 = px.bar(
        df.groupby("pclass")["survived"].mean().reset_index(),
        x="pclass",
        y="survived",
        title="Survival by Class",
    )
    st.plotly_chart(fig2, use_container_width=True)
Resetting filters
Add a reset button to clear filters and show all data:
if st.button("Reset Filters"):
    qc.reset()  # Automatically triggers st.rerun()
Tip
Users can also ask the LLM to “reset” or “show all data” to clear filters through the chat interface.
Advanced patterns
Programmatic updates
You can update the query state programmatically using .sql() and .title() as setters. This is useful for adding preset filter buttons or linking filters to other UI controls.
Multiple datasets
To explore multiple datasets, use separate QueryChat instances (i.e., separate chat interfaces).
Multiple tables in one chat?
In some cases, you might be able to “pre-join” datasets into a single table and use one QueryChat instance to explore them together. In the future, we may support multiple filtered tables in one chat interface, but this is not currently available. Please upvote the relevant issue if this is a feature you’d like to see!
See also
- Greet users - Create welcoming onboarding experiences
- Provide context - Help the LLM understand your data better