Dash

Dash is a web framework for building interactive data applications. It provides a callback-based programming model that is designed for scaling to heavy load with simple infrastructure.

In this guide, you’ll learn how to build Dash apps with querychat to enable rich data exploration experiences where data views update based on natural language filters.

Screenshot of querychat running in a custom Dash app.

Initialize QueryChat

First, install querychat with Dash support:

pip install "querychat[dash]"

Then import the Dash-specific QueryChat class:

from querychat.dash import QueryChat

And initialize it with your data source:

from querychat.data import titanic

qc = QueryChat(titanic(), "titanic")

Remember, the simplest way to get started is with .app(), which gives a “pre-baked” Dash app:

dash-app.py
from querychat.dash import QueryChat
from querychat.data import titanic

qc = QueryChat(titanic(), "titanic")
app = qc.app()

if __name__ == "__main__":
    app.run(debug=True)

Run with:

python dash-app.py

Relevant methods

After initializing QueryChat, use .ui() to place the chat interface in your layout, then call .init_app(app) to register querychat’s callbacks. As users interact with the chat, the store at .store_id updates automatically. Use Input(qc.store_id, "data") in your callbacks, then access values with .df(state), .sql(state), and .title(state).

Method Description
.ui() Returns the chat UI component
.init_app(app) Registers querychat’s internal callbacks on your Dash app
.store_id ID of the dcc.Store component holding query state
.df(state) Current filtered/sorted DataFrame
.sql(state) Current SQL query (str | None)
.title(state) Short description of current filter (str | None)

Basic layout

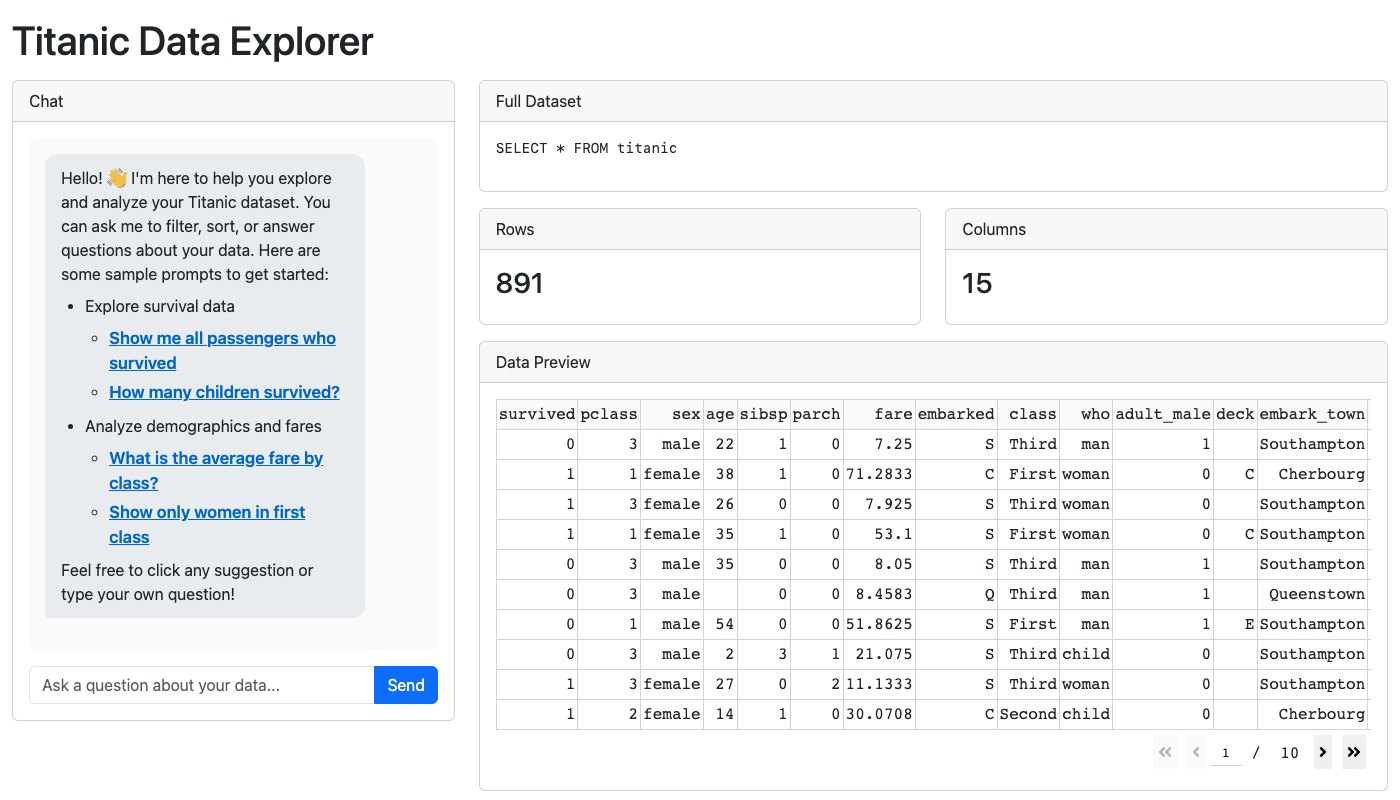
The most common pattern places chat alongside your custom filtered views:

dash-custom.py
import dash_ag_grid as dag
import dash_bootstrap_components as dbc
from querychat.dash import QueryChat
from querychat.data import titanic
from querychat.types import AppStateDict

from dash import Dash, Input, Output, html

qc = QueryChat(titanic(), "titanic")

app = Dash(__name__, external_stylesheets=[dbc.themes.BOOTSTRAP])

app.layout = dbc.Container(
    [
        dbc.Row(
            [
                # Left column: Chat
                dbc.Col(qc.ui(), width=4),
                # Right column: Data display
                dbc.Col(
                    [
                        html.H3(id="data-title"),
                        dag.AgGrid(
                            id="data-table",
                            className="ag-theme-balham",
                            defaultColDef={"filter": True, "sortable": True},
                            dashGridOptions={
                                "pagination": True,
                                "paginationPageSize": 10,
                            },
                            columnSize="responsiveSizeToFit",
                        ),
                        html.Pre(id="sql-display"),
                    ],
                    width=8,
                ),
            ]
        )
    ],
    fluid=True,
)

# Register querychat's internal callbacks
qc.init_app(app)


# Add your own callbacks using qc.store_id
@app.callback(
    [
        Output("data-title", "children"),
        Output("data-table", "rowData"),
        Output("data-table", "columnDefs"),
        Output("sql-display", "children"),
    ],
    Input(qc.store_id, "data"),
)
def update_display(state: AppStateDict):
    df = qc.df(state).to_pandas()
    sql = qc.sql(state) or f"SELECT * FROM {qc.data_source.table_name}"
    title = qc.title(state) or "All Data"

    columns = [{"field": c} for c in df.columns]
    return title, df.to_dict("records"), columns, sql


if __name__ == "__main__":
    app.run(debug=True)

Screenshot of custom Dash layout.

Data views

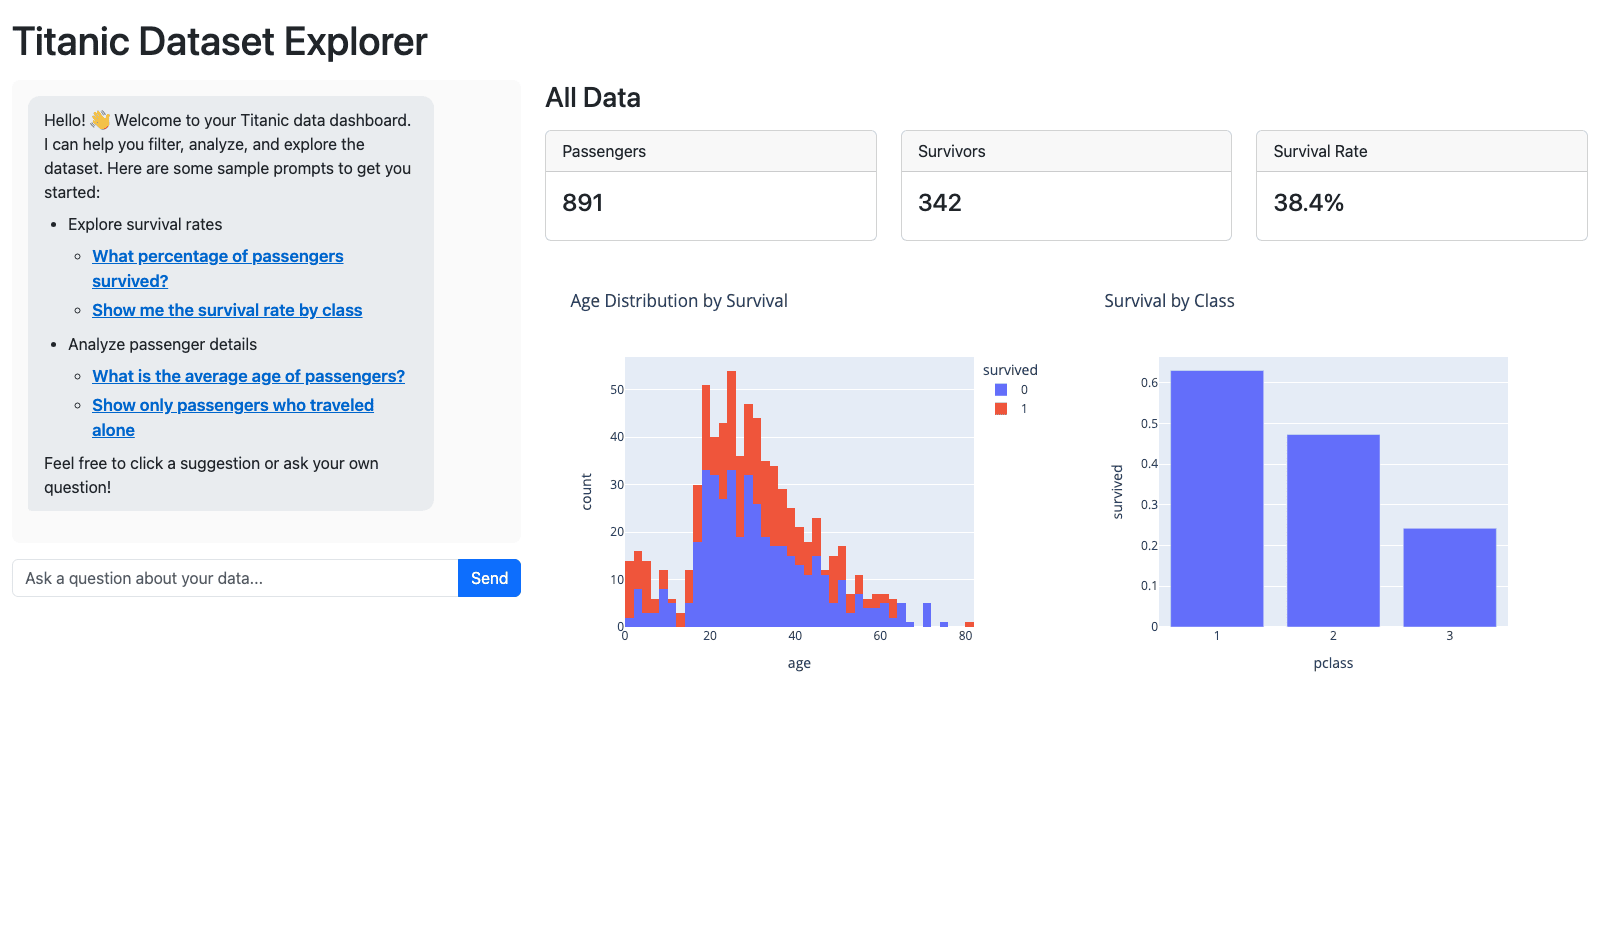
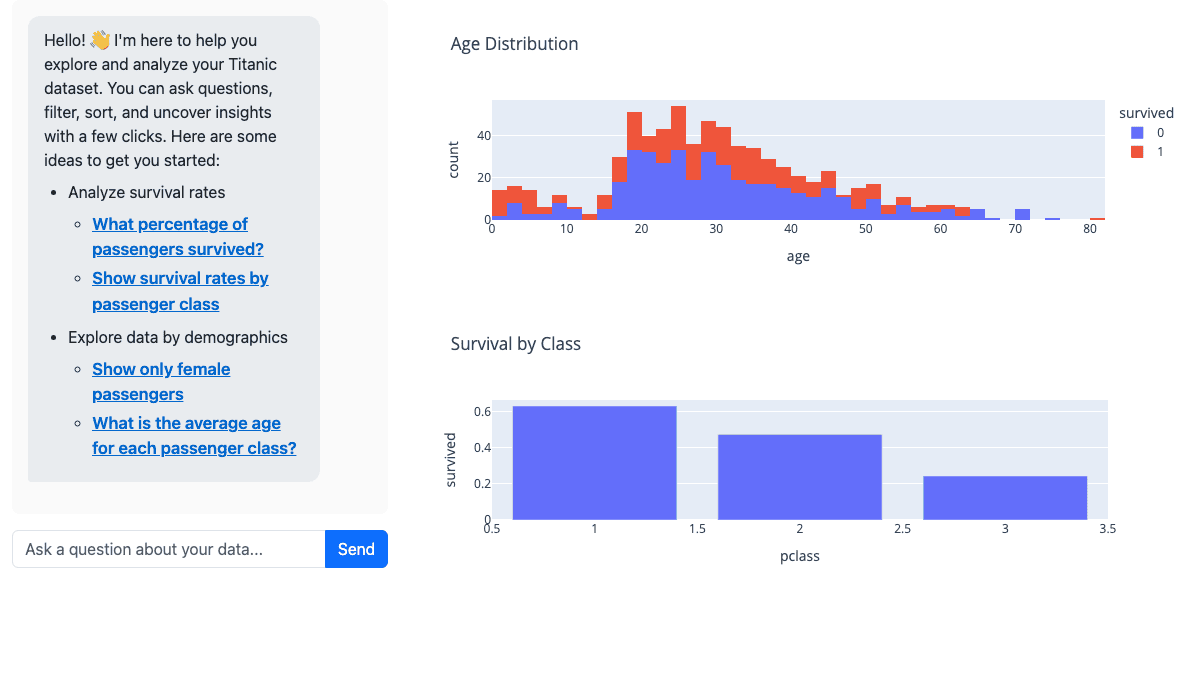
The real power of querychat comes from connecting it to visualizations. Here’s an example showing both filtered data and charts:

import dash_bootstrap_components as dbc
import plotly.express as px
from querychat.dash import QueryChat
from querychat.data import titanic
from querychat.types import AppStateDict

from dash import Dash, Input, Output, dcc

qc = QueryChat(titanic(), "titanic")

app = Dash(__name__, external_stylesheets=[dbc.themes.BOOTSTRAP])

app.layout = dbc.Container(
    [
        dbc.Row(
            [
                dbc.Col(qc.ui(), width=4),
                dbc.Col(
                    [
                        dcc.Graph(id="age-histogram"),
                        dcc.Graph(id="class-survival"),
                    ],
                    width=8,
                ),
            ]
        )
    ],
    fluid=True,
)

qc.init_app(app)


@app.callback(
    [Output("age-histogram", "figure"), Output("class-survival", "figure")],
    Input(qc.store_id, "data"),
)
def update_charts(state: AppStateDict):
    df = qc.df(state).to_pandas()
    fig1 = px.histogram(df, x="age", color="survived", title="Age Distribution")
    fig2 = px.bar(
        df.groupby("pclass")["survived"].mean().reset_index(),
        x="pclass",
        y="survived",
        title="Survival by Class",
    )
    return fig1, fig2


if __name__ == "__main__":
    app.run(debug=True)

When users filter data through the chat (e.g., “show only survivors”), both charts update automatically.

Screenshot of Dash data views example.

A more complete example adds metrics:

dash-complete.py
import dash_bootstrap_components as dbc
import plotly.express as px
from querychat.dash import QueryChat
from querychat.data import titanic
from querychat.types import AppStateDict

from dash import Dash, Input, Output, dcc, html

qc = QueryChat(titanic(), "titanic")

app = Dash(__name__, external_stylesheets=[dbc.themes.BOOTSTRAP])

app.layout = dbc.Container(
    [
        html.H1("Titanic Dataset Explorer", className="my-3"),
        dbc.Row(
            [
                dbc.Col(qc.ui(), width=4),
                dbc.Col(
                    [
                        html.H3(id="data-title", className="mb-3"),
                        dbc.Row(
                            [
                                dbc.Col(
                                    dbc.Card(
                                        [
                                            dbc.CardHeader("Passengers"),
                                            dbc.CardBody(
                                                html.H4(id="metric-passengers")
                                            ),
                                        ]
                                    )
                                ),
                                dbc.Col(
                                    dbc.Card(
                                        [
                                            dbc.CardHeader("Survivors"),
                                            dbc.CardBody(
                                                html.H4(id="metric-survivors")
                                            ),
                                        ]
                                    )
                                ),
                                dbc.Col(
                                    dbc.Card(
                                        [
                                            dbc.CardHeader("Survival Rate"),
                                            dbc.CardBody(html.H4(id="metric-rate")),
                                        ]
                                    )
                                ),
                            ],
                            className="mb-3",
                        ),
                        dbc.Row(
                            [
                                dbc.Col(dcc.Graph(id="age-chart")),
                                dbc.Col(dcc.Graph(id="class-chart")),
                            ]
                        ),
                    ],
                    width=8,
                ),
            ]
        ),
    ],
    fluid=True,
)

qc.init_app(app)


@app.callback(
    [
        Output("data-title", "children"),
        Output("metric-passengers", "children"),
        Output("metric-survivors", "children"),
        Output("metric-rate", "children"),
        Output("age-chart", "figure"),
        Output("class-chart", "figure"),
    ],
    Input(qc.store_id, "data"),
)
def update_all(state: AppStateDict):
    df = qc.df(state).to_pandas()
    title = qc.title(state) or "All Data"

    # Metrics
    n_passengers = len(df)
    n_survivors = int(df["survived"].sum())
    survival_rate = f"{df['survived'].mean():.1%}"

    # Charts
    fig1 = px.histogram(
        df, x="age", color="survived", title="Age Distribution by Survival"
    )
    fig2 = px.bar(
        df.groupby("pclass")["survived"].mean().reset_index(),
        x="pclass",
        y="survived",
        title="Survival by Class",
    )

    return (
        title,
        n_passengers,
        n_survivors,
        survival_rate,
        fig1,
        fig2,
    )


if __name__ == "__main__":
    import os

    port = int(os.environ.get("DASH_PORT", "8050"))
    debug = os.environ.get("DASH_DEBUG", "true").lower() == "true"
    app.run(debug=debug, port=port)

Screenshot of complete Dash app with querychat.

Resetting filters

Add a reset button to show all data by fetching the original data from qc.data_source.get_data():

reset_btn = html.Button("Reset", id="reset-btn")

@app.callback(
    Output("data-table", "rowData"),
    [Input(qc.store_id, "data"), Input("reset-btn", "n_clicks")],
)
def update_table(state, n_clicks):
    from dash import callback_context
    if callback_context.triggered_id == "reset-btn":
        return qc.data_source.get_data().to_pandas().to_dict("records")
    return qc.df(state).to_pandas().to_dict("records")
Tip

This resets the data display only. Users can also ask the LLM to “reset” or “show all data” to clear filters through the chat interface.

Advanced patterns

Programmatic updates

You can update the display programmatically by creating callbacks that execute queries directly:

@app.callback(
    Output("data-table", "rowData"),
    Output("data-title", "children"),
    Input("preset-survivors", "n_clicks"),
    prevent_initial_call=True
)
def apply_preset_filter(n_clicks):
    df = qc.data_source.execute_query(
        "SELECT * FROM titanic WHERE survived = 1"
    )
    return df.to_pandas().to_dict("records"), "Survivors only"

Multiple datasets

To explore multiple datasets, use separate QueryChat instances (i.e., separate chat interfaces).

Multiple tables in one chat?

In some cases, you might be able to “pre-join” datasets into a single table and use one QueryChat instance to explore them together. In the future, we may support multiple filtered tables in one chat interface, but this is not currently available. Please upvote the relevant issue if this is a feature you’d like to see!

See also