import plotly.express as px
from querychat.data import titanic
from querychat.gradio import QueryChat
from querychat.types import AppStateDict
import gradio as gr
qc = QueryChat(titanic(), "titanic")
with gr.Blocks() as app:
with gr.Row():
with gr.Column():
state = qc.ui()
with gr.Column():
plot1 = gr.Plot(label="Age Distribution")
plot2 = gr.Plot(label="Survival by Class")
def update_views(state_dict: AppStateDict):
df = qc.df(state_dict).to_pandas()
fig1 = px.histogram(df, x="age", color="survived", title="Age Distribution")
fig2 = px.bar(
df.groupby("pclass")["survived"].mean().reset_index(),
x="pclass",
y="survived",
title="Survival by Class",
)
return fig1, fig2
state.change(fn=update_views, inputs=[state], outputs=[plot1, plot2])
app.launch(css=qc.css, head=qc.head)Gradio
Gradio is a web framework for building interactive data/ML applications. It provides a event-based programming model that’s great for quickly assembling simple UIs.
In this guide, you’ll learn how to build Gradio apps with querychat to enable rich data exploration experiences where data views update based on natural language filters.
Initialize QueryChat
First, install querychat with Gradio support:
pip install "querychat[gradio]"Then import the Gradio-specific QueryChat class:
from querychat.gradio import QueryChatAnd initialize it with your data source:
from querychat.data import titanic

qc = QueryChat(titanic(), "titanic")
Quick start with
.app()
Remember, the simplest way to get started is with .app(), which gives a “pre-baked” Gradio app:
gradio-app.py
from querychat.gradio import QueryChat
from querychat.data import titanic

qc = QueryChat(titanic(), "titanic")
app = qc.app()
app.launch()
Run with:
python gradio-app.pyRelevant methods
After initializing QueryChat, use .ui() to place the chat interface in your gr.Blocks layout. It creates the chat components and returns a gr.State that updates as users interact with the chat. Use .df(state), .sql(state), and .title(state) in your callbacks to access the current query values.
| Method | Description |
|---|---|
.ui() |
Creates chat UI and returns gr.State for wiring to callbacks |
.df(state) |
Current filtered/sorted DataFrame |
.sql(state) |
Current SQL query (str | None) |
.title(state) |
Short description of current filter (str | None) |
Why
css=qc.css, head=qc.head?
The qc.css and qc.head properties provide the CSS and JavaScript needed for clickable suggestions in chat messages. Always include these when building custom layouts with .ui().
Basic layout
The most common pattern places chat alongside your custom filtered views:
import gradio as gr
from querychat.gradio import QueryChat
from querychat.data import titanic
from querychat.types import AppStateDict

qc = QueryChat(titanic(), "titanic")

with gr.Blocks() as app:
    with gr.Row():
        with gr.Column():
            state = qc.ui()

        with gr.Column():
            data_table = gr.Dataframe(label="Data")

    def update_table(state_dict: AppStateDict):
        return qc.df(state_dict).to_pandas()

    state.change(fn=update_table, inputs=[state], outputs=[data_table])

app.launch(css=qc.css, head=qc.head)
Data views
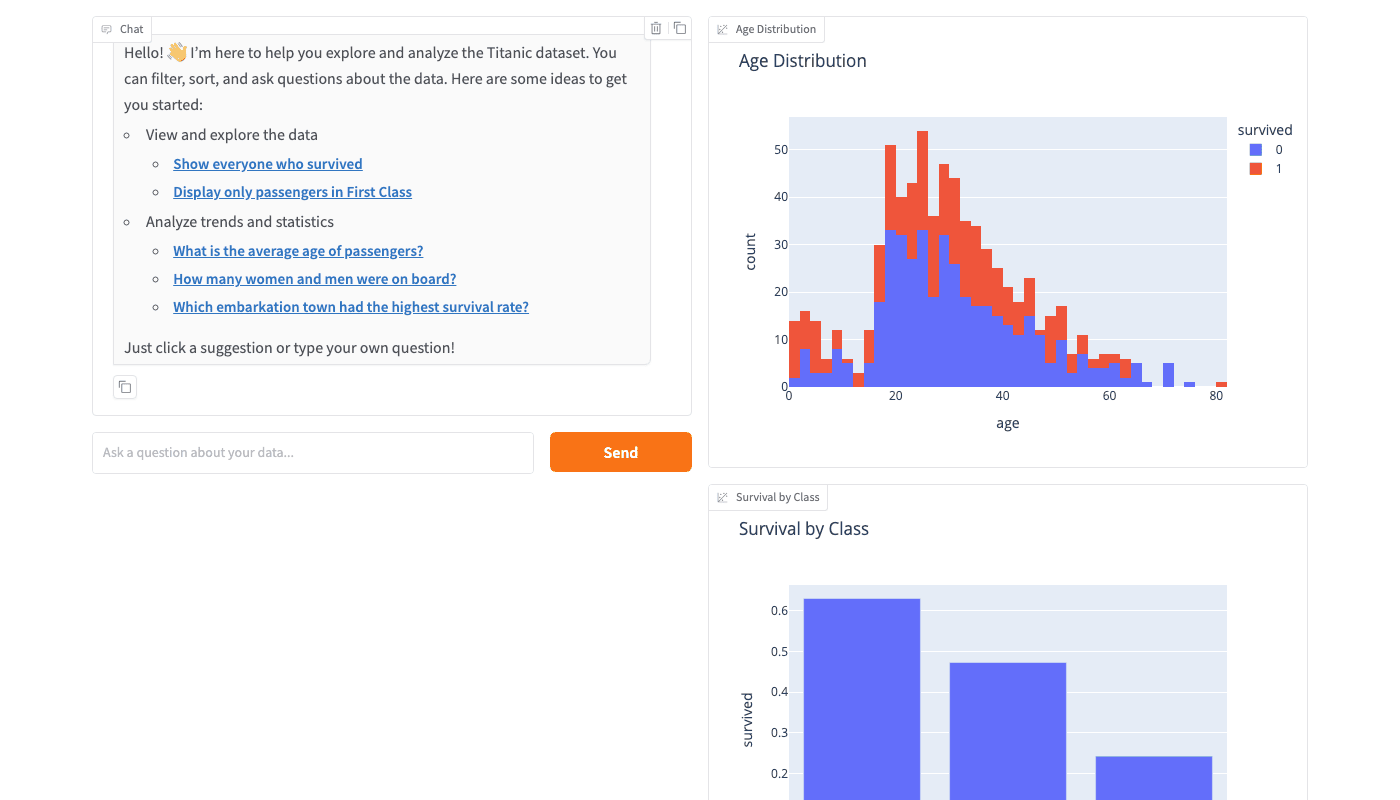
The real power of querychat comes from connecting it to visualizations. Here’s an example showing two charts that respond to query changes:
When users filter data through the chat (e.g., “show only survivors”), both charts update automatically.
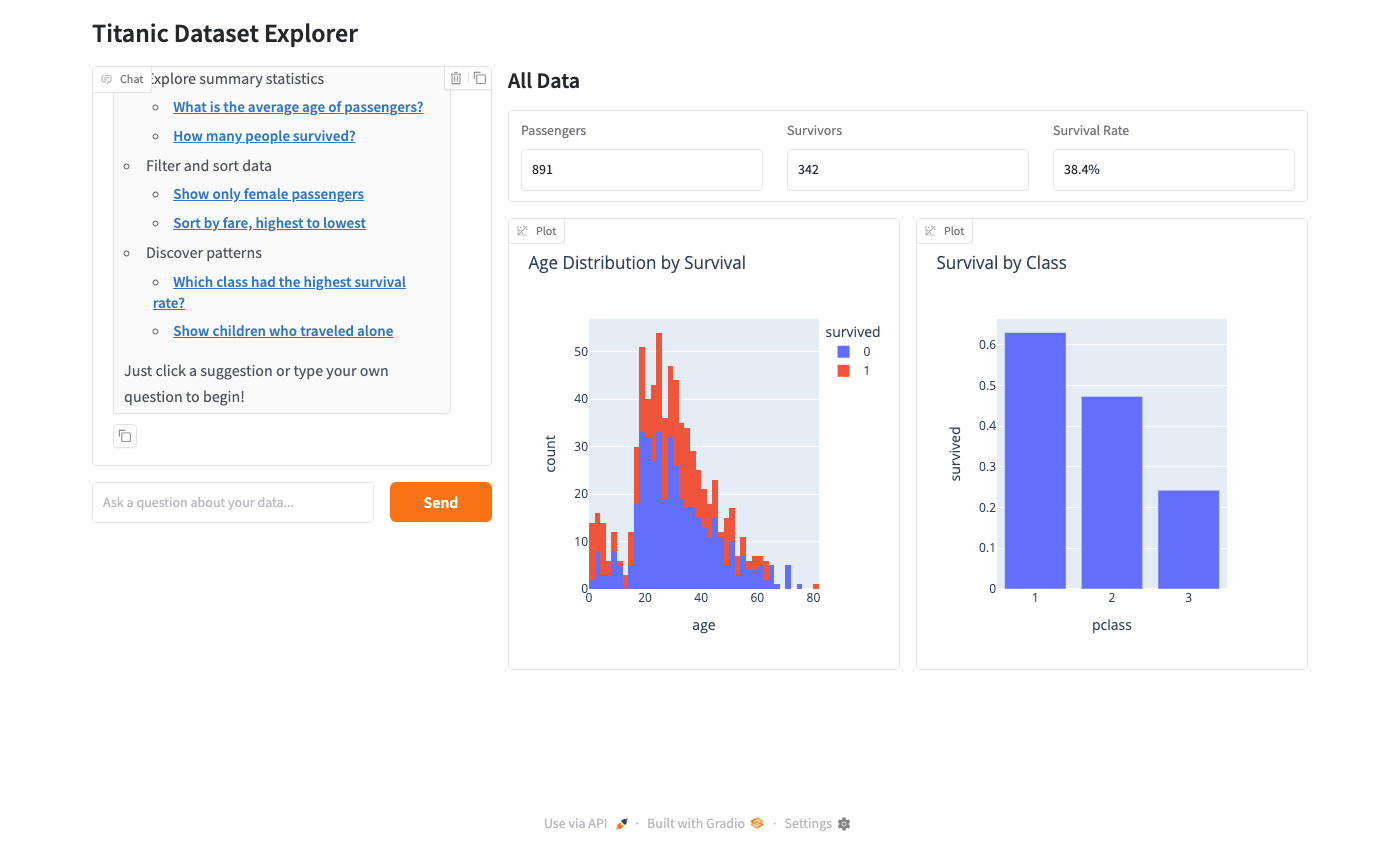
A more complete example adds metrics:
gradio-complete.py
import plotly.express as px
from querychat.data import titanic
from querychat.gradio import QueryChat
from querychat.types import AppStateDict

import gradio as gr

qc = QueryChat(titanic(), "titanic")

with gr.Blocks(title="Titanic Explorer") as app:
    gr.Markdown("# Titanic Dataset Explorer")

    with gr.Row():
        with gr.Column(scale=1):
            state = qc.ui()

        with gr.Column(scale=2):
            title_display = gr.Markdown("## All Data")

            with gr.Row():
                passengers_box = gr.Textbox(label="Passengers", interactive=False)
                survivors_box = gr.Textbox(label="Survivors", interactive=False)
                rate_box = gr.Textbox(label="Survival Rate", interactive=False)

            with gr.Row():
                plot1 = gr.Plot()
                plot2 = gr.Plot()

    def update_all(state_dict: AppStateDict):
        df = qc.df(state_dict).to_pandas()
        title = qc.title(state_dict) or "All Data"

        # Metrics
        n_passengers = str(len(df))
        n_survivors = str(int(df["survived"].sum()))
        survival_rate = f"{df['survived'].mean():.1%}"

        # Visualizations
        fig1 = px.histogram(
            df, x="age", color="survived", title="Age Distribution by Survival"
        )
        fig2 = px.bar(
            df.groupby("pclass")["survived"].mean().reset_index(),
            x="pclass",
            y="survived",
            title="Survival by Class",
        )

        return (
            f"## {title}",
            n_passengers,
            n_survivors,
            survival_rate,
            fig1,
            fig2,
        )

    state.change(
        fn=update_all,
        inputs=[state],
        outputs=[
            title_display,
            passengers_box,
            survivors_box,
            rate_box,
            plot1,
            plot2,
        ],
    )

app.launch(css=qc.css, head=qc.head)
Resetting filters
Add a reset button to show all data by fetching the original data from qc.data_source.get_data():
reset_btn = gr.Button("Reset")

def reset_data():
    return qc.data_source.get_data().to_pandas()

reset_btn.click(fn=reset_data, outputs=[data_table])
Tip
This resets the data display only. Users can also ask the LLM to “reset” or “show all data” to clear filters through the chat interface.
Advanced patterns
Programmatic updates
You can update the display programmatically by creating event handlers that modify your output components directly.
Multiple datasets
To explore multiple datasets, use separate QueryChat instances (i.e., separate chat interfaces).
Multiple tables in one chat?
In some cases, you might be able to “pre-join” datasets into a single table and use one QueryChat instance to explore them together. In the future, we may support multiple filtered tables in one chat interface, but this is not currently available. Please upvote the relevant issue if this is a feature you’d like to see!
See also
- Greet users - Create welcoming onboarding experiences
- Provide context - Help the LLM understand your data better