import pandas as pd
from plotnine import ggplot, aes, geom_point
from palmerpenguins import load_penguins
import seaborn as sns

penguins = load_penguins()
penguins.shape
(344, 8)Example script and output before putting it into a Quarto report.
import pandas as pd
from plotnine import ggplot, aes, geom_point
from palmerpenguins import load_penguins
import seaborn as sns
penguins = load_penguins()
penguins.shape(344, 8)# drop rows with missing values
penguins = penguins.dropna()
penguins.shape(333, 8)# gentoo is easier to separate
# eda to find variables to separate Adelie
# bill_depth_mm and body_mass_g are good separators
# bill_depth_mm and flipper_length_mm are good separators
# body_mass_g and flipper_length_mm are NOT good separators
sns.pairplot(penguins, hue="species")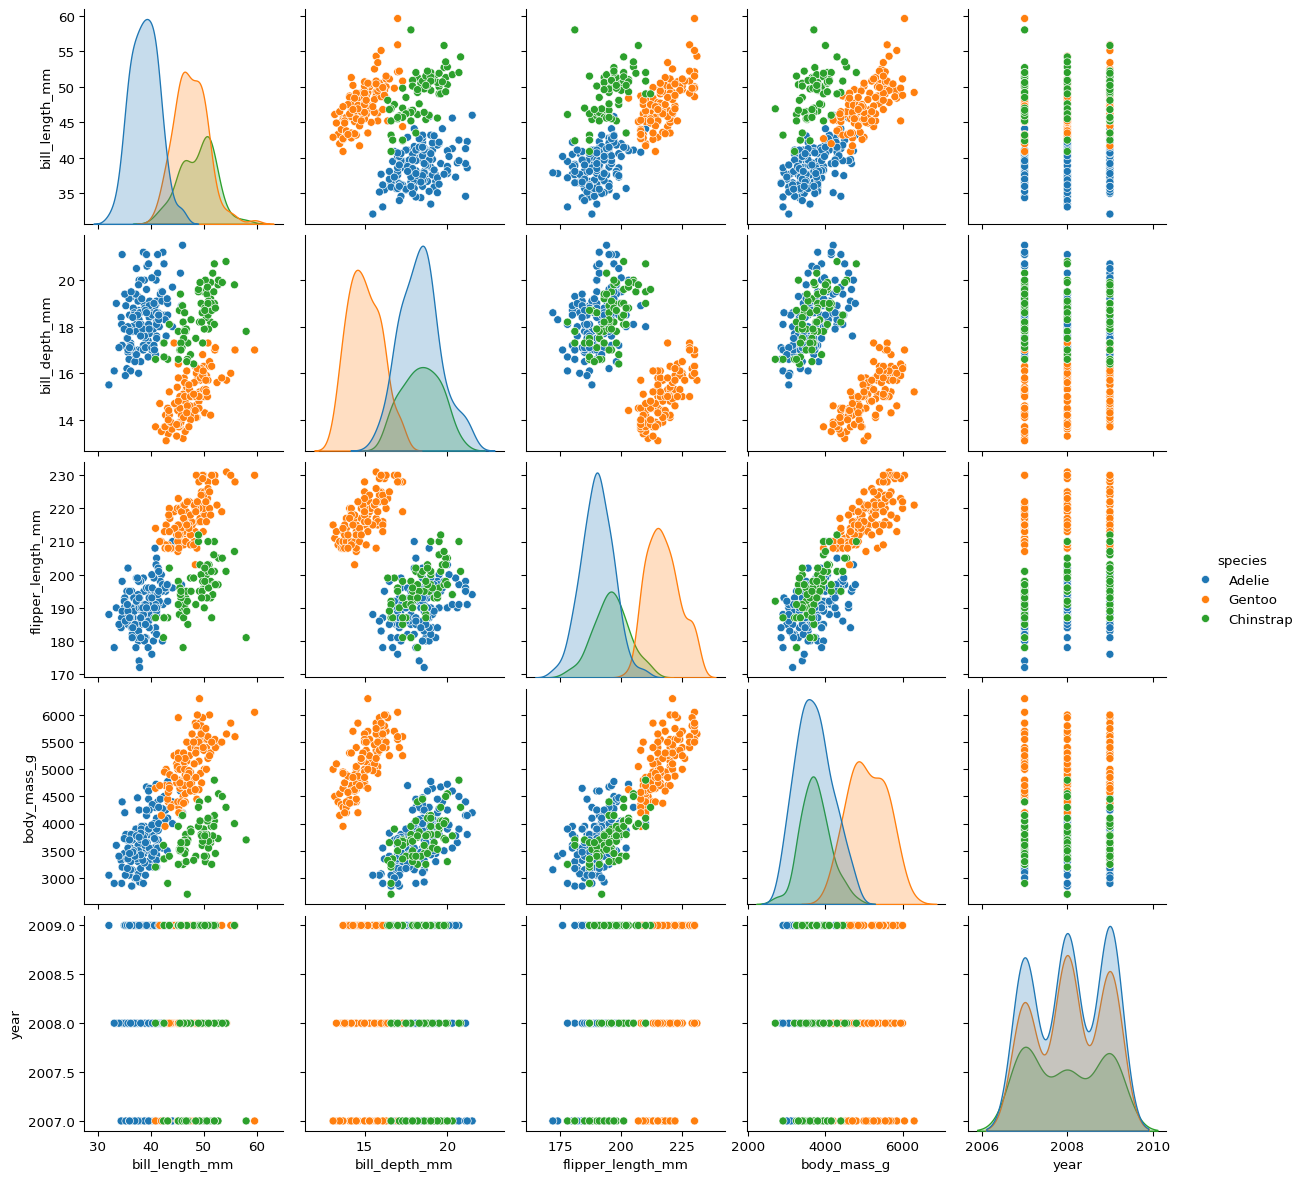
# fit logistic regression model
import statsmodels.api as sm
import statsmodels.formula.api as smf

# recode variable
penguins['is_adelie'] = (penguins['species'] == 'Adelie').astype(int)

# logistic regression
model = smf.logit("is_adelie ~  bill_depth_mm + body_mass_g + flipper_length_mm", data=penguins).fit()
print(model.summary())
Optimization terminated successfully.
Current function value: 0.352072
Iterations 8
Logit Regression Results
==============================================================================
Dep. Variable: is_adelie No. Observations: 333
Model: Logit Df Residuals: 329
Method: MLE Df Model: 3
Date: Mon, 16 Jun 2025 Pseudo R-squ.: 0.4864
Time: 21:04:28 Log-Likelihood: -117.24
converged: True LL-Null: -228.29
Covariance Type: nonrobust LLR p-value: 7.076e-48
=====================================================================================
coef std err z P>|z| [0.025 0.975]
-------------------------------------------------------------------------------------
Intercept 30.1600 5.603 5.383 0.000 19.178 41.142
bill_depth_mm 0.3953 0.121 3.255 0.001 0.157 0.633
body_mass_g 0.0006 0.000 1.271 0.204 -0.000 0.001
flipper_length_mm -0.2007 0.031 -6.445 0.000 -0.262 -0.140
=====================================================================================# model results
model.params.to_frame("Estimate")| Estimate | |
|---|---|
| Intercept | 30.160015 |
| bill_depth_mm | 0.395328 |
| body_mass_g | 0.000554 |
| flipper_length_mm | -0.200743 |
# predicted probabilities for first few rows
penguins["predicted"] = model.predict()
penguins[["species", "predicted"]].head()| species | predicted | |
|---|---|---|
| 0 | Adelie | 0.964279 |
| 1 | Adelie | 0.858842 |
| 2 | Adelie | 0.482890 |
| 4 | Adelie | 0.722669 |
| 5 | Adelie | 0.898866 |
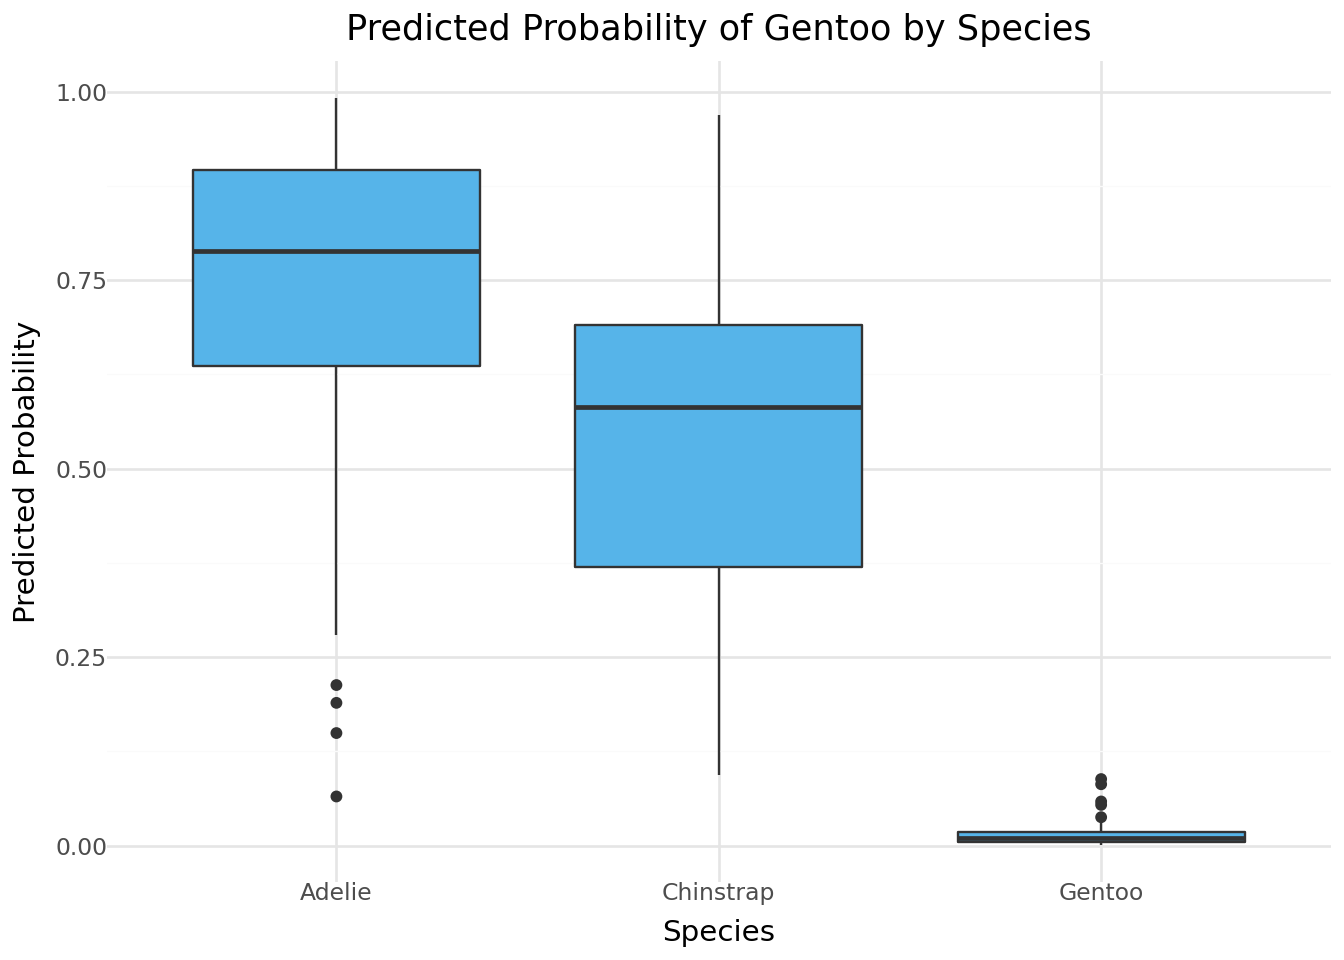
penguins['pred_prob'] = model.predict()from plotnine import *
(
ggplot(penguins, aes(x='species', y='pred_prob')) +
geom_boxplot(fill='#56B4E9') +
labs(title="Predicted Probability of Gentoo by Species",
y="Predicted Probability", x="Species") +
theme_minimal()
)
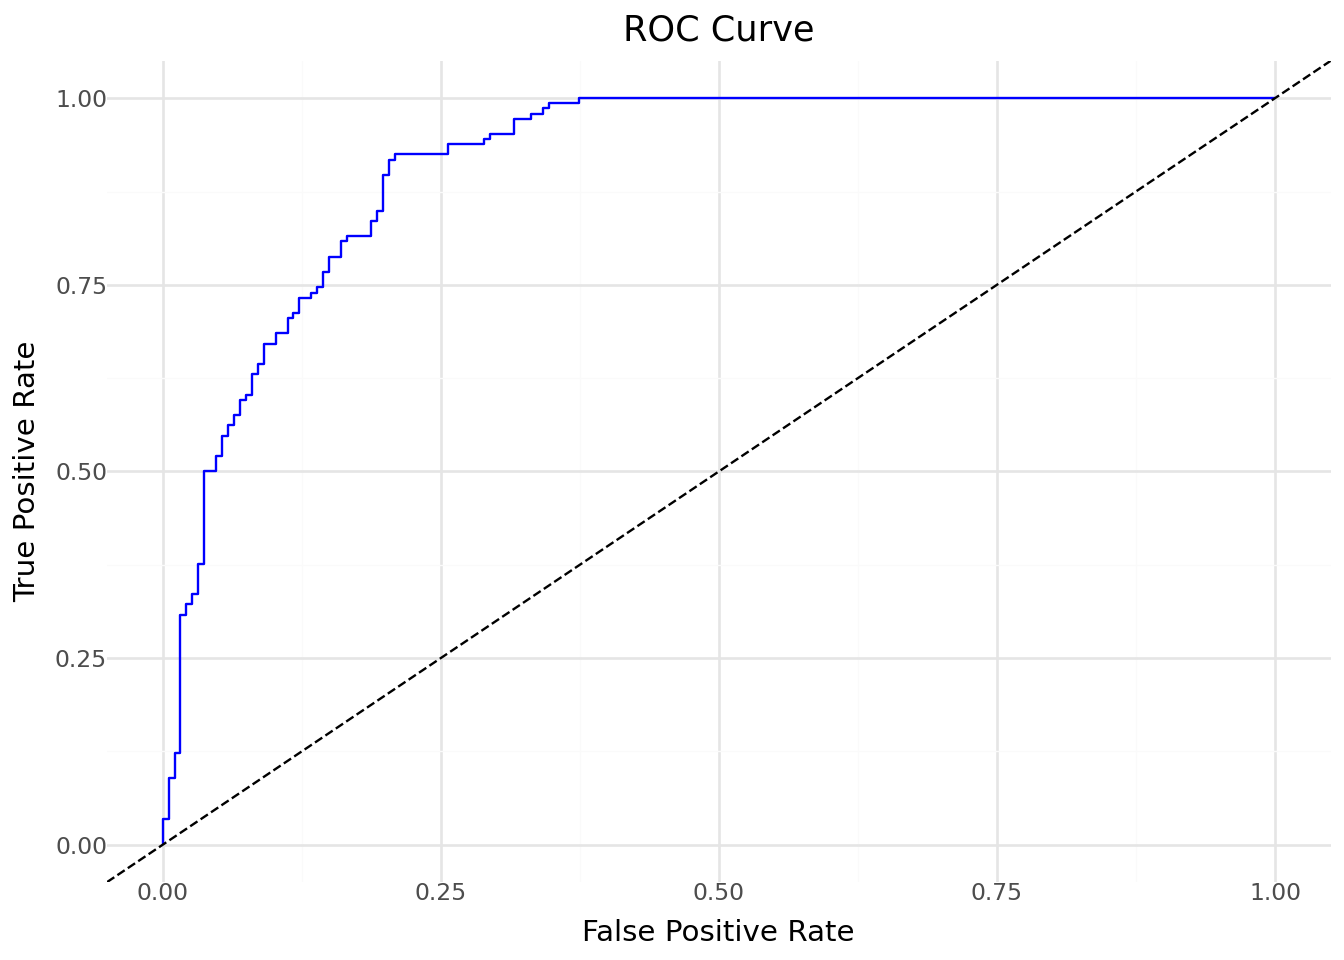
from sklearn.metrics import roc_curve, auc

fpr, tpr, _ = roc_curve(penguins['is_adelie'], penguins['pred_prob'])
roc_df = pd.DataFrame({'fpr': fpr, 'tpr': tpr})

(
    ggplot(roc_df, aes(x='fpr', y='tpr')) +
    geom_line(color='blue') +
    geom_abline(slope=1, intercept=0, linetype='dashed') +
    labs(title="ROC Curve", x="False Positive Rate", y="True Positive Rate") +
    theme_minimal()
)
import numpy as np
coefs = model.params.drop("Intercept")
errors = model.bse.drop("Intercept")
coef_df = pd.DataFrame({
'term': coefs.index,
'estimate': coefs.values,
'lower': coefs - 1.96 * errors,
'upper': coefs + 1.96 * errors
})
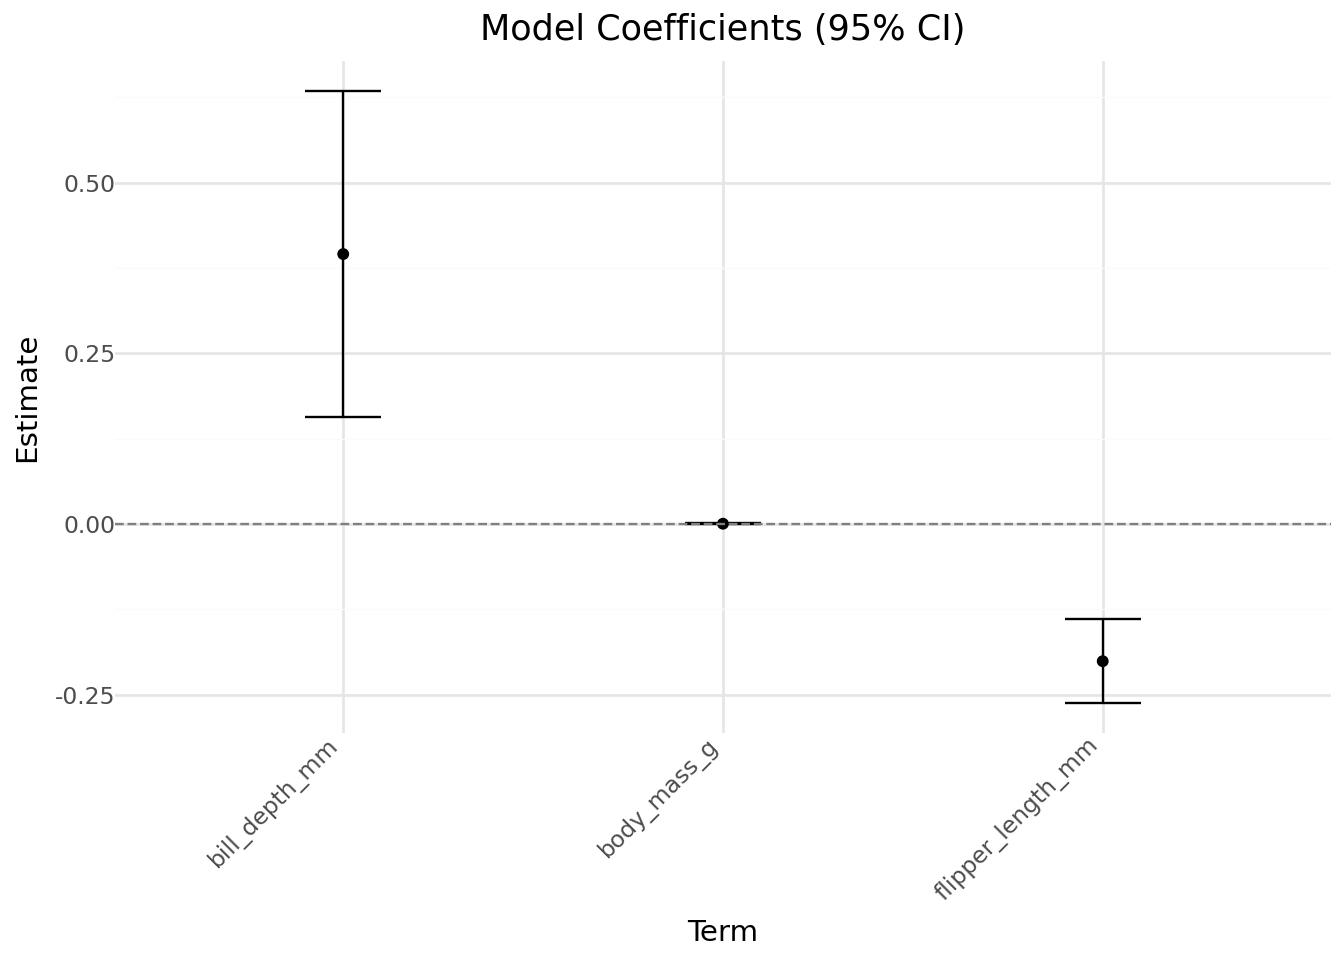
(
ggplot(coef_df, aes(x='term', y='estimate')) +
geom_point() +
geom_errorbar(aes(ymin='lower', ymax='upper'), width=0.2) +
geom_hline(yintercept=0, linetype='dashed', color='gray') +
labs(title="Model Coefficients (95% CI)", y="Estimate", x="Term") +
theme_minimal() +
theme(axis_text_x=element_text(rotation=45, hjust=1))
)
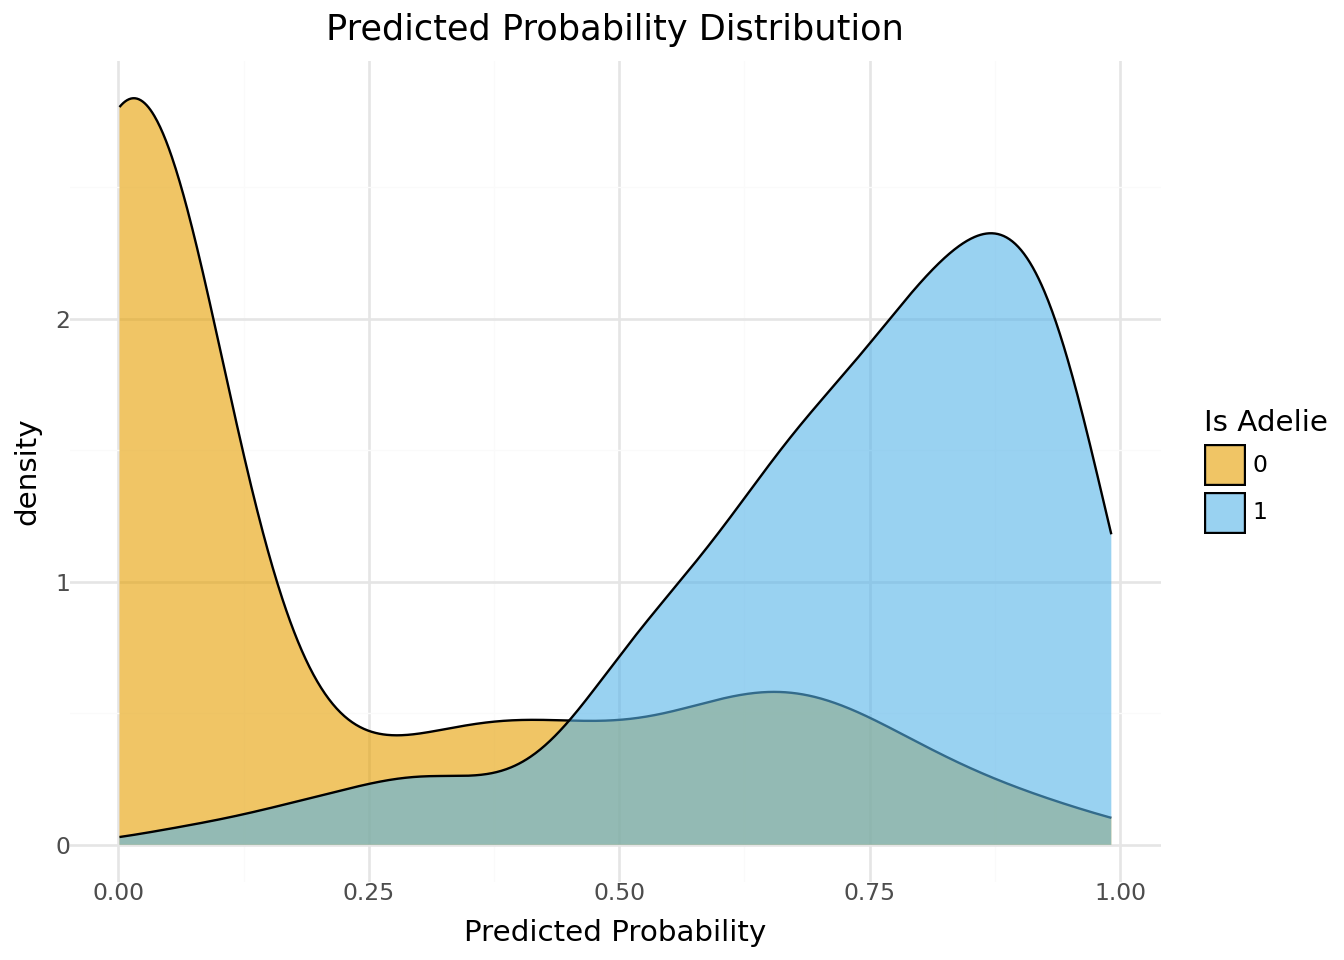
(
    ggplot(penguins, aes(x='pred_prob', fill='factor(is_adelie)')) +
    geom_density(alpha=0.6) +
    scale_fill_manual(values=['#E69F00', '#56B4E9'], name="Is Adelie") +
    labs(title="Predicted Probability Distribution", x="Predicted Probability") +
    theme_minimal()
)