Import and prototype
We’ll be using palmerpenguins for the dataset, and plotnine to visualize the palmer penguin’s bill_length_mm column as a histogram.
from palmerpenguins import load_penguins= load_penguins()
0
Adelie
Torgersen
39.1
18.7
181.0
3750.0
male
2007
1
Adelie
Torgersen
39.5
17.4
186.0
3800.0
female
2007
2
Adelie
Torgersen
40.3
18.0
195.0
3250.0
female
2007
3
Adelie
Torgersen
NaN
NaN
NaN
NaN
NaN
2007
4
Adelie
Torgersen
36.7
19.3
193.0
3450.0
female
2007
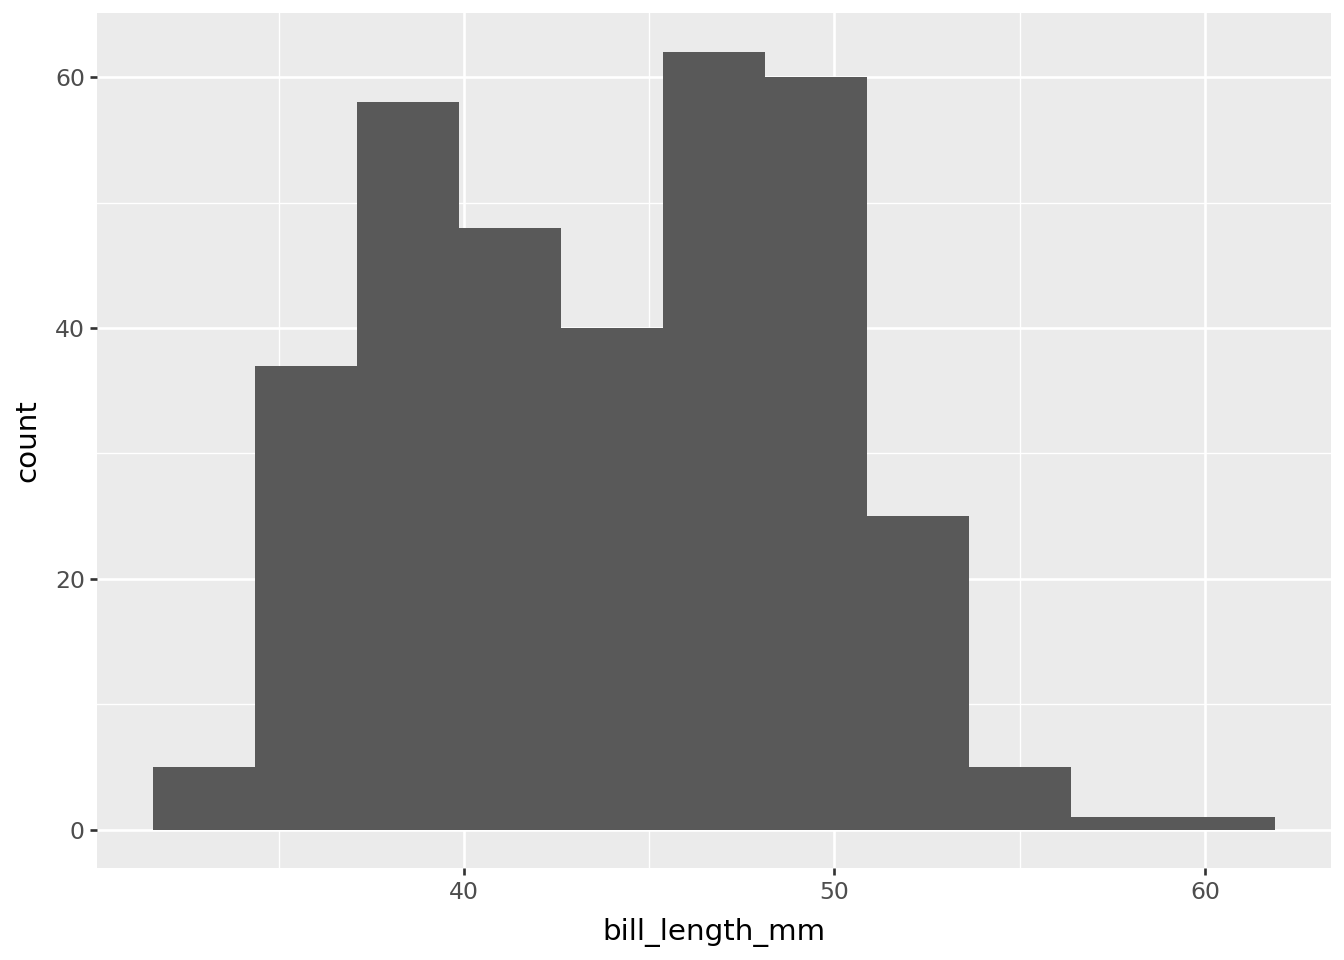
We’ll be creating a base histogram using plotnine as follows:
from plotnine import aes, geom_histogram, ggplot, theme_minimal= ggplot(penguins, aes(x= "bill_length_mm" )) + geom_histogram()
Add some layers
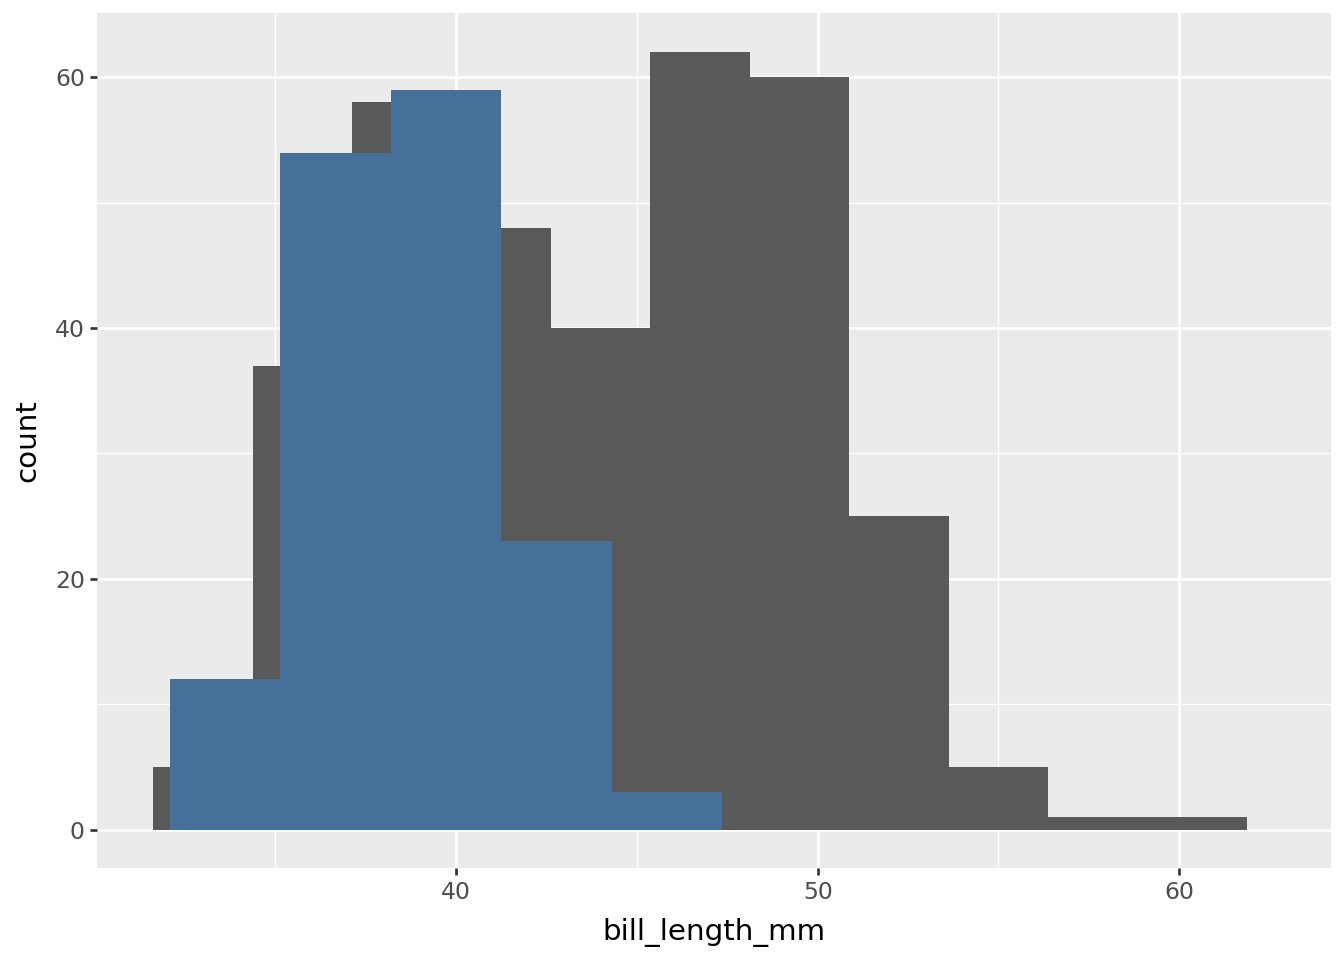
Now we want to highlight part of the histogram. We do this by adding another data and aesthetic layer to our plotnine figure.
= "Adelie" # selected species = penguins.loc[penguins.species == species] # selected data
0
Adelie
Torgersen
39.1
18.7
181.0
3750.0
male
2007
1
Adelie
Torgersen
39.5
17.4
186.0
3800.0
female
2007
2
Adelie
Torgersen
40.3
18.0
195.0
3250.0
female
2007
3
Adelie
Torgersen
NaN
NaN
NaN
NaN
NaN
2007
4
Adelie
Torgersen
36.7
19.3
193.0
3450.0
female
2007
...
...
...
...
...
...
...
...
...
147
Adelie
Dream
36.6
18.4
184.0
3475.0
female
2009
148
Adelie
Dream
36.0
17.8
195.0
3450.0
female
2009
149
Adelie
Dream
37.8
18.1
193.0
3750.0
male
2009
150
Adelie
Dream
36.0
17.1
187.0
3700.0
female
2009
151
Adelie
Dream
41.5
18.5
201.0
4000.0
male
2009
152 rows × 8 columns
Now that we have the new data, we can add the new selected dataframe to our original figure, g
+ geom_histogram(data= selected, fill= "#447099" )
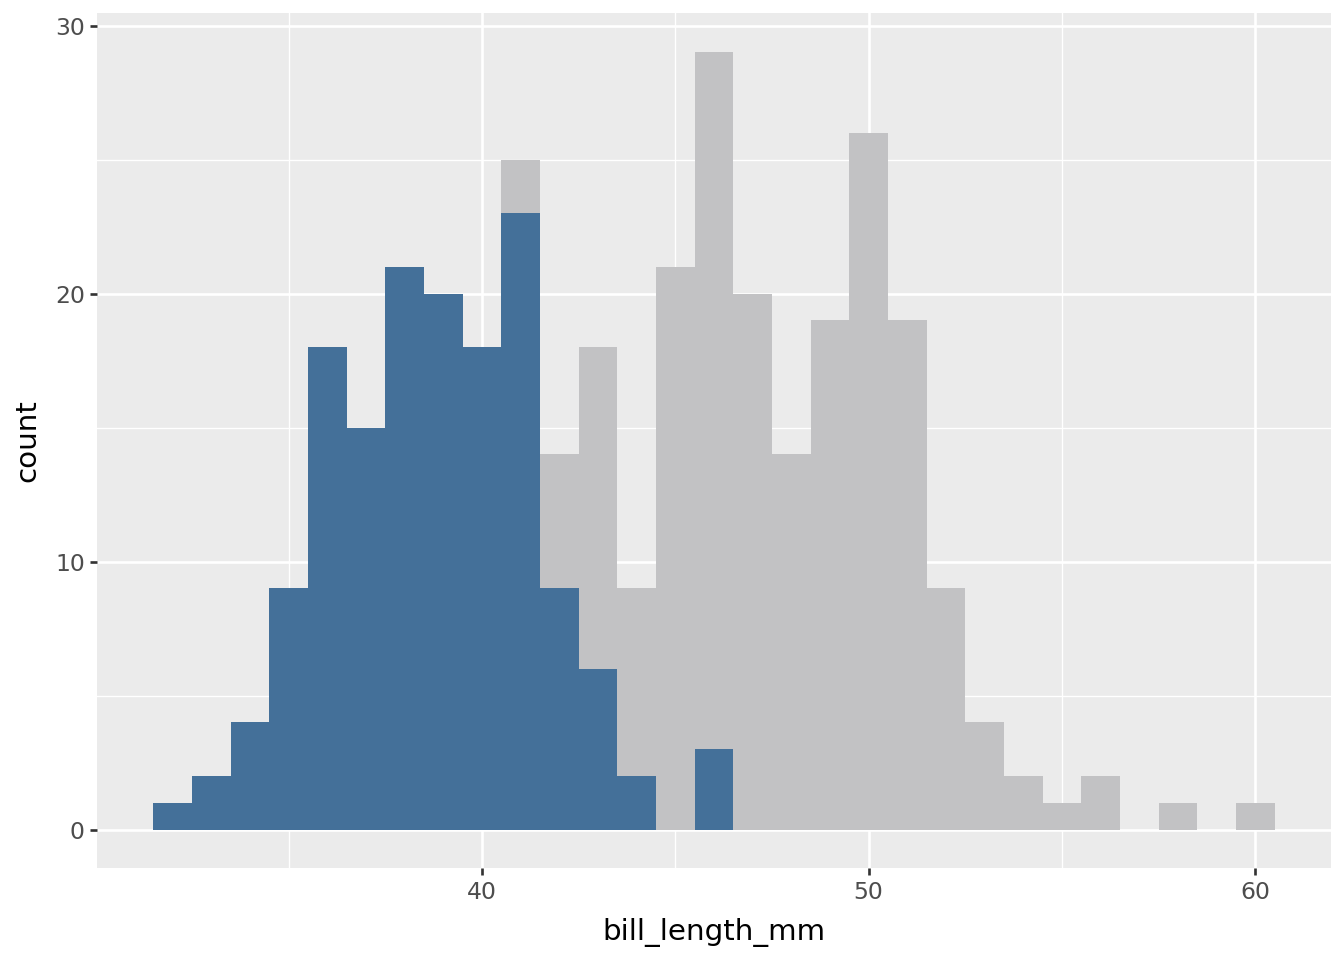
Fix up the histogram
The 2 different bill_length_mm are plotted as independent histograms, so the auto binning is causing the bars to not line up. Let’s re-create our plot and also set a uniform bin width by setting binwidth=1.
= "bill_length_mm" ))+ geom_histogram(penguins, fill= "#C2C2C4" , binwidth= 1 )+ geom_histogram(selected, fill= "#447099" , binwidth= 1 )