
While querychat_app() provides a quick way to start
exploring data, building bespoke Shiny apps with querychat unlocks the
full power of integrating natural language data exploration with custom
visualizations, layouts, and interactivity. This guide shows you how to
integrate querychat into your own Shiny applications and leverage its
reactive data outputs to create rich, interactive experiences.
querychat lets users ask questions of their data in plain language — filtering, sorting, summarizing, joining across tables, and creating visualizations — all without needing to write SQL or navigate complex filter UIs. You can use it as the primary exploration interface in a standalone app, or embed it alongside curated views in an existing dashboard to let users go deeper than the views you designed.
This is especially valuable when:
- Your data has many columns and building a UI for all possible filters would be overwhelming
- Users want to explore ad-hoc combinations of filters that you didn’t anticipate
- You have multiple related tables that users may want to query and join
- You want to make data exploration more accessible to non-technical users
Starter template
Integrating querychat into a Shiny app requires just three steps:
- Initialize a
QueryChatinstance with your data - Add the UI component (
$page(),$sidebar(), or$ui()) - Use reactive values like
$df(),$sql(), and$title()to build outputs that respond to user queries
Here’s a starter template demonstrating these steps:
library(shiny)
library(bslib)
library(querychat)
library(DT)
library(palmerpenguins)

# Step 1: Initialize QueryChat
qc <- QueryChat$new(penguins)

# Step 2: Add UI component
ui <- page_sidebar(
  sidebar = qc$sidebar(),
  card(
    card_header("Data Table"),
    dataTableOutput("table")
  ),
  card(
    fill = FALSE,
    card_header("SQL Query"),
    verbatimTextOutput("sql")
  )
)

# Step 3: Use reactive values in server
server <- function(input, output, session) {
  qc_vals <- qc$server()

  output$table <- renderDataTable({
    datatable(qc_vals$df(), fillContainer = TRUE)
  })

  output$sql <- renderText({
    qc_vals$sql() %||% "SELECT * FROM penguins"
  })
}

shinyApp(ui, server)
You’ll need to call the qc$server() method within your
server function to set up querychat’s reactive behavior, and capture its
return value to access reactive data.
Chat-first page
The starter template above uses $sidebar() to embed the
chat alongside your data views. When the chat is the primary way users
interact with your app, use $page() instead to give it the
full browser window. It wraps shinychat::page_chat(),
which provides a persistent chat with conversation history, plus
optional navigation pages, sidebars, and a drawer. Reactive data views
(driven by $df(), $sql(),
$title()) work well as secondary pages via
shinychat::chat_nav_panel():
library(shiny)
library(bslib)
library(querychat)
library(DT)
library(palmerpenguins)

qc <- QueryChat$new(penguins)

ui <- qc$page(
  "Penguins Explorer",
  pages_navbar = list(
    shinychat::chat_nav_panel(
      "Data",
      card(
        card_header(textOutput("title")),
        dataTableOutput("table"),
        fill = TRUE
      ),
      value = "data",
      sidebar = FALSE,
      content_width = "100%"
    )
  )
)

server <- function(input, output, session) {
  qc_vals <- qc$server()

  output$table <- renderDataTable({
    datatable(qc_vals$df(), fillContainer = TRUE)
  })

  output$title <- renderText({
    qc_vals$title() %||% "Penguins Dataset"
  })
}

shinyApp(ui, server)
Since $page() owns the entire page layout, don’t wrap it
in another page container (e.g., page_sidebar()). If you
need the chat embedded alongside other content in a custom layout, use
$sidebar() or $ui() instead.
Deferred data sources
Some data sources, like database connections or reactive
calculations, may need to be created within an active Shiny session. To
help support this, QueryChat allows you to initialize
without a data source and provide it later, like this:
library(shiny)
library(bslib)
library(querychat)

# Global scope - create QueryChat without data source
qc <- QueryChat$new(NULL, "users")

ui <- page_sidebar(
  sidebar = qc$sidebar(),
  card(dataTableOutput("table"))
)

server <- function(input, output, session) {
  # Server scope - create connection with session credentials
  conn <- get_user_connection(session)
  qc_vals <- qc$server(data_source = conn)

  output$table <- renderDataTable({
    qc_vals$df()
  })
}

shinyApp(ui, server)
A data source passed to $server() belongs to that
session: other sessions never see it, it does not change the tables
registered on the QueryChat object, and querychat cleans up
any connection it created for it when the session ends. Connections you
open yourself are yours to close; session$onSessionEnded()
is a good place.
If your chat client also depends on session-scoped credentials, you
can defer that too by passing it to qc$server(client = ...)
alongside the data_source.
This is also a useful pattern when using something like {pool} to
efficiently manage a pool of database connections (which we strongly
recommend for production apps).
Reactives
There are three main reactive values provided by querychat for use in your app:
Filtered data
The $df() method returns the current filtered and/or
sorted data frame. This updates whenever the user prompts a filtering or
sorting operation through the chat interface (see Data updating for details).
qc_vals <- qc$server()

output$table <- renderDataTable({
  qc_vals$df()  # Returns filtered/sorted data
})
You can use $df() to power any output in your app -
visualizations, summary statistics, data tables, and more. When a user
asks to “show only Adelie penguins” or “sort by body mass”,
$df() automatically updates, and any outputs that depend on
it will re-render.
SQL query
The $sql() method returns the current SQL query as a
string. This is useful for displaying the query to users for
transparency and reproducibility:
qc_vals <- qc$server()

output$current_query <- renderText({
  qc_vals$sql() %||% "SELECT * FROM penguins"
})
You can also use $sql() as a setter to programmatically
update the query (see Programmatic
filtering below).
Title
The $title() method returns a short description of the
current filter, provided by the LLM when it generates a query. For
example, if a user asks to “show Adelie penguins”, the title might be
“Adelie penguins”.
qc_vals <- qc$server()

output$card_title <- renderText({
  qc_vals$title() %||% "All Data"
})
Returns NULL when no filter is active. You can also use
$title() as a setter to update the title
programmatically.
Custom UI
In the starter template above, we used the $sidebar()
method for a simple sidebar layout. In some cases, you might want to
place the chat UI somewhere else in your app layout, or just more fully
customize what goes in the sidebar. The $ui() method is
designed for this – it returns the chat component without additional
layout wrappers.
For example, you might want to create some additional controls to reset filters alongside the chat UI:
library(querychat)
library(palmerpenguins)

qc <- QueryChat$new(penguins)

ui <- page_sidebar(
  sidebar = sidebar(
    qc$ui(),  # Chat component
    actionButton("reset", "Reset Filters", class = "w-100"),
    fillable = TRUE,
    width = 300
  ),
  # Main content here
)Data views
Thanks to Shiny’s support for interactive visualizations with packages like plotly, it’s straightforward to create rich data views that depend on QueryChat data. Here’s an example of an app showing both the filtered data and a bar chart depending on that same data:
app.R
library(shiny)
library(bslib)
library(querychat)
library(DT)
library(plotly)
library(palmerpenguins)

qc <- QueryChat$new(penguins, client = "claude/claude-sonnet-4-5")

ui <- page_sidebar(
  sidebar = qc$sidebar(),
  card(
    card_header("Data Table"),
    dataTableOutput("table")
  ),
  card(
    card_header("Body Mass by Species"),
    plotlyOutput("mass_plot")
  )
)

server <- function(input, output, session) {
  qc_vals <- qc$server()

  output$table <- renderDataTable({
    datatable(qc_vals$df(), fillContainer = TRUE)
  })

  output$mass_plot <- renderPlotly({
    ggplot(qc_vals$df(), aes(x = body_mass_g, fill = species)) +
      geom_density(alpha = 0.4) +
      theme_minimal()
  })
}

shinyApp(ui, server)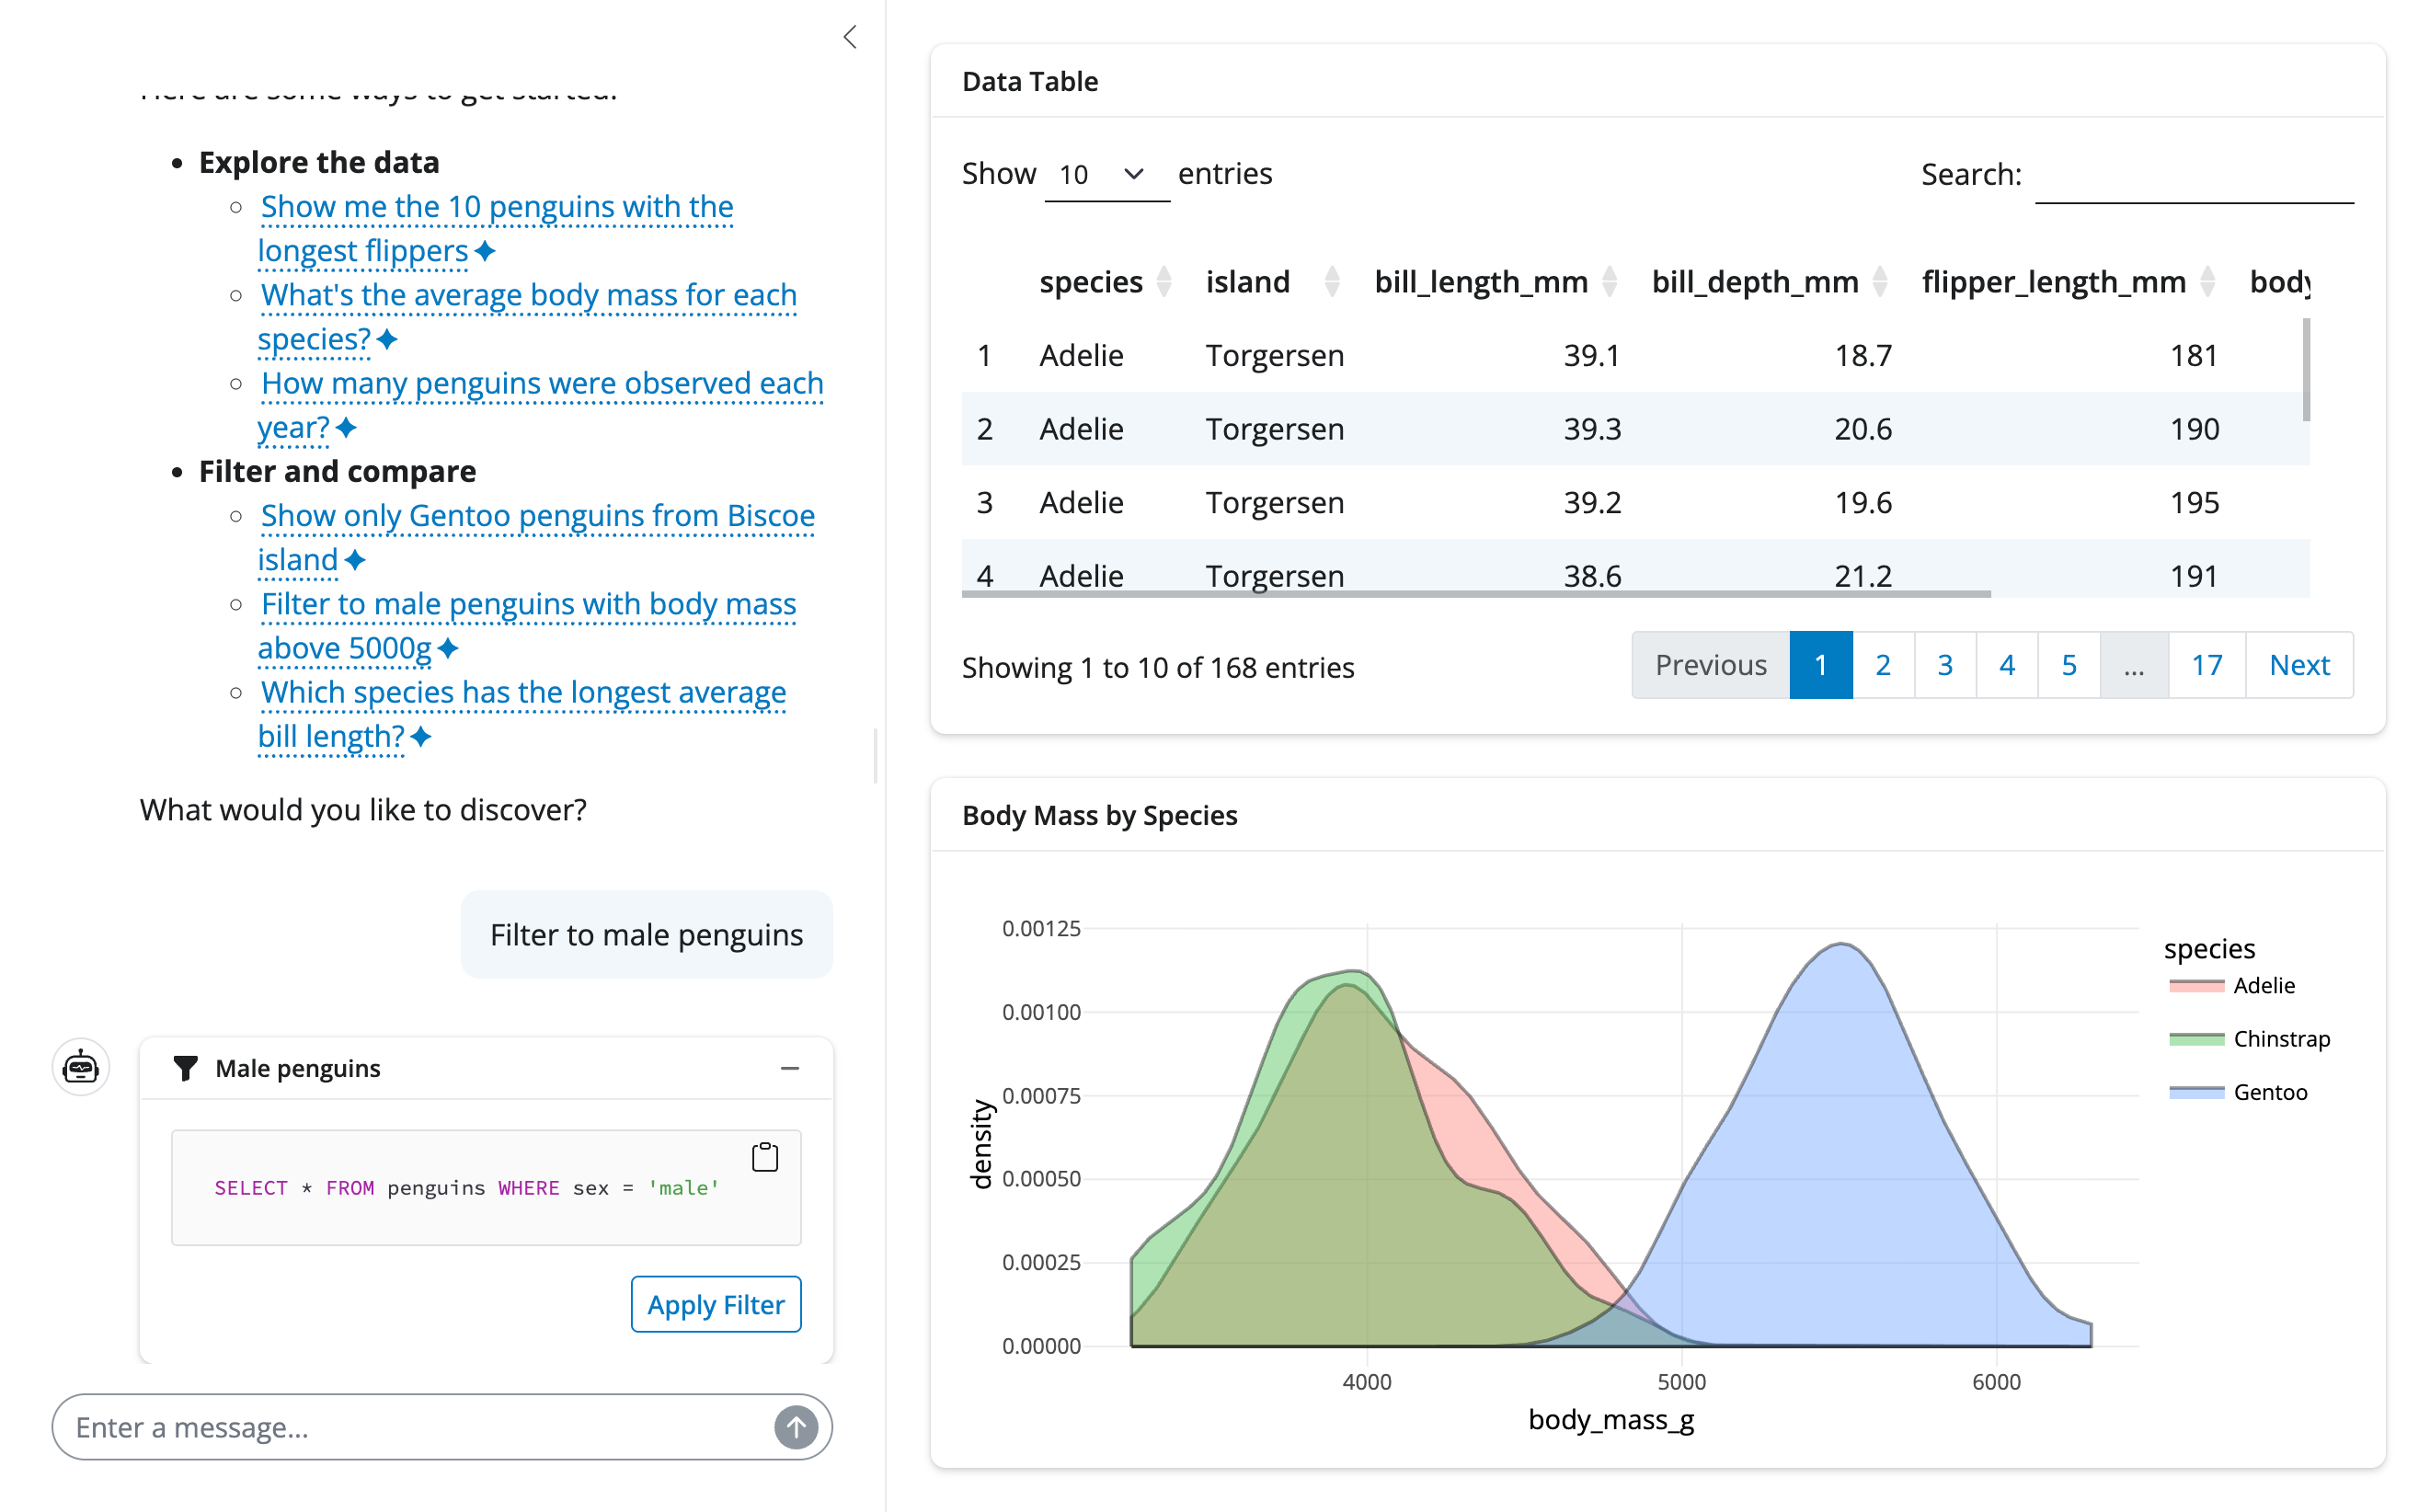
A more useful, but slightly more involved example like the one below might incorporate other Shiny components like value boxes to summarize key statistics about the filtered data.
app.R
library(shiny)
library(bslib)
library(DT)
library(plotly)
library(palmerpenguins)
library(dplyr)
library(bsicons)
library(querychat)


qc <- QueryChat$new(penguins)

ui <- page_sidebar(
  title = "Palmer Penguins Analysis",
  class = "bslib-page-dashboard",
  sidebar = qc$sidebar(),
  layout_column_wrap(
    width = 1 / 3,
    fill = FALSE,
    value_box(
      title = "Total Penguins",
      value = textOutput("count"),
      showcase = bs_icon("piggy-bank"),
      theme = "primary"
    ),
    value_box(
      title = "Species Count",
      value = textOutput("species_count"),
      showcase = bs_icon("bookmark-star"),
      theme = "success"
    ),
    value_box(
      title = "Avg Body Mass",
      value = textOutput("avg_mass"),
      showcase = bs_icon("speedometer"),
      theme = "info"
    )
  ),
  layout_columns(
    card(
      card_header(textOutput("table_title")),
      DT::dataTableOutput("data_table")
    ),
    card(
      card_header("Species Distribution"),
      plotlyOutput("species_plot")
    )
  ),
  layout_columns(
    card(
      card_header("Bill Length Distribution"),
      plotlyOutput("bill_length_dist")
    ),
    card(
      card_header("Body Mass by Species"),
      plotlyOutput("mass_by_species")
    )
  )
)

server <- function(input, output, session) {
  qc_vals <- qc$server()

  output$count <- renderText({
    nrow(qc_vals$df())
  })

  output$species_count <- renderText({
    length(unique(qc_vals$df()$species))
  })

  output$avg_mass <- renderText({
    avg <- mean(qc_vals$df()$body_mass_g, na.rm = TRUE)
    paste0(round(avg, 0), "g")
  })

  output$table_title <- renderText({
    qc_vals$title() %||% "All Penguins"
  })

  output$data_table <- DT::renderDataTable({
    DT::datatable(
      qc_vals$df(),
      fillContainer = TRUE,
      options = list(
        scrollX = TRUE,
        pageLength = 10,
        dom = "ti"
      )
    )
  })

  output$species_plot <- renderPlotly({
    plot_ly(
      count(qc_vals$df(), species),
      x = ~species,
      y = ~n,
      type = "bar",
      marker = list(color = c("#1f77b4", "#ff7f0e", "#2ca02c"))
    )
  })

  output$bill_length_dist <- renderPlotly({
    plot_ly(
      qc_vals$df(),
      x = ~bill_length_mm,
      type = "histogram",
      nbinsx = 30,
      marker = list(color = "#1f77b4", opacity = 0.7)
    )
  })

  output$mass_by_species <- renderPlotly({
    plot_ly(
      qc_vals$df(),
      x = ~species,
      y = ~body_mass_g,
      color = ~sex,
      type = "box",
      colors = c("#1f77b4", "#ff7f0e")
    )
  })
}

shinyApp(ui = ui, server = server)
Programmatic updates
querychat’s reactive state can be updated programmatically. For example, you might want to add a “Reset Filters” button that clears any active filters and returns the data table to its original state. You can do this by setting both the SQL query and title to their default values. This way you don’t have to rely on both the user and LLM to send the right prompt.
ui <- page_sidebar(
  sidebar = sidebar(
    qc$ui(),
    hr(),
    actionButton("reset", "Reset Filters")
  ),
  # Main content
  card(dataTableOutput("table"))
)

server <- function(input, output, session) {
  qc_vals <- qc$server()

  output$table <- renderDataTable({
    qc_vals$df()
  })

  observeEvent(input$reset, {
    qc_vals$sql("")
    qc_vals$title(NULL)
  })
}

shinyApp(ui, server)
This is equivalent to the user asking the LLM to “reset” or “show all data”.
Multiple tables
querychat can work with multiple related tables in a single chat
interface, letting users query across tables, join data, and filter any
table independently. Register additional tables with
$add_table() after creating the QueryChat
instance, then access per-table state through the $table()
method.
Registering tables
Pass the first table when creating QueryChat, then call
$add_table() for each additional table:
library(querychat)

qc <- QueryChat$new(orders, "orders")
qc$add_table(customers, "customers")
qc$add_table(products, "products")
If your data lives in a DBI connection, use
$add_tables() to register all tables in a single call:
library(DBI)

con <- dbConnect(RSQLite::SQLite(), "store.db")
qc <- QueryChat$new()
qc$add_tables(con)                            # all tables
qc$add_tables(con, c("orders", "customers"))  # specific subset
The LLM can query any registered table and write joins across them.
You can inspect which tables are registered with
qc$table_names().
Per-table reactive access
When working with multiple tables, access filtered data and SQL for
each table individually using $table():
server <- function(input, output, session) {
  qc_vals <- qc$server()

  output$orders_table <- renderDataTable({
    qc_vals$table("orders")$df()
  })

  output$orders_sql <- renderText({
    qc_vals$table("orders")$sql()
  })

  output$customers_table <- renderDataTable({
    qc_vals$table("customers")$df()
  })
}
Each table has its own $df(), $sql(), and
$title() reactives that update independently when the user
filters that specific table.
Tracking the active table
Use $current_table() to find out which table the LLM
most recently queried. This is useful for auto-switching a tabbed UI to
the relevant table:
observe({
  tbl <- qc_vals$current_table()
  req(tbl)
  nav_select("table_tabs", selected = tbl)
})
Data dictionary
When working with multiple related tables, providing a data dictionary is strongly recommended. It tells the LLM how tables relate to each other, which columns are keys, and what domain terms mean — all of which help it write accurate joins and queries.
qc <- QueryChat$new(
  orders, "orders",
  data_dict = "data-dict.yaml"
)
qc$add_table(customers, "customers")
See Provide context for the full data dictionary format.
Separate chat interfaces
If your tables are truly independent (not related), you may prefer
separate QueryChat instances, each with its own chat
interface:
app.R
library(shiny)
library(bslib)
library(palmerpenguins)
library(titanic)
library(querychat)

qc_penguins <- QueryChat$new(penguins)
qc_titanic <- QueryChat$new(titanic_train)

ui <- page_navbar(
  title = "Multiple Datasets",
  sidebar = sidebar(
    id = "sidebar",
    conditionalPanel(
      "input.navbar == 'Penguins'",
      qc_penguins$ui()
    ),
    conditionalPanel(
      "input.navbar == 'Titanic'",
      qc_titanic$ui()
    )
  ),
  nav_panel(
    "Penguins",
    card(dataTableOutput("penguins_table"))
  ),
  nav_panel(
    "Titanic",
    card(dataTableOutput("titanic_table"))
  ),
  id = "navbar"
)

server <- function(input, output, session) {
  qc_penguins_vals <- qc_penguins$server()
  qc_titanic_vals <- qc_titanic$server()

  output$penguins_table <- renderDataTable({
    qc_penguins_vals$df()
  })

  output$titanic_table <- renderDataTable({
    qc_titanic_vals$df()
  })
}

shinyApp(ui, server)
See also
- Greet users - Create welcoming onboarding experiences
- Provide context - Help the LLM understand your data better
- Tools - Understand what querychat can do under the hood